Test Topics
1/79
There's no tags or description
Looks like no tags are added yet.
Name | Mastery | Learn | Test | Matching | Spaced | Call with Kai |
|---|
No analytics yet
Send a link to your students to track their progress
80 Terms
What is the Circular Flow of Income?
A simplified model showing the flow of money, resources, and goods/services between two main actors: Households and Firms.
Households provide factors of production (Labor, Land, Capital) to firms.
Firms provide goods and services to households.
Essay Logic: It demonstrates that National Income = National Output = National Expenditure. This is the fundamental identity of GDP.
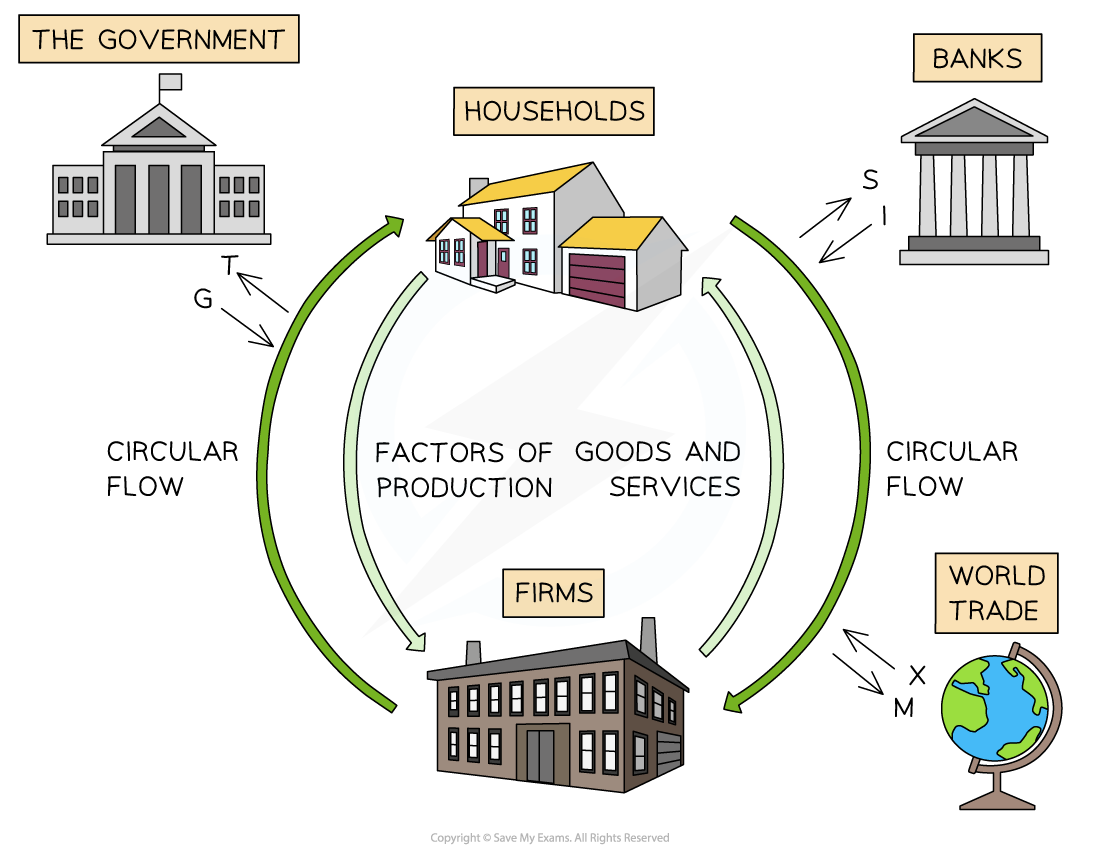
The Two Flows (Real vs. Money)
Real Flow: The actual movement of physical things (workers going to factories, loaves of bread being sold).
Money Flow: The payments for those things (wages paid to workers, prices paid for bread).
Essay Logic: Inflation occurs when the Money Flow grows faster than the Real Flow (too much money chasing too few physical goods).
Define the Factors of Production and their corresponding Factor Incomes.
Households supply factors of production to firms in exchange for factor incomes:
Land → Rent
Labour → Wages
Capital → Interest
Enterprise → Profit
Define Injections (J) and list the three types.
Money entering the circular flow from outside sources, increasing the size of the economy.
Investment (I): Firms spending on capital (new machinery).
Government Spending (G): Spending on schools, roads, or salaries.
Exports (X): Money coming from foreigners buying domestic goods.
Essay Logic: If J > L (Leakages), the economy experiences economic growth.
Define Leakages and list the three types
Money leaving the circular flow, reducing the amount available for domestic firms.
Savings (S): Money kept in banks rather than spent.
Taxes (T): Money taken by the government.
Imports (M): Money sent abroad to buy foreign goods.
Essay Logic: High leakages lead to a contraction in GDP and can cause unemployment.
What happens when Injections do not equal Leakages?
Equilibrium: Total Leakages = Total Injections (S+T+M=I+G+X)
If Injections > Leakages: National Income rises.
If Leakages > Injections: National Income falls.
Essay Logic (The Multiplier): This is your "Star Point." An injection (like G) has a multiplier effect. Occurs when an initial injection into the circular flow causes a proportionately larger final increase in national income.
(Example: Gov. builds a hospital → workers get wages → workers spend wages at local shops → shop owners get income...)
Formula for the curious: Multiplier = 1/(1 - MPC) (where MPC is the marginal propensity to consume).
Transmission Mechanism: Explain how the Central Bank fixes an economy when in a Recession.
A Central Bank may utilise expansionary monetary policy.
Central bank lowers base interest rates.
Cost of borrowing falls, and incentive to save falls.
Savings (Leakage) decrease.
Credit-fueled consumption (C) & business investment (I) increase (Injections).
Aggregate Demand shifts right, returning economy to equilibrium.
This increases output, raising national income and returning the circular flow to a state of equilibrium.
What are the four sectors in a complete Circular Flow model?
1. Households: Owners of resources and consumers.
2. Firms: Producers of goods.
3. Government: Collects taxes (L) and spends (J).
4. Foreign Sector: Handles Imports (L) and Exports (J).
Essay Logic: In a globalised world, a "shock" in the Foreign Sector (like a trade war) acts as a leakage that can cause a recession at home.
What are the Limitations of the Circular Flow Model?
Ignores the "shadow economy" (cash-in-hand/illegal jobs) and unpaid domestic labor.
It is purely quantitative: it measures output but ignores income inequality, wealth distribution, and environmental degradation.
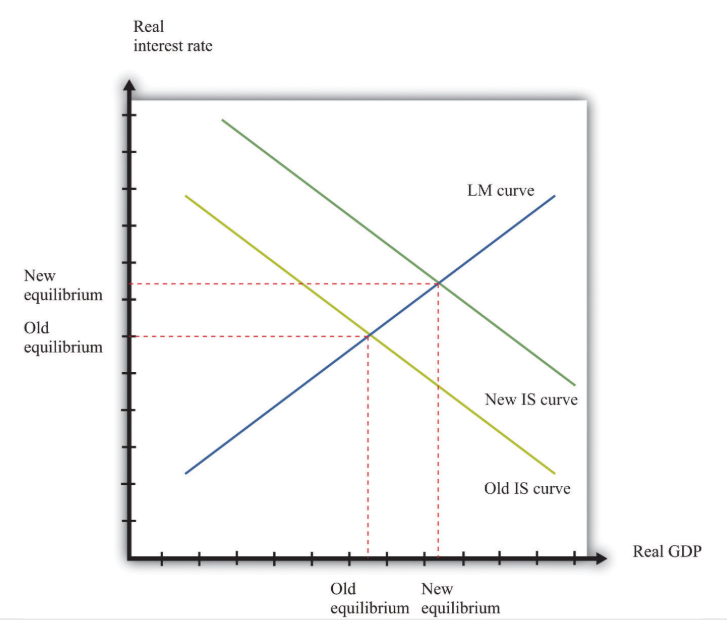
The IS Curve (Goods Market)
Definition: Shows all combinations of interest rates (i) and National Income (Y) where the Goods Market is in equilibrium.
Logic: It slopes downward. When interest rates fall, it’s cheaper for firms to borrow to buy machinery and for households to buy houses/cars. This increases Investment (I) and Consumption (C), pushing up GDP (Y).
Essay Analysis: * Shift Right: Expansionary Fiscal Policy (more Govt spending or lower taxes) moves the IS curve right.
Result: Higher GDP, but usually higher interest rates too.
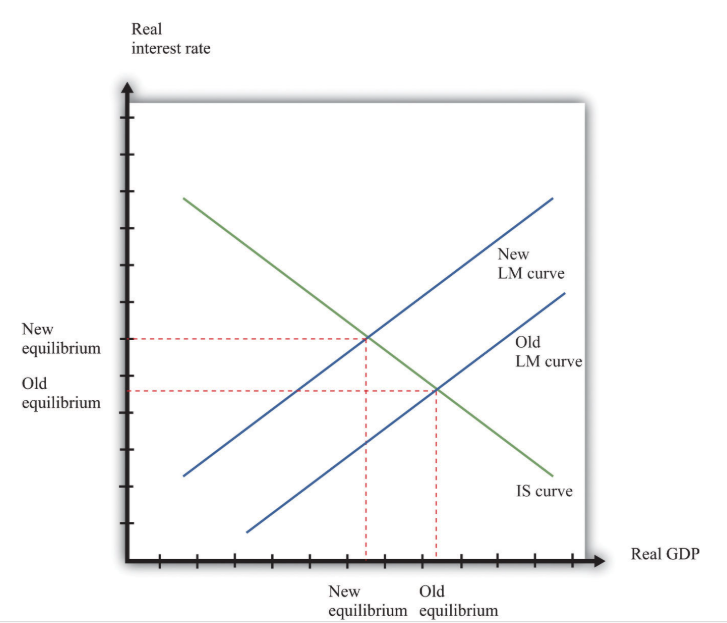
The LM Curve (Money Market)
Definition: Shows all combinations of i and Y where the Money Market (demand for money vs. supply of money) is in equilibrium.
Logic: It slopes upward. When income (Y) rises, people want to hold more cash for transactions. This increased demand for money pushes interest rates (i) up.
Essay Analysis: * Shift Right: Expansionary Monetary Policy (Central Bank increases the money supply) moves the LM curve right.
Result: Lower interest rates and higher GDP.
Crowding Out
Concept: What happens when the government spends too much?
Mechanism: To spend more, the Govt borrows money, which shifts the IS curve right. This increases GDP, but the higher demand for money pushes interest rates up. High interest rates then "crowd out" private investment.
Evaluation: If "crowding out" is total, the increase in Govt spending is cancelled out by the drop in private investment.
Aggregate Demand (AD)
Formula: AD = C + I + G + (X - M).
Consumption + Investment + Gov Spending + (Exports - Imports)
Logic: It slopes downward. As the general price level falls, people feel richer (Wealth Effect) and interest rates usually drop, so they spend more.
Essay Analysis: Anything that changes C, I, G, or Net Exports shifts the AD curve. For example, a "Consumer Confidence" boom shifts AD to the right.
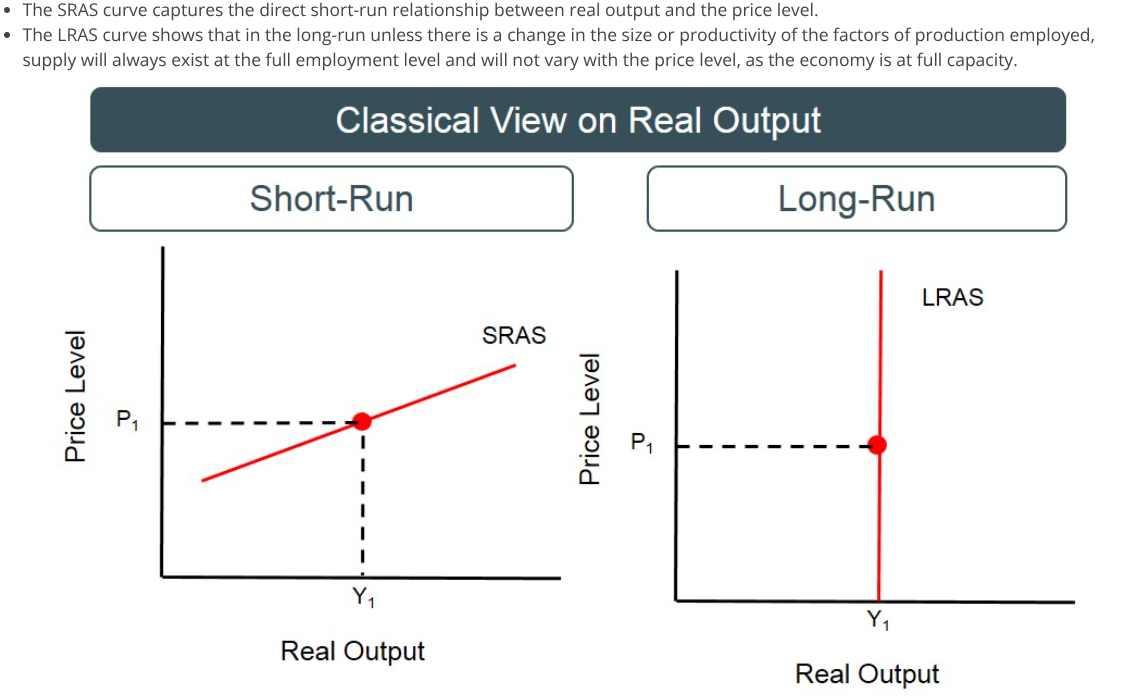
Aggregate Supply (SRAS vs. LRAS)
SRAS (Short Run): Upward sloping. It shifts based on costs of production (wages, raw materials like oil, electricity).
LRAS (Long Run): A vertical line. It represents the maximum "Potential GDP" a country can produce using all its resources.
Essay Analysis: If the economy is producing at a point to the right of the LRAS, it is "overheating," leading to high inflation.
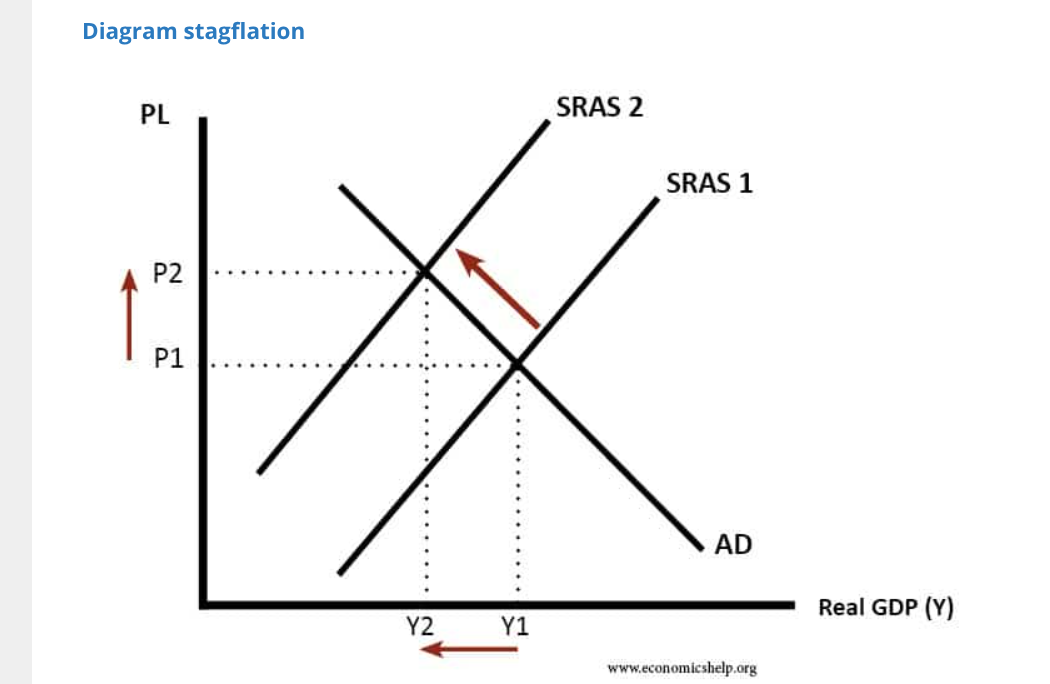
Supply-Side Shocks (Stagflation)
Concept: A sudden increase in production costs (e.g., an oil price spike).
Mechanism: The SRAS curve shifts left.
Result: Prices go UP (Inflation) and GDP goes DOWN (Unemployment).
Evaluation: This is a nightmare for policymakers. If they increase spending to fix unemployment, they make inflation worse. If they cut spending to fix inflation, they make unemployment worse.
What is the official definition of unemployment?
People of working age who are willing and able to work, are actively seeking work, but do not currently have a job.
Essay Logic: Be careful! A student or a retired person is not unemployed; they are "economically inactive" because they aren't seeking work. The Labor Force = Employed + Unemployed.
What are Frictional and Structural unemployment?
Frictional: Short-term. People "between jobs" or looking for their first job. It’s actually healthy—it shows people are looking for better matches.
Structural: Long-term and "scary." Caused by a mismatch between worker skills and the jobs available (e.g., a coal miner in a world of green energy).
Essay Logic: Structural unemployment requires Supply-Side Policies (retraining/education), not just printing more money.
What causes Cyclical unemployment?
A lack of Aggregate Demand (AD). During a recession, people spend less < firms sell less < firms need fewer workers.
Essay Logic: Use an AD-AS diagram here. Show the AD curve shifting to the left. The gap between the new equilibrium and "Full Employment" is your cyclical unemployment.
Why is high unemployment a problem for the government?
1. Lost Output: The economy is producing inside its Production Possibility Frontier (PPF).
2. Fiscal Pressure: Tax revenue falls (less Income Tax/VAT) while government spending rises (welfare/benefits).
3. Hysteresis: The longer people are unemployed, the more their skills "rust," making them permanently unemployable.
Essay Logic: This creates a Budget Deficit, which limits the government's ability to spend on things like healthcare or schools.
What is Real-Wage unemployment?
When wages are pushed above the equilibrium level, creating a "surplus" of labor (more people want to work than firms want to hire).
Causes: Minimum wage laws or powerful Trade Unions.
Essay Logic: This is a "Classical" view. It suggests that if you just lowered wages, unemployment would disappear (though this is highly controversial in real-world politics)
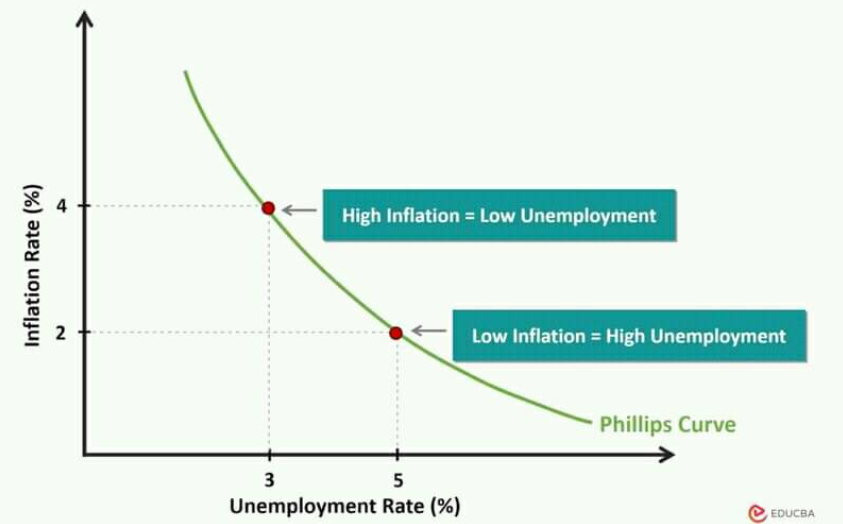
What does the Phillips Curve show?
An inverse relationship between Inflation and Unemployment in the short run.
Low Unemployment = High Inflation (workers have "bargaining power" to ask for higher wages).
High Unemployment = Low Inflation.
Essay Logic: Use this to evaluate policy. If the government tries to kill unemployment by spending, they might accidentally trigger a massive spike in prices.
"Is this a Demand problem or a Supply problem?"
If people don't have jobs because the economy is in a slump < Use Fiscal/Monetary Policy to boost AD.
If people don't have jobs because they don't have the right skills < Boosting AD won't help; you need Supply-Side Policies (education/training).
What is Inflation and how is it measured?
A persistent increase in the average price level over time. Usually measured by the Consumer Price Index (CPI), which tracks a "basket of goods" a typical household buys.
Essay Logic: Distinguish between Disinflation (prices rising more slowly) and Deflation (prices actually falling). Deflation is often scarier because it causes people to stop spending, leading to a recession.
What causes Demand-Pull Inflation?
When Aggregate Demand (AD) grows faster than the economy's ability to produce (AS). "Too much money chasing too few goods."
Essay Logic: Use an AD-AS diagram. Show AD shifting right while the economy is near full capacity (the vertical part of the AS curve). This causes prices to jump but GDP to stay roughly the same.
What causes Cost-Push Inflation?
Rising costs of production for firms (e.g., higher oil prices, rising wages, or more expensive imported raw materials).
Essay Logic: Shift the SRAS curve to the left. This is the "worst-case scenario" because it causes Stagflation: higher prices and lower GDP (higher unemployment) at the same time.
What is the Fisher Equation (MV = PY)?
M (Money Supply) x V (Velocity/speed of spending) = P (Price Level) x Y (Real Output/GDP).
Essay Logic: Monetarists argue that V and Y are stable in the long run. Therefore, if the Central Bank increases M too much, the only thing that changes is P (Prices). Conclusion: "Inflation is always and everywhere a monetary phenomenon."
What are the four functions of money?
1. Medium of Exchange: To buy things.
2. Unit of Account: To measure value ($10 is more than $5).
3. Store of Value: To save for the future.
4. Standard of Deferred Payment: To pay back debts later.
Essay Logic: High inflation destroys the Store of Value and Unit of Account functions, making it impossible for firms to plan for the future or for people to save.
Why is high inflation "bad" for an economy?
1. Menu Costs: The cost to firms of constantly changing price tags/catalogs.
2. Shoe-leather Costs: The time/effort people spend moving money to interest-bearing accounts to protect its value.
3. Fiscal Drag: If tax brackets don't move, inflation pushes people into higher tax brackets even if they aren't "richer" (making them poorer in real terms).
4. Uncertainty: Firms stop investing because they don't know what future costs will be.
Why do "Inflationary Expectations" matter?
If workers expect 5% inflation, they demand a 5% pay raise. Firms then raise prices by 5% to cover the wages. This creates a Wage-Price Spiral.
Essay Logic: This is why Central Banks aim for a Target (usually 2%). They want to "anchor" expectations so the spiral never starts.
What is Fiscal Policy?
The use of Government Spending (G) and Taxation (T) to influence the level of Aggregate Demand (AD) in the economy.
Essay Logic: It is managed by the government (e.g., the Treasury), not the Central Bank. It has two main roles: redistributing income and stabilising the economy during booms/busts.
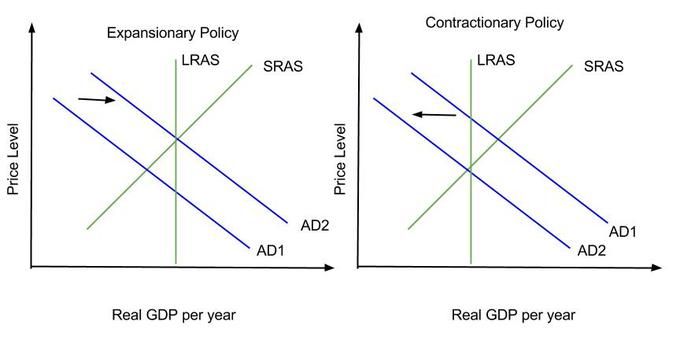
Distinguish between Expansionary and Contractionary Fiscal Policy
Expansionary: Increase G or decrease T. Used during a recession to shift AD to the right.
Contractionary: Decrease G or increase T. Used during a boom to cool down inflation by shifting AD to the left.
Essay Logic: Use an AD-AS diagram to show the shift. Note that expansionary policy usually leads to a Budget Deficit (Spending > Taxes).
What is the difference between Automatic and Discretionary?
Automatic: Features that kick in without new laws (e.g., in a recession, more people claim unemployment benefits (G up) and pay less income tax (T down).
Discretionary: Deliberate new laws (e.g., the government decides to build a new high-speed railway).
Essay Logic: Automatic stabilisers help "smooth out" the business cycle without the government having to act.
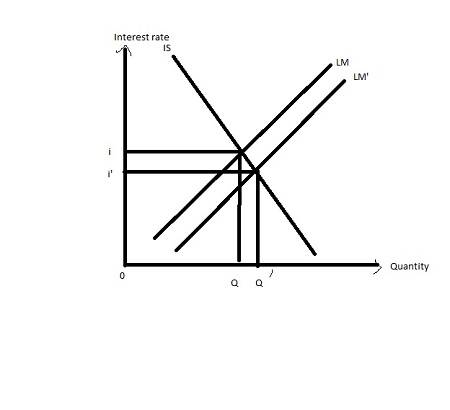
What is the "Crowding Out" argument?
If the government borrows heavily to fund spending, they increase the demand for loanable funds, which pushes up interest rates.
Essay Logic: High interest rates make it more expensive for private firms to borrow and invest. Therefore, the increase in G "crowds out" private Investment (I).
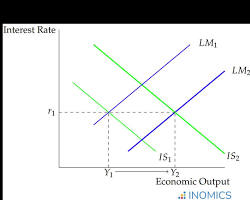
Pro-Tip: Connect this to the IS-LM model—the IS curve shifts right, but the resulting higher interest rate moves us up along the LM curve.
How does the Fiscal Multiplier work?
An initial injection of government spending leads to a bigger final increase in National Income because one person’s spending becomes another person’s income.
Formula: Multiplier = 1/(1 - MPC)
Essay Logic: If the multiplier is large (e.g., 2.0), a small tax cut could have a massive impact on GDP. If people save their money instead of spending it, the multiplier is small and the policy might fail.
Why might Fiscal Policy fail?
Time Lags: It takes time to recognise a recession, pass a law, and actually start a project.
Debt Burden: High spending leads to national debt, which future generations must pay back through higher taxes.
Incentives: High income taxes (Contractionary) might discourage people from working hard.
Essay Logic: This is your "Evaluation" section. You can argue that Monetary Policy is often "faster" and "less political" than Fiscal Policy.
What is the difference between the Central Bank and Commercial Banks?
Central Bank (e.g., The Fed, ECB): The "Banker’s Bank." They control the money supply, set interest rates, and act as a Lender of Last Resort to prevent financial collapses.
Commercial Banks (e.g., HSBC, Chase): Profit-seeking firms that take deposits from households and lend to firms/consumers.
Essay Logic: The Central Bank influences the economy by changing the "price" at which commercial banks borrow money.
What are the three main tools of Monetary Policy?
1. Interest Rates (The Base Rate): The cost of borrowing and the reward for saving.
2. Open Market Operations (OMO): Buying or selling government bonds to change the amount of cash in the banking system.
3. Quantitative Easing (QE): Digitally "printing" money to buy assets and pump liquidity directly into the economy.
Essay Logic: Most Central Banks have a Mandate (a goal) to keep inflation at roughly 2%.
How does an interest rate cut actually increase GDP?
1. Cost of Borrowing falls: Firms invest in new factories; households buy cars/houses on credit.
2. Reward for Saving falls: People spend their cash instead of leaving it in the bank.
3. Asset Prices rise: Lower rates boost stock markets and house prices (making people feel wealthier, so they spend more).
4. Exchange Rate falls: Hot money leaves the country < currency weakens < Exports become cheaper.
Essay Logic: All these factors shift the AD curve to the right.
When does a Central Bank use "Tight" vs. "Easy" money?
Expansionary (Easy): Lower rates / Buy bonds. Used to fight Recession/Deflation.
Contractionary (Tight): Raise rates / Sell bonds. Used to fight Inflation (cooling down the "overheating" economy).
Essay Logic: Link this to the LM Curve in your IS-LM model. Increasing the money supply shifts the LM curve to the right, lowering interest rates and increasing output (Y)
How do banks "create" money?
Banks only keep a small fraction of deposits as cash (reserves) and lend out the rest. When they lend, that money is deposited in another bank and lent again.
The Money Multiplier: Multiplier = 1 / (Reserve Ratio).
Essay Logic: If the Central Bank raises the "Reserve Requirement," banks can lend less, which shrinks the money supply and slows down inflation.
Why might Monetary Policy fail?
1. Liquidity Trap: When interest rates are already near 0%, cutting them further does nothing (people just hold onto the cash).
2. Low Confidence: If businesses are scared of a recession, they won't borrow even if interest rates are 0%.
3. Time Lags: It can take 18–24 months for an interest rate change to fully ripple through the economy.
Essay Logic: This is your "Critique." You can argue that in a deep crash (like 2008 or 2020), Monetary Policy isn't enough—you need Fiscal Policy (Govt spending) to jumpstart demand.
What is the core goal of Supply-Side Policy?
To increase the Productive Capacity of the economy. This means shifting the Long-Run Aggregate Supply (LRAS) curve to the right.
Essay Logic: Unlike demand-side policies, these don't just "fill the gap" in a recession; they try to make the entire "pie" bigger so the economy can grow faster in the long run.
What are the two main "flavors" of Supply-Side policy?
Interventionist: Government takes the lead (e.g., spending on education, infrastructure, or R&D).
Market-Based: Government gets out of the way (e.g., tax cuts, deregulation, reducing trade union power).
Essay Logic: Use this distinction to show balance. A "Right-wing" argument favors market-based; a "Left-wing" argument favors interventionist.
How do you make the workforce more productive?
1. Education/Training: Improves "Human Capital" (skills).
2. Reducing Income Tax: Increases the incentive to work harder/longer.
3. Reducing Unemployment Benefits: Increases the "opportunity cost" of being jobless (encouraging people to find work).
Essay Logic: These policies directly target Structural Unemployment.
How do you make firms more competitive?
1. Privatisation: Selling state-owned companies (like post offices or rails) to private owners to increase efficiency through the profit motive.
2. Deregulation: Cutting "red tape" to make it cheaper/easier for new businesses to start.
3. Trade Liberalisation: Lowering tariffs so domestic firms have to compete with foreign firms (making them "leaner").
Essay Logic: This lowers the Cost of Production, which helps fight Cost-Push Inflation.
Show the impact of Supply-Side policy on an AD-AS diagram.
Shift the LRAS curve to the right.
Result: 1. Real GDP increases (Economic Growth). 2. Price Level decreases (Lower Inflation).
Essay Logic: This is the "Holy Grail" of macro—growing the economy while actually lowering prices.
Why aren't Supply-Side policies used for everything?
1. Time Lags: It takes 15 years for a better primary school system to result in more productive workers.
2. Cost: Interventionist policies (like high-speed rail) are incredibly expensive and can lead to massive Budget Deficits.
3. Inequality: Cutting benefits or top tax rates might help the economy grow, but it often makes the gap between rich and poor much wider.
4. No Guarantee: You can train people, but if there's a global recession, there are still no jobs for them.
What are the two main types of Exchange Rate systems?
Floating: Determined by market Supply and Demand for the currency (e.g., USD, GBP).
Fixed (Pegged): The government or Central Bank ties their currency value to another (e.g., Gold or the US Dollar).
Essay Logic: In a Floating system, if a country exports more, demand for its currency rises, making the currency "stronger."
What happens when a currency gets stronger?
Use the acronym SPICED: Strong Pound, Imports Cheap, Exports Dear (expensive).
Appreciation (Strong): X (Exports) decrease and M (Imports) increase.
Depreciation (Weak): X (Exports) increase and M (Imports) decrease.
Essay Logic: A weak currency is actually a "boost" for domestic manufacturers because their goods look cheaper to foreigners.
What is the Current Account?
A record of a country’s trade in goods and services, plus primary and secondary income.
Surplus: Exports > Imports (Money flowing in).
Deficit: Imports > Exports (Money flowing out).
Essay Logic: A persistent deficit means a country is "living beyond its means" and borrowing from abroad to pay for its consumption.
When does a currency depreciation actually help the trade balance?
Only if the Price Elasticity of Demand (PED) for exports and imports is high enough (specifically, PED_x + PED_m > 1).
Essay Logic: If a country exports something essential (like oil) and the price drops, people won't necessarily buy more, so a weaker currency might not fix a trade deficit
Why does a trade deficit often get worse before it gets better after a currency falls?
1. Short Run: People have already signed contracts to buy imports. Those imports now cost more due to the weak currency.
2. Long Run: People switch to cheaper domestic goods, and the trade balance improves.
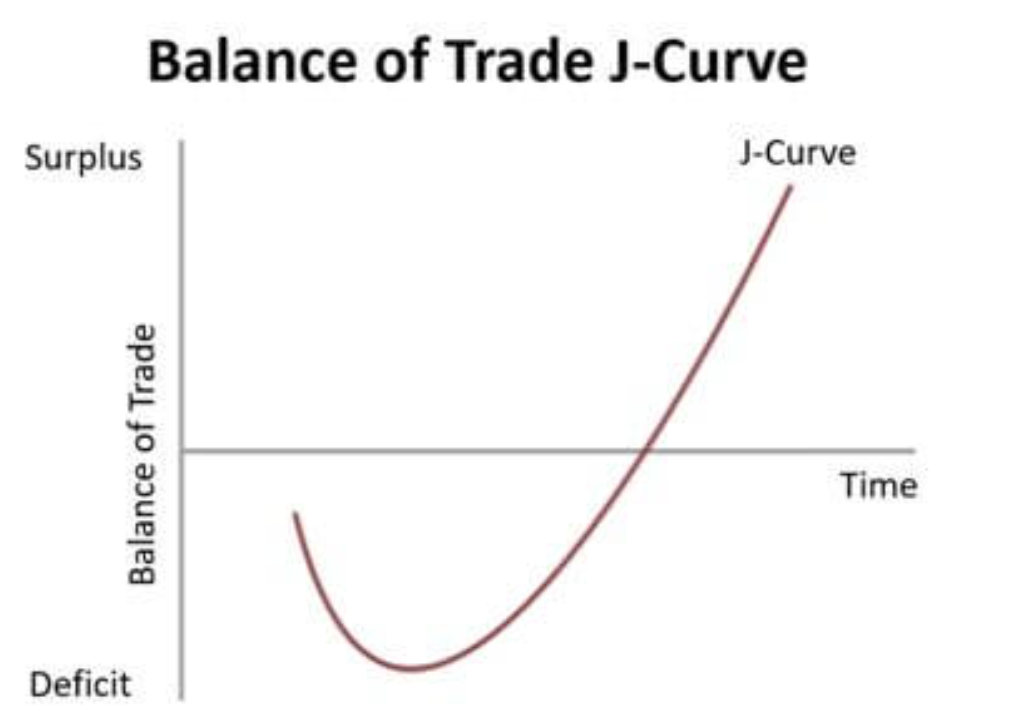
Essay Logic: On a graph, the trade balance dips down (like the letter J) before rising. This shows Time Lags in international trade.
What are the tools of Protectionism?
Tariffs: Taxes on imports.
Quotas: Physical limits on the number of imports.
Subsidies: Giving money to domestic firms to help them compete.
Essay Logic: While Protectionism saves local jobs (Supply-side benefit), it usually leads to higher prices for consumers and Retaliation (trade wars) from other countries.
Define Inflation, Purchasing Power, and the main measurement tool.
Inflation: A sustained increase in the general price level of goods and services over a specific time.
Purchasing Power: Falls during inflation (each currency unit buys less).
Main Tool: The Consumer Price Index (CPI), which Central Banks use to set monetary policy.
Explain the 'Basket of Goods' and how it is Weighted.
The Basket: The government surveys households annually to build a "representative basket" of ~700 common goods/services. It is updated yearly to reflect changing consumer trends.
Weights: Not all items are equally important. Items are weighted based on the proportion of average household income spent on them (e.g., petrol affects a budget more than stamps, so it gets a higher weight).
Explain the Base Year, monthly checks, and the Formula.
Base Year: An arbitrary base year is chosen and given an index value of 100.
Price Checks: Government agents check shop prices monthly. If the weighted basket cost rises by 5%, the new index is 105.
Formula: New Index−Old Index / Old Index × 100 = Inflation Rate.
What are the two alternative measures to CPI?
1. Retail Price Index (RPI): An older measure that includes housing costs (like mortgage interest and council tax), which CPI ignores.
2. Producer Price Index (PPI): Measures inflation at the wholesale/manufacturing level before goods reach the consumer.
Explain the 3 main limitations of CPI and the final conclusion.
1. 'Average' Household: Consumption varies wildly between demographics; the 'average' basket may not reflect your personal inflation rate.
2. Substitution Bias: CPI assumes the basket is fixed. If beef prices rise, people substitute with chicken. Therefore, CPI often overstates true inflation.
3. Quality Changes: Price increases due to technological improvements (e.g., a better smartphone camera) are not pure inflation.
Conclusion: Despite these flaws, CPI remains the most reliable international metric.
Define Fiscal Policy, the required Stance for the UK, and the AD Equation.
Definitions: Fiscal policy is the use of government spending (G) and taxation (T) to influence the economy.
Stance: Because the UK is in a recession (negative growth/high unemployment), it needs Expansionary Fiscal Policy (Increase G, Decrease T).
Goal: To boost Aggregate Demand (AD=C+I+G+(X−M)) and shift the AD curve to the right, closing the recessionary gap.
What is the Impact and what are the Challenges of Infrastructure Spending?
Impact: Direct injection into G. Creates jobs → wages earned → spent in local economy. This creates a Multiplier Effect (initial injection leads to larger final increase in GDP).
Graph/Long-term: Shifts LRAS to the right because better transport increases the UK's long-term productive capacity.
Challenges: Time lags (takes years to plan/build, won't fix a recession today) and heavily increases the UK budget deficit/national debt.
What is the Impact and what are the Challenges of Business Tax Cuts?
Impact: Firms retain more profit → use funds to buy new capital/machinery → increases Investment (I) → shifts AD right.
Challenges: Low "Animal Spirits". Because the UK is in a recession, business confidence is low. Firms may choose to save the extra profit, pay off debts, or pay wealthy shareholders (dividends) rather than risk investing it.
What is the Impact and Challenges of Income Tax Cuts?
Impact: Lowers tax burden → increases household disposable income → boosts Consumption (C, the largest component of UK AD) → shifts AD right.
Challenges (1): Permanent Income Hypothesis – Because the cut is temporary, rational consumers will likely save the extra money, expecting taxes to rise again later.
Challenges (2): High MPM (Marginal Propensity to Import) – UK consumers buy many foreign goods, so the extra income may "leak" out of the economy to buy imports.
Evaluate the Overall Effectiveness of Fiscal Policy and give a Final Verdict.
Pros: Direct injection into the circular flow; can be regionally targeted (e.g., building rail in struggling UK regions).
Cons: Crowding Out Effect – The government must borrow money to fund this, which increases demand for loanable funds, drives up interest rates, and reduces private investment. Also carries an inflation risk.
Conclusion/Verdict: Relying on one measure is risky; a combined approach is best. Tax cuts provide a short-term boost, while infrastructure secures long-term growth. Fiscal policy works best when paired with expansionary Monetary Policy (Central Bank lowering rates).
Define Monetary Policy, the Inflation Target, and the required Policy Stance.
Monetary Policy: Central Bank (e.g., Bank of England) manipulation of interest rates, money supply, and exchange rates.
Goal: Keep inflation (sustained rise in general price level) low and stable at a 2% target.
Stance: To fight high inflation, use Contractionary Monetary Policy to cool down Aggregate Demand (AD=C+I+G+(X−M)).
What is the Transmission Mechanism, Graph, and Challenge of raising interest rates?
Transmission: Central bank raises base rate → borrowing costs rise & saving reward increases → variable-rate mortgages go up → disposable income falls → Consumption (C) and Investment (I) decrease → AD shifts left.
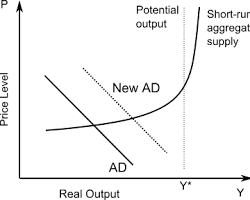
Graph: [AD/AS Diagram] showing AD1 shifting left to AD2. Crucially mention: Price Level drops from PL1 to PL2 (inflation cools).
Challenge: Time lags (takes 18-24 months) and people on fixed-rate mortgages are shielded until their contract expires.
What is the Transmission Mechanism and Challenge of the Exchange Rate Channel?
Transmission: High interest rates attract foreign investors looking for better returns → a phenomenon known as "Hot Money Flows" → demand for domestic currency rises → currency appreciates.
Result: Strong currency = cheaper imports & more expensive exports → Net Exports (X−M) fall → AD shifts left.
Challenge: A strong currency makes domestic exporters globally uncompetitive, risking severe job losses in the export manufacturing sector.
What is the Transmission Mechanism and Challenge of Quantitative Tightening (QT)?
Transmission: Central Bank sells government bonds to commercial banks → this drains cash/liquidity out of the banking system → banks have less cash, so they restrict lending → less credit is available for households/businesses → spending falls, cooling inflation.
Challenge: Selling off massive amounts of bonds drives down bond prices, which can trigger panic and instability in global financial markets.
Evaluate Cost-Push vs. Demand-Pull, Blunt Tools, and give a Final Verdict.
Cost-Push vs. Demand-Pull: Highly effective at curing Demand-Pull (booming economy). Terrible at curing Cost-Push (e.g., energy crisis); raising rates doesn't create more energy, it just crushes incomes, causing Stagflation (high inflation + high unemployment).
Blunt Tool vs. Independence: It is a "blunt tool" that hurts everyone equally (cannot be targeted). However, Central Banks are independent, meaning they can make unpopular decisions without worrying about elections.
Conclusion: It is the crucial first defense against inflation, but due to time lags and inability to fix supply shocks, it must be paired with long-term supply-side policies.
The "Big Picture" Template (AD-AS)
Use this for: Unemployment, Inflation, Fiscal Policy, Monetary Policy, Trade, and Economic Growth.
This graph shows the whole country's price level versus the total amount of stuff produced (GDP).
The Axis:
Vertical (P) = Price Level / Inflation
Horizontal (Y) = National Output / Real GDP
The Lines:
AD (Aggregate Demand): Slopes down. This is total spending (C + I + G + X - M).
SRAS (Short-Run Aggregate Supply): Slopes up. This is business costs (wages, oil).
LRAS (Long-Run Aggregate Supply): A vertical wall. This is the absolute maximum capacity of the country.
Any policy that makes people spend more money (tax cuts, interest rate cuts, govt spending) shifts the AD line to the right.
Any shock that changes business costs (oil prices, wage hikes) shifts the SRAS line.
The "Engine Room" Template (IS-LM)
Use this for: Questions specifically asking about Interest Rates, Banking, or how Fiscal and Monetary policies interact.
This graph shows how the goods market (shopping/building) connects to the money market (banks/loans).
The Axis:
Vertical (I) = Interest Rate
Horizontal (Y) = National Income / GDP
The Lines:
IS (Investment-Savings): Slopes down. Represents the real economy. Lower interest rates = more borrowing = more GDP.
LM (Liquidity-Money): Slopes up. Represents the financial economy. Higher GDP = people need more cash = interest rates go up.
If the Government changes taxing or spending, shift the IS line (IS right = expansionary; IS left = contractionary).
If the Central Bank changes the money supply or interest rates, shift the LM line (LM right = expansionary/more money; LM left = contractionary/less money).
Define Exchange Rate and the two main types of measurements (Bilateral vs. Effective).
Definition: The price of one country’s currency expressed in terms of another (e.g., £1 = $1.25).
Bilateral: The rate between two specific currencies.
Effective: An index measuring a currency against a "basket" of its major trading partners.
Signpost: The determination depends entirely on the system: Floating vs. Fixed.
How is a Freely Floating rate determined, and what does the Graph look like?
Mechanism: Determined entirely by market forces of Supply and Demand on the Forex market.
Demand: Foreigners wanting to buy UK exports or invest in the UK.
Supply: Domestic citizens selling £ to buy foreign imports or invest abroad.
Graph: [S&D Diagram] Y-Axis = Price of £ in $ (Exchange Rate). X-Axis = Quantity of £. Show downward-sloping D and upward-sloping S.
How do Interest Rates, Inflation, and Speculation determine a floating rate?
Interest Rates: UK rates rise → Hot Money Flows into UK banks → Demand for £ shifts right → £ Appreciates.
Inflation: UK inflation rises → exports become uncompetitive → Foreigners buy less → Demand for £ shifts left → £ Depreciates.
Speculation: Traders buy currencies they believe will rise in the future, creating a self-fulfilling prophecy that shifts Demand right immediately.
How is a Fixed Exchange Rate determined and maintained?
Mechanism: The government/Central Bank "pegs" the currency to another (like the US Dollar) at a target rate.
Maintenance: If the currency drops below the peg, the Central Bank uses its Foreign Exchange Reserves to buy up its own currency.
Result: This artificial injection shifts the Demand curve back to the right to maintain the target rate. (They can also drastically raise interest rates to attract Hot Money).
What is the Conclusion?
Conclusion: An exchange rate is simply the external price of money. While fixed systems rely on Central Bank intervention, the vast majority of global trade uses floating rates, constantly determined by interest rates, inflation, and speculative trading.
What is the direct impact of Depreciation on international trade? (Use the acronym).
Depreciation: A fall in the value of a floating currency.
Mechanism (WIDEC): Weak Currency = Imports Dear, Exports Cheap.
Result: UK goods are cheaper for foreigners (X rises), foreign goods are expensive for Brits (M falls).
Impact: Net Exports (X−M) rise → Trade deficit improves → AD shifts right.
Explain the Marshall-Lerner Condition and the J-Curve Effect (with Graph).
Marshall-Lerner: Depreciation only improves the trade balance if the combined elasticity of demand for exports and imports is greater than 1 (PEDx+PEDm>1).
J-Curve: In the short run, trade demand is inelastic (people are stuck in fixed contracts). So, the UK pays more for the same volume of imports.
Graph: [J-Curve Diagram] X-axis = Time, Y-axis = Trade Balance. The line dips down (worsening deficit in the short run) before curving upward (surplus in the long run).
What is the severe negative effect of a depreciation that the government must mitigate?
Imported Cost-Push Inflation.
Mechanism: A weak currency makes importing vital raw materials (like oil, gas, steel) incredibly expensive.
Result: Production costs for UK firms skyrocket. They pass these costs to consumers → SRAS shifts to the left → General price level rises.
How can Contractionary Monetary Policy mitigate this, and what is its fatal flaw?
The Policy: Central Bank raises interest rates.
Mitigation: Attracts Hot Money Flows, which increases demand for the £, stopping the depreciation. It also cools down domestic consumer spending.
The Flaw: Raising rates doesn't make imported oil cheaper; it just crushes domestic incomes. Using a demand-side tool to fight a supply-side shock risks plunging the country into Stagflation (high inflation + high unemployment).
How do Supply-Side Policies mitigate the effects, and what is the final Conclusion?
The Policy: Government invests in green energy infrastructure and R&D.
Mitigation: Green energy reduces the country's reliance on imported oil (insulating them from currency shocks). R&D ensures exports compete on quality rather than just being artificially cheap.
The Flaw: Massive Time Lags (wind farms take 5-10 years to build).
Conclusion: Depreciation is a double-edged sword. While it eventually boosts trade (post J-curve), imported inflation is severe. Short-term interest rates are too risky; long-term supply-side investment is the safest mitigation.