HYPOTHESIS TESTING - Chi-Square Tests
1/12
There's no tags or description
Looks like no tags are added yet.
Name | Mastery | Learn | Test | Matching | Spaced | Call with Kai |
|---|
No analytics yet
Send a link to your students to track their progress
13 Terms
Why are Chi-Square tests used?
Compares frequencies across categories in the data
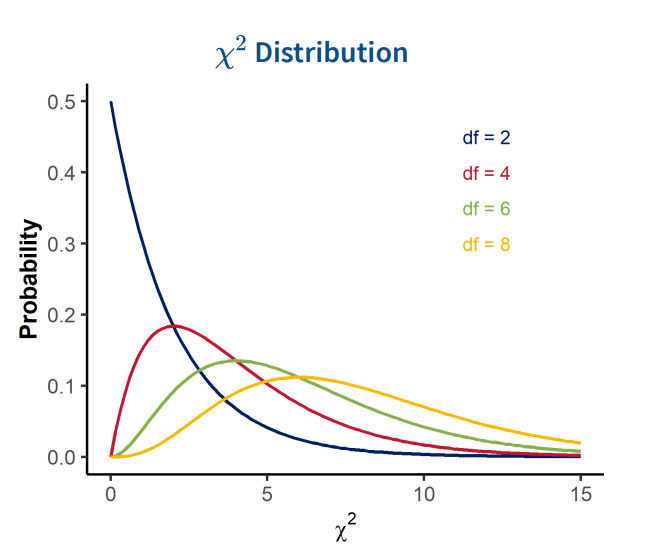
Distribution
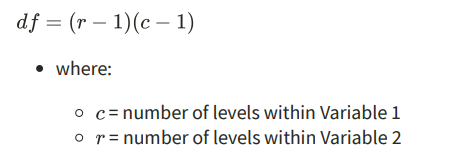
Shape depends on the degrees of freedom
computed using number of groups within the data
As df increases, gets closer to a normal distribution
As number of comparison groups increases, distribution curve flattens
larger x2 values more probable
wider range of x2 values likely
Begins at 0
Data Requirements + Assumptions
Categorical Data
Assumptions
Expected count > 5
Observations independent (only in a single cell)
What are the two kinds of Chi-Squared tests?
Goodness of Fit
Test of Independence
What is a Goodness of Fit test?
Tests whether relative frequencies are consistent with expected ones
Distribution across a single category
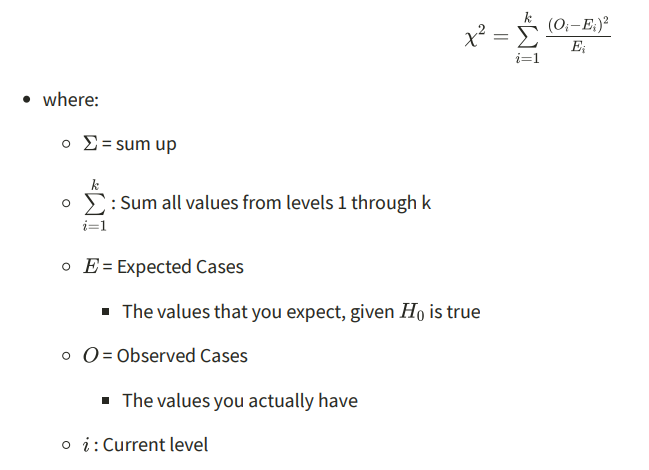
Formula for a Goodness of Fit test
If results are significant
look at Pearsons / standardised residuals
to find out which levels within the category had the biggest difference
Standardised Residual results meanings
Positive
Indicate observed frequency of corresponding level is higher than expected frequency
Negative
Indicate observed frequency of corresponding level is lower than expected frequency
Magnitude Values ≤ -2 = observed frequency much lower than expected
Magnitude Values ≥ 2 = observed frequency much higher than expected
What is a Test of Independence
Checks whether 2 categorical variables from a single population are independent of each other
Specifically whether there is any dependence
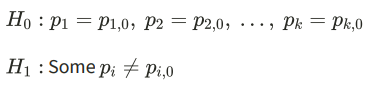
H0 = A + B are independent
H1 = There is an association between A + B
i + j = specific cells
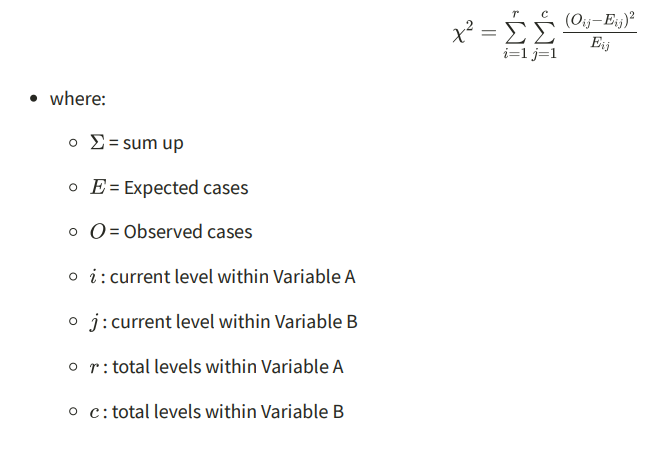
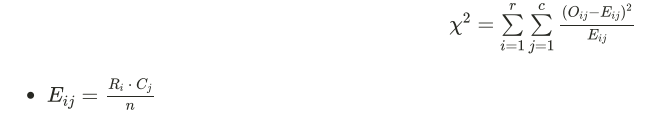
t-statistic for a Test of Independence
Column total - row total divided by total number of observations
Find t-statistic on the distribution for a Test of Independence
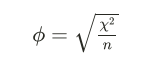
Phi Coefficient
Magnitude notations
small effect = 0.1
medium effect = 0.3
large effect = 0.5
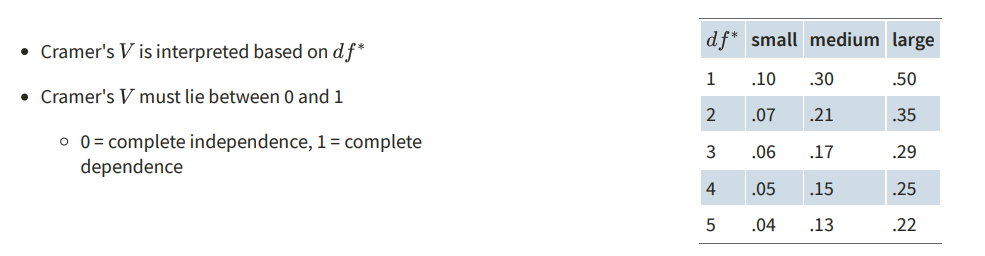
Cramer’s V
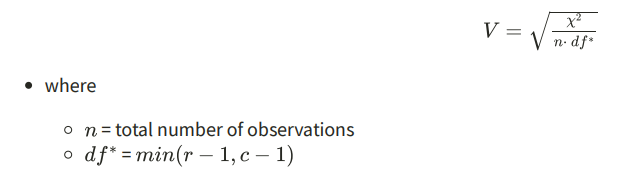
Cramer’s V Interpretation