Midterm 2 Macroeconomics 1020
1/81
Earn XP
Description and Tags
Chapter 8, 9, 10, 11, 12 (till slide 13). Still look at slides!
Name | Mastery | Learn | Test | Matching | Spaced | Call with Kai |
|---|
No analytics yet
Send a link to your students to track their progress
82 Terms
Unemployment rate
The percentage of the total number of people in the labour force who are unemployed
It is calculated as unemployment/(unemployment + employment)
Employment rate
The employment rate is the percentage of the working-age population (typically aged 15 and older) that is currently employed. It measures the extent to which available labor resources are used.
It is calculated as: number of employed individuals/(total working age population)x100
Labour force
The sum of employment and unemployment; that is, the number of people who are currently working plus the number of people who are currently looking for work.
Labour force participation rate
The percentage of the population aged 15 or older that is in the labour force
It is calculated as: (employed+unemployed)/(total working age of population)x100
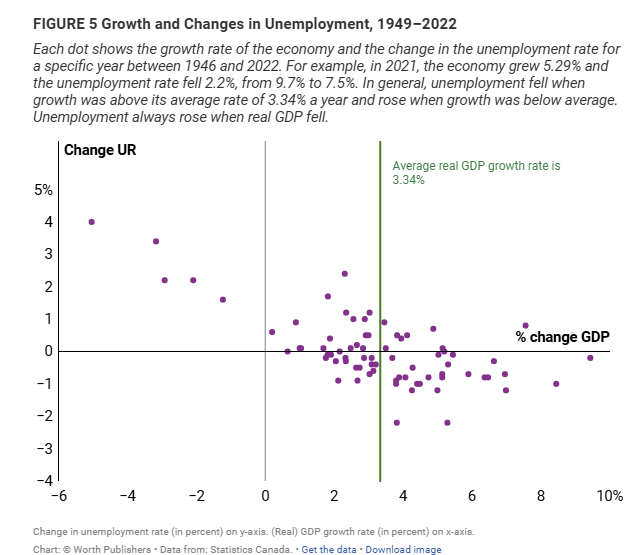
What is the relationship between the unemployment rate and economic growth?
Inverse relationship
Faster economic growth (GDP) leads to lower unemployment, and slow growth or recession increases it
What is natural rate of unemployment? What factors affect this?
The normal unemployment rate around which the actual unemployment rate fluctuates; the unemployment rate that arises from the effects of frictional and structural unemployment
Some affects are caused by structural and frictional factors, including labor market institutions, government policies, and workforce demographics
What is frictional unemployment? What factors affect this?
Unemployment due to time workers spend in job search
Exists even when job vacancies are equal to the number of people seeking jobs
Some affects are caused by voluntary job quits for better opportunities, new labor market entrants (graduates), geographical relocation, information gaps, and seasonal layoffs.
What is structural unemployment? What factors affect this?
Unemployment that results when there are more people seeking jobs in a particular labour market than there are jobs available at the current wage rate, even when the economy is at the peak of the business cycle
A variety of factors — minimum wages, labour unions, efficiency wages, the side effects of government policies such as unemployment benefits, and mismatches between employees and employers lead to structural unemployment by raising wages above their market equilibrium level.
What is cyclical unemployment? What factors affect this?
The difference between the actual rate of unemployment and the natural rate of unemployment due to downturns in the business cycle
Caused by ups and downs in the business cycle, “sticky” wages, economic recessions
What is long-term unemployment? What factors affect this?
Long-term unemployment is defined as being jobless and actively seeking work for 6 to 12 months or more
Affected by economic conditions, structural changes, demographic factors
What are the economic costs of inflation(3)? What does it cause?
Shoe-leather costs, menu cost, unit-of-account costs
It causes wealth redistribution, hurts fixed-income earners, and creates uncertainty that reduces long-term investment, with high inflation potentially leading to severe recessions
Shoe-leather costs
(Of inflation) the increased costs of transactions caused by inflation
Menu cost
The real cost of changing a listed price
Unit-of-account costs
(Of inflation) costs arising from the way inflation makes money a less reliable unit of measurement.
How do unexpected inflation or deflation create winners and losers?
Unexpected inflation means a higher‑than‑expected inflation rate is bad for lenders and good for borrowers, making borrowers the winners and lenders the losers
Unexpected deflation means a lower‑than‑expected inflation rate is good for lenders and bad for borrowers, making lenders the winners and borrowers the losers
How do unexpected inflation or deflation change real vs. nominal wages and real vs. nominal interest rates?
Unexpected inflation or deflation changes real vs. nominal wages and real vs. nominal interest rates because when the inflation rate turns out higher or lower than expected, the real value of wages and interest payments rises or falls even though the nominal amounts stay the same.
Real wage (formula)
The wage rate divided by the price level
Nominal wage
The literal amount of money paid per hour, week, or year
Real interest rate (formula)
The nominal interest rate minus the inflation rate
Nominal interest rate
The interest rate in dollar terms
What is the relationship between unemployment rate and inflation?
lower unemployment (tight labor markets) drives up wages and inflation, while high unemployment reduces demand and inflation
What is growth in Real GDP per capita?
Economic growth (real GDP per capita) is the inflation-adjusted increase in output per person over time, indicating a rising standard of living.
What is the rule of 70? And (formula)
A mathematical formula that states that the time it takes real GDP per capita, or any other variable that grows gradually over time
To double is approximately 70 divided by that variable’s annual growth rate
What is labour productivity?
• Output per worker.
What are the sources of long run growth (3)?
Physical capital
Human capital
Technological progress
What is physical capital?
Human-made resources such as buildings and machines
Human capital
The improvement in labour created by the education and knowledge embodied in the workforce
Technological progress
An advance in the technical means of the production of goods and services
What does the aggregate production function show? And (formula). And variable meanings.
The aggregate production function shows how inputs (labour, capital) and technology combine to produce total output.
Y=A×F(K, L, H)
•A = Total factor productivity (TFP)
•K = Physical capital
•L = Labour
•H = human capital
•Y = output (real GDP)
•MPK = Marginal productivity of physical capital
•MPL= Marginal productivity of labour
•MPH = Marginal productivity of human capital
What does the per worker production function show? And (formula). And variable meanings.
The per worker production function shows how productivity depends on physical capital per worker and human capital per worker
Y/L=A×f((K/L),(H/L))
•A = Total factor productivity (TFP)
•K = Physical capital
•L = Labour
•H = human capital
•Y = output (real GDP)
•MPK = Marginal productivity of physical capital
•MPL= Marginal productivity of labour
•MPH = Marginal productivity of human capital
What is diminishing marginal productivity?
Diminishing marginal productivity means that, holding everything else constant, each additional increase in K/L (capital per worker) leads to a smaller increase in output per worker.
Easy to remember- As workers get more and more capital (machines), each extra machine adds less and less extra output per worker.
What is total factor productivity?
The parameter A in the aggregate or per-worker production function, it accounts for output that is not a result of the productive inputs
It measures the amount of output that can be produced with a given amount of factor inputs
Why do growth rates differ across countries (3)?
Savings and investments- Rapidly add to their physical capital through high savings and investment spending
Education- Increase their human capital by improving their educational institutions
Research and development- Make fast technological progress through research and development.
What are the role of government in economic growth (6)?
Government subsidies to infrastructure (physical capital such as roads)
Government subsidies to education
Government subsidies to R&D (financial support like grants)
Maintaining a well functioning financial system
Protection of property rights
Political stability and good governance
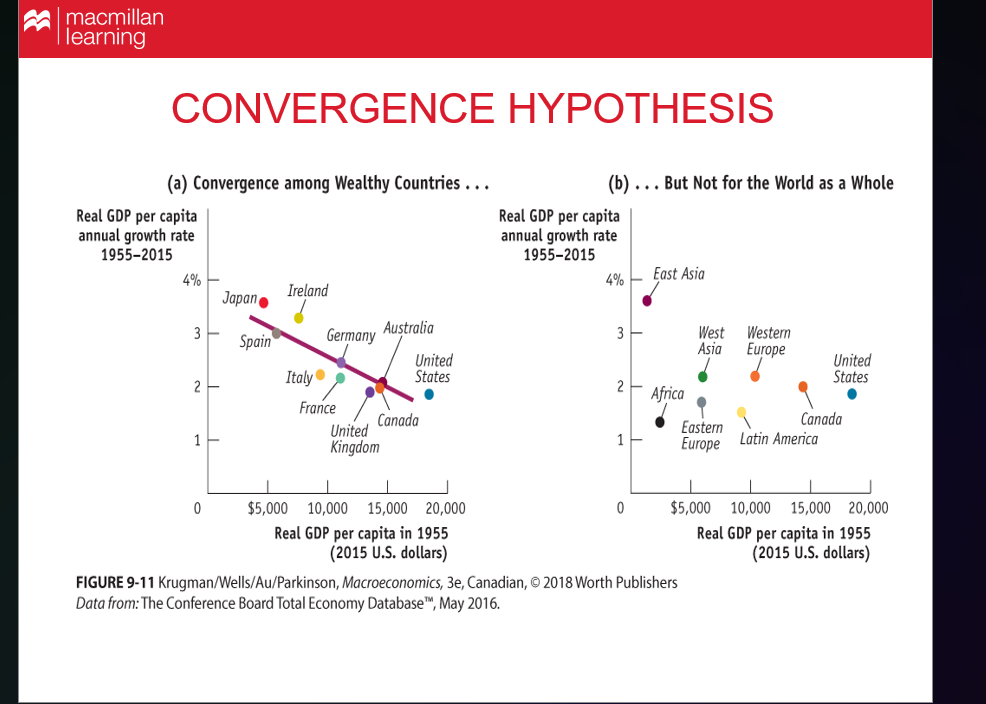
What is the convergence hypothesis?
The convergence hypothesis (or "catch-up effect") posits that poorer economies tend to grow faster than richer ones, eventually leading to similar levels of per capita income and productivity
Panel (a) shows that among wealthy countries, poorer ones in 1955 grew faster, so they converged toward the richer ones.
Panel (b) shows that for the world overall, poorer regions did not consistently grow faster, so no global convergence appears.
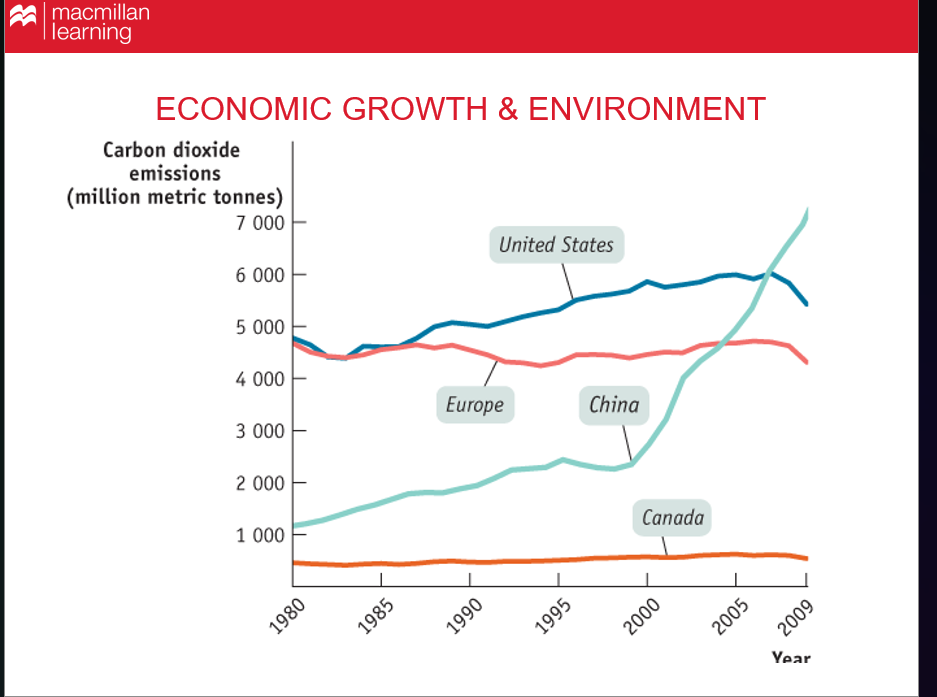
Explain what this graph is showing
Economic growth and the environment have a negative relationship.
China’s rapid growth is increasing carbon dioxide emissions
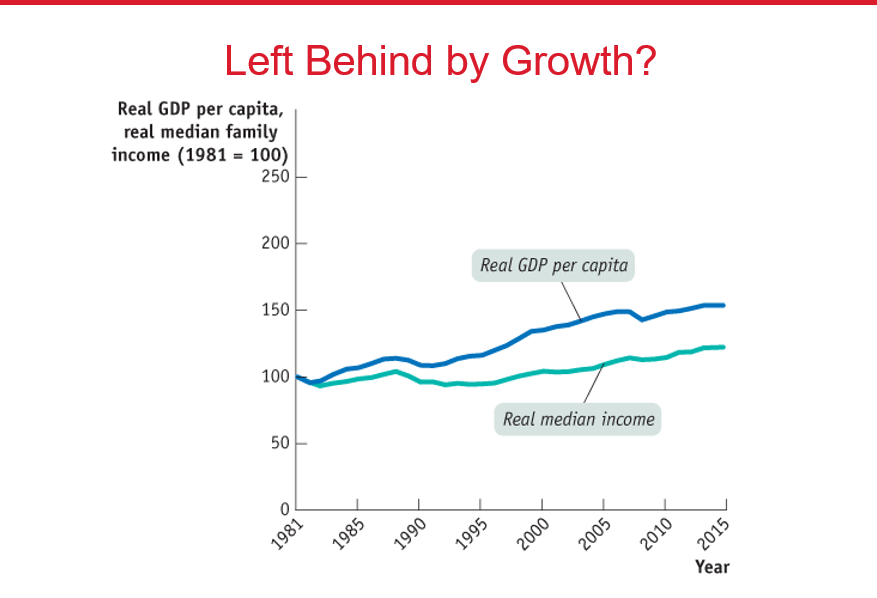
Explain what this graph is showing
Who is actually benefiting from economic growth? —-
When real GDP goes up, real income is always going up but that is not always the case for some nations.
Majority were benefiting.
Unequally distributed.
Shows us consequence in rise in inequality.
Green line is exactly the middle income. Both shown as indexes.
They have the same base year and they are growing similarly. Income of median family rose much more slowly the GDP per capita did.
What is sustainable long-run economic growth?
Long-run growth that can continue in the face of the limited supply of natural resources and the impact of growth on the environment
Savings and investment spending spending identity in a closed economy. And (formulas). And variable meaning
There are no exports or imports
Total income.
GDP = C + G + S.
Total spending.
GDP = C + G + I.
Total income = total spending.
Putting these equations together, we get: C+G+S=C+G+I -> S=I
I=National savings
G= Government spending
S= Savings
C= Consumer spendings
I= Investment spender
•Public (Government) savings
SPublic = T − TR − G
•National Savings:
SNational = SPublic + SPrivate
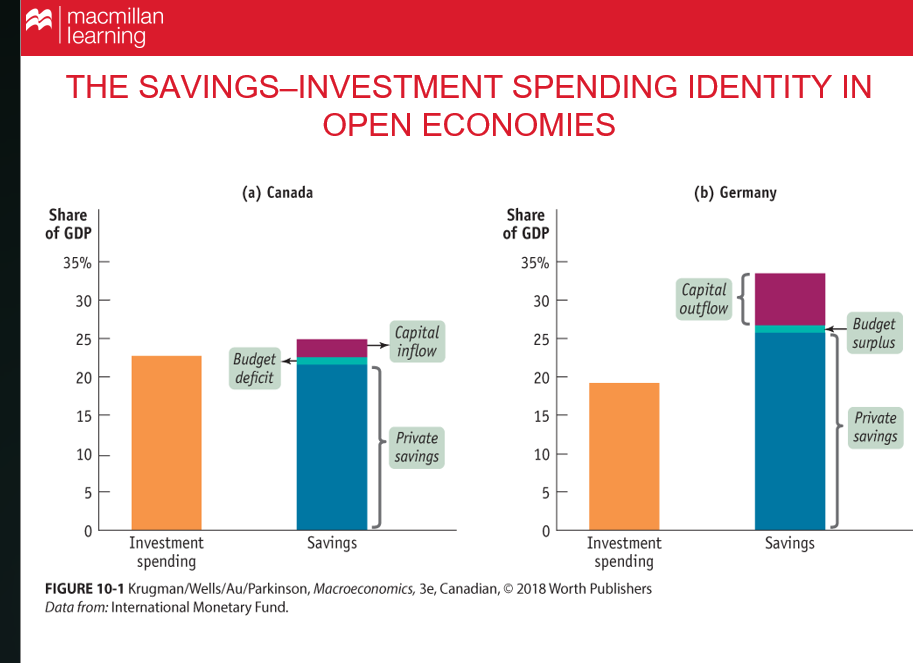
Savings and investment spending identity in an open economy. And (formulas)
In an open or international economy, goods and money can flow into and out of the country
Any given country can receive inflows of funds — foreign savings that finance investment spending in that country. Any given country can also generate outflows of funds — domestic savings that finance investment spending in another country.
• Net foreign investment (or NFI) =
total outflow of funds - the total inflow of funds
NFI = X – IM
•If NFI < 0 :
•Recall GDP = C + I + G + X − IM , or
• GDP − C − G = national savings,
IM= Imports
GDP-C-G= I=(x-IM)
National savings= I+NFI
*Make sure you understand where these different components are coming from
Under the Savings–Investment Spending Identity, what do budget surplus, budget deficit, budget balance, and national savings mean?
Budget surplus — when tax revenue is greater than government spending.
Budget deficit — when government spending is greater than tax revenue.
Budget balance — the difference between tax revenue and government spending (surplus if positive, deficit if negative).
National savings — the sum of private savings and government savings (the budget surplus; if the government runs a deficit, it reduces national savings).
What is the loanable funds market?
A hypothetical market that brings together those who want to lend money (savers) and those who want to borrow (firms with investment spending projects)
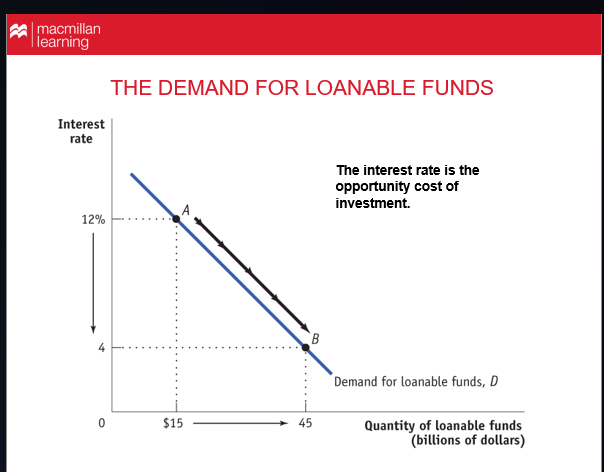
Explain what this graph is showing
When interest rates are higher, there will be less investment rates (too risky, may not be able to pay back loans)
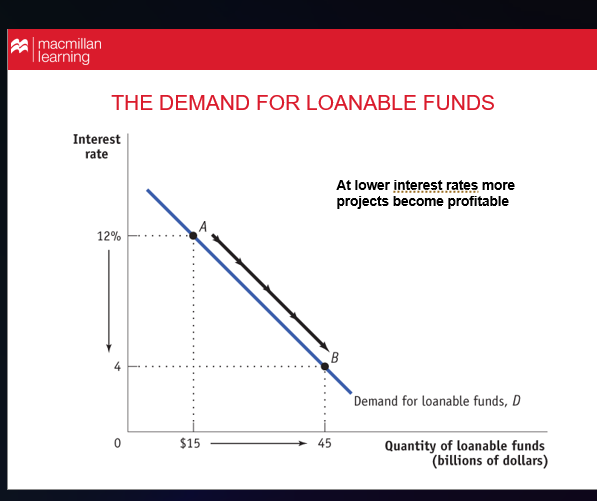
Explain what the graph is showing
It shows whether the government is saving or dissaving: a budget surplus means saving, a budget deficit means dissaving, the budget balance is the gap between taxes and spending, and national savings equals private savings plus government savings
More projects became more profitable
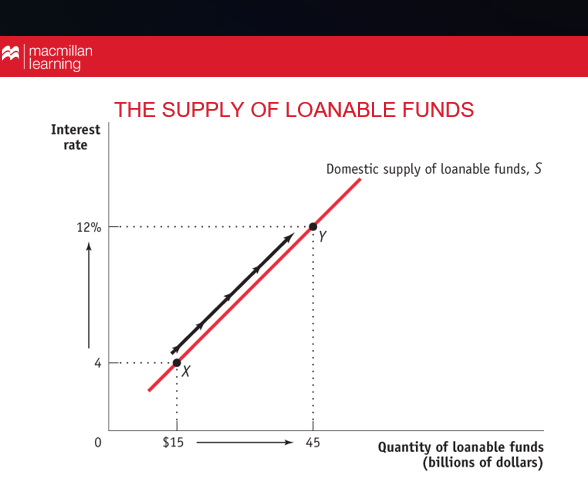
Explain what the graph is showing
The graph shows that the supply of loanable funds slopes upward: higher interest rates lead to a larger quantity of savings supplied
Why does the supply of loanable funds curve slope upward?
More people are willing to lend money when the interest rate is higher, because a higher rate gives a bigger return on their savings
What happens at the equilibrium interest rate in the loanable‑funds market?”
desired savings = desired investment
right projects are funded means the projects with the return at least as high as the interest rate
Right people do savings those who would (look at book)
What are some factors which can cause the demand curve for loanable funds to shift?
Changes in perceived business opportunities
Changes in government policies
What are some factors which can cause the supply curve of loanable funds to shift?
Changes in private savings behavior
Changes in government budget balance
When does crowding out occur?
Crowding out occurs when a government budget deficit drives up the interest rate and leads to reduced investment spendings
What is a global loanable funds market?
A situation in which international capital flows are so large that they equalize interest rates across countries.
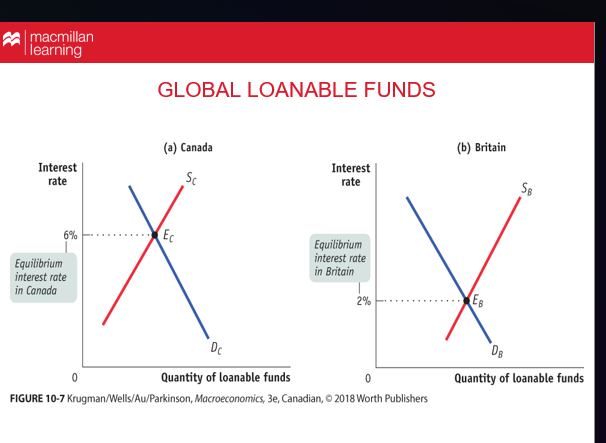
Explain what this graph is showing
It shows that different countries have different equilibrium interest rates because their supply and demand for loanable funds intersect at different points.
Canada’s curves intersect at a higher rate (6%), while Britain’s intersect at a lower rate (2%), reflecting differences in saving and borrowing conditions.
What are some factors that change interest rate?
Shifts in supply or demand of loanable funds
Changes in government policy
Technological innovations that created new investment opportunities
Changing expectations about future inflation, which shift both the supply and the demand for loanable funds.
What is the Fisher effect?
The principle by which an increase in expected future inflation drives up the nominal interest rate, leaving the expected real interest rate unchanged
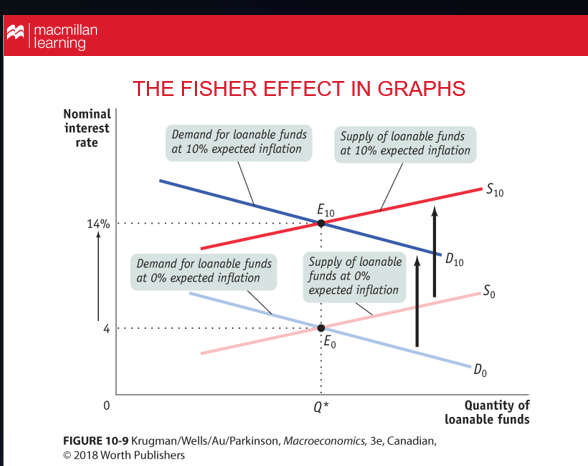
Explain what this graph is showing
The graph shows the Fisher Effect: when expected inflation rises, the nominal interest rate rises by the same amount, even though the real interest rate stays the same.
Higher expected inflation shifts both the supply and demand curves for loanable funds upward.
This raises the nominal interest rate from 4% to 14% when expected inflation increases from 0% to 10%.
The quantity of loanable funds stays the same (Q*), meaning only the nominal rate changes.
This illustrates the Fisher Effect:
Nominal interest rate = real interest rate + expected inflation.
What is the multiplier effect? And (formulas)
An economic concept where an initial injection of spending—such as government investment, exports, or consumer spending—leads to a proportionally larger increase in final national income (GDP)
Example: Tourism Spending: A tourist spends at a local hotel. The hotel owner uses that money to pay for electricity and staff, who then spend that money on food or clothing. The initial circulates through the community, creating income for several businesses, rather than just the hotel
•ΔAE0 = autonomous change in aggregate spending
•ΔY = change in real GDP
What is MPC?
The increase in consumer spending when disposable income rises by $1. Because consumers normally spend part but not all of an additional dollar of disposable income, MPC is between 0 and 1
Example: Tax Cut/Refund: If a household receives a $1000.00 tax refund and spends $650.00 on goods, the MPC is 0.65
Marginal propensity to consume
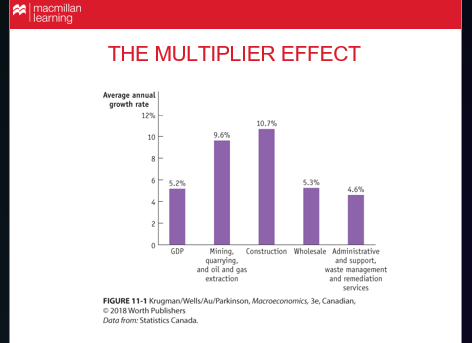
Explain what this graph is showing
The graph shows that some industries grow much faster than overall GDP, which is the core idea of the multiplier effect.
What the graph is showing
Construction and Mining/Oil & Gas have very high growth rates (around 10%+), far above GDP’s 5.2%.
Wholesale and Administrative/support services grow more slowly, closer to or below GDP.
When a sector like construction or mining expands quickly, it boosts many related industries, causing total GDP to rise by more than the initial increase—that’s the multiplier effect.
What is MPS?
The fraction of an additional dollar of disposable income that is saved; MPS is equal to 1 − MPC
Marginal propensity to save
Example: . For example, if a person earns an extra $1000.00 and saves $200.00, the MPS=0.02 ($200/$1000). It is crucial for determining the Keynesian multiplier, with higher savings (higher MPS) reducing the multiplier effect
What is the individual consumption function? And (formula)
An equation showing how an individual household’s consumer spending varies with the household’s current disposable income
c = a + MPC × yd
c = a household’s consumer spending
yd = household disposable income
MPC = marginal propensity to consume
a = autonomous consumption (spending even with zero income)
What is the aggregate consumption function? And (formula)
Models the relationship between total household consumption and aggregate disposable income ()
C = A + MPC × YD
C: total consumer spending in the economy
A: aggregate autonomous consumption (spending even with zero income)
MPC: marginal propensity to consume for the whole economy
YD: aggregate disposable income
What is the consumption function? And (formula)
A consumption function describes how consumer spending changes as disposable income changes, linking income to spending behavior in a predictable way
C=a+MPC x Yd
where a is autonomous consumption, MPC is the marginal propensity to consume, and Yd is disposable income.
What causes shifts in the consumption function?
• Changes in expected future disposable income
• Changes in aggregate wealth
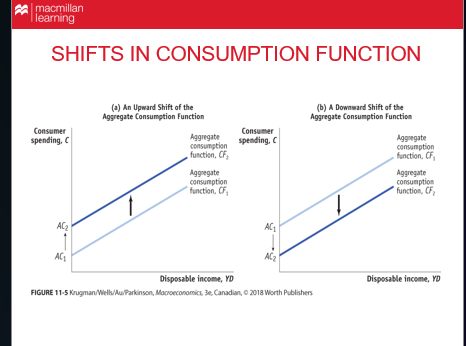
Explain what this graph is showing
A shift in the consumption function means households change how much they spend at every income level—upward if they plan to spend more, downward if they plan to spend less
What is the income expenditure model?
The model shows that an economy's total output and income are determined by the total amount of spending by households, businesses, and governments
The level of real GDP at which real GDP equals planned aggregate spending
What are some assumptions of the income expenditure model?
Changes in overall spending lead to changes in aggregate output (prices are fixed).
The interest rate is fixed.
No Government (no G or T)
No international trade
What do changes in inventories signal in the income–expenditure model?
Economists track changes in firms’ inventories to understand economic conditions
A decrease in inventories indicates that demand is rising, which is typically a sign of future economic expansion
When inventories fall, firms often respond by increasing production
What is the income-expenditure equilibrium?
A situation in which aggregate output, measured by real GDP, is equal to planned aggregate spending and firms have no incentive to change output
What do positive and negative unplanned inventory changes indicate?
Positive unplanned inventory change — Firms produced too much; goods accumulated in inventory
Negative unplanned inventory change — Firms produced too little; inventories fell because demand exceeded production
When does planned aggregate spending differ from real GDP in the income–expenditure model?
Planned aggregate spending differs from real GDP when unplanned inventory changes are not zero
These unplanned changes signal that firms either produced more or less than what consumers purchased
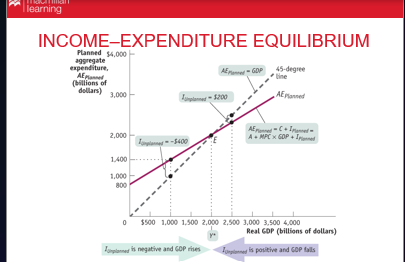
Explain what this graph is showing
This graph is showing how the economy moves toward income–expenditure equilibrium by comparing planned spending to actual GDP and using unplanned inventory changes as the adjustment signal
How do exports affect spending in the economy?
Exports act like an increase in autonomous spending because they add demand coming from outside the domestic economy. This boosts overall expenditure and raises equilibrium GDP
Why is the multiplier smaller in an open economy?
The multiplier is weaker because imports are a leakage
When consumer spending rises, part of that increase is spent on imported goods
This reduces the portion of spending that circulates within the domestic economy
The size of this leakage depends on the marginal propensity to import
What is economic interdependence?
Economic interdependence is the idea that countries’ economies are linked, so recessions and recoveries often occur at the same time.
Because nations trade with and rely on each other, economic conditions in one country affect others
What does the aggregate demand curve describe?
• Aggregate demand curve describes the relationship between the aggregate price level and the quantity of aggregate output
• Output demanded by households, government, basically everything
Why does the aggregate demand curve slope downwards?
Wealth effect, you have initially the aggregate price increasing then you get purchasing power of wealth goes down which leads you to lower consumption
Why does a rise in the aggregate price level reduce C, I, and X − IM?
The int rate effect, starts with higher aggregate price level, then house holds hold more money as they are not consuming as much which leads to interest rates increasing, then I and C are lower in result
Is the aggregate demand curve at a fixed price?
No
The AD curve is the application of the income expenditure model at different prices
If the price level drops, planned spending falls or rises at all output levels?
Rises
What are some reasons for the aggregate demand curve to shift?
•Expectations
•Wealth
•Government policies
•Size of existing stock of physical capital
Does a change in wealth move us along the AD curve (wealth effect) or shift it?
It depends
Along AD curve: wealth changes because price changes
A shift of AD is wealth changing because of anything other then price (other factors in the economy)