q sci 381 exam
1/38
There's no tags or description
Looks like no tags are added yet.
Name | Mastery | Learn | Test | Matching | Spaced | Call with Kai |
|---|
No analytics yet
Send a link to your students to track their progress
39 Terms
statistics
connecting numerical data to understand probabilites
descriptive statistics
organizing, summarizing, and displaying data
inferential statistics
drawing conclusions about a population from data
data
observations, counts, measurements, or responses
population
number defined by the scale
parameter
the rate of the population
sample
number that is a part of a population
representative sample
sample with characteristics of the population
variable
characteristics of population such as categories
nominal measurement
qualitative measurement with categorical methods
ordinal measurment
qualitative or quantitive measurement with category and a meaningful order to them
interval measurment
quantitive measurement with category, order, and meaningful differences
ratio measurement
quantitive measurement with all the aspects as well as true 0 starting point.
simple random sampling
selecting at random
stratified random sampling
placed into different characteristic groups, people are picked from these groups
cluster random sampling
population naturally in subgroups with simular characteristcs but not put into groups answering the research question
systematic sampling
random start point then selecting every 1/x thing after
multistage sampling
when people are randomly selected from each roup
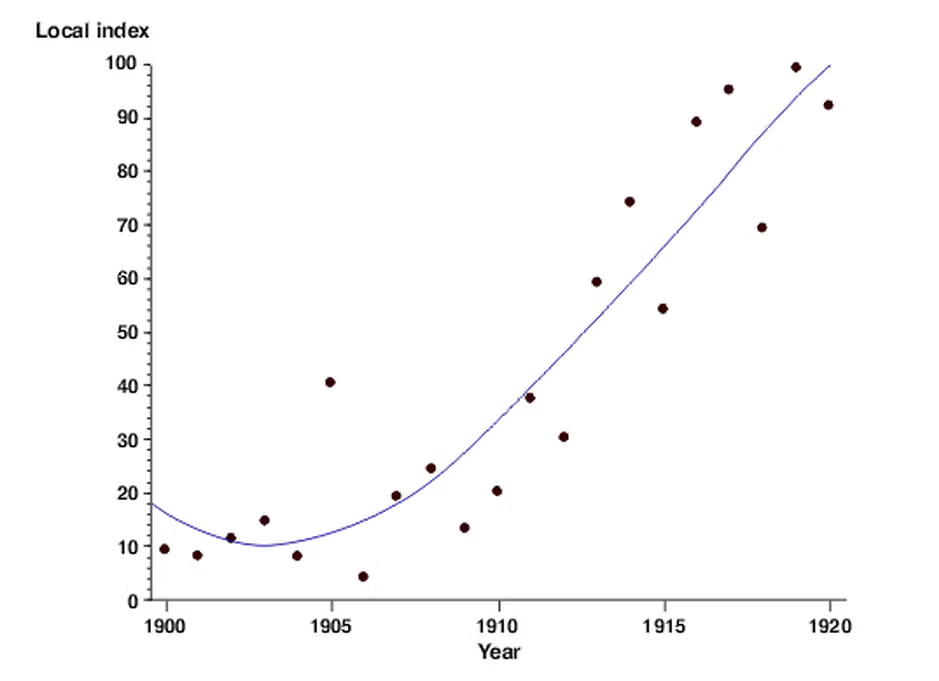
scatterplot graph
case by case x and y axis
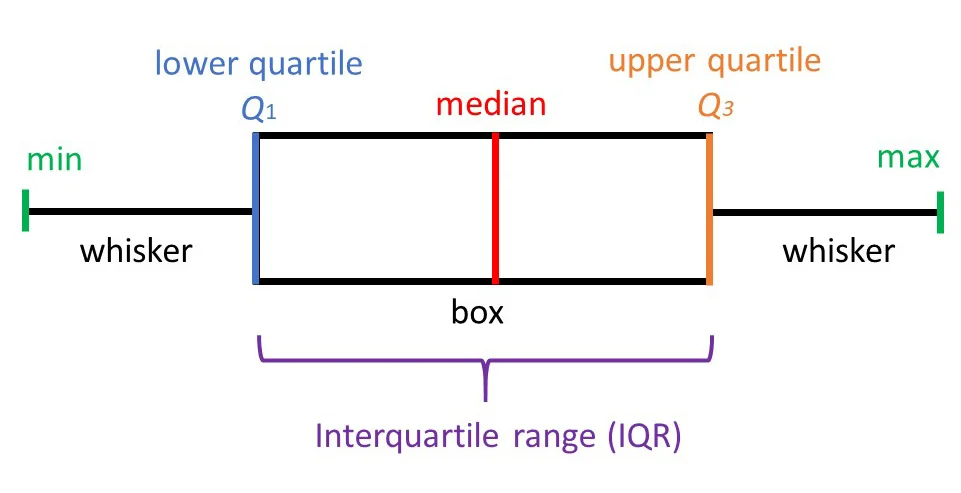
boxplot graphs
z-score
number of standard deviations that falls above or below the mean, to see if how far an observation is from the mean using standard deviation.
A positive score means the value is above average, a negative score is below average, and 0 is the average
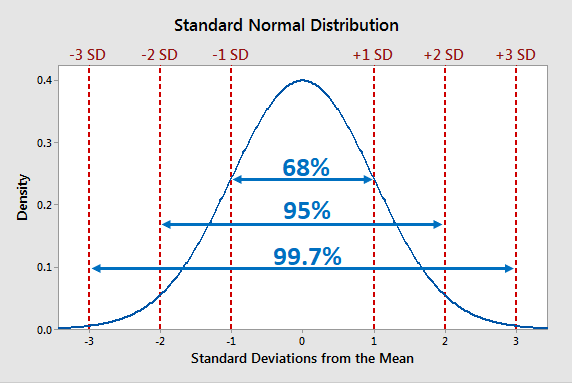
empirical rule
68% of the data in 1 SD of the mean
95% of the data in 2 SD of the mean
99.7 of the data in 3 SD of the mean
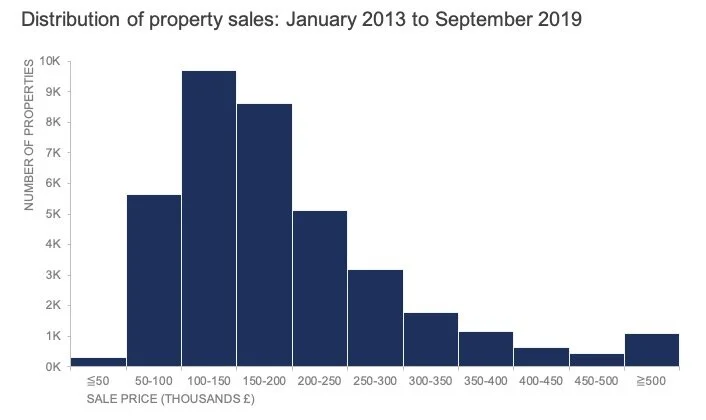
histogram
shows frequency
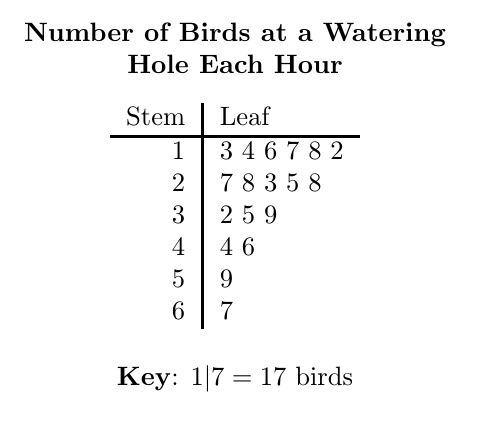
stem and leaf plot
permutation
when the order of arragnements of objects matters
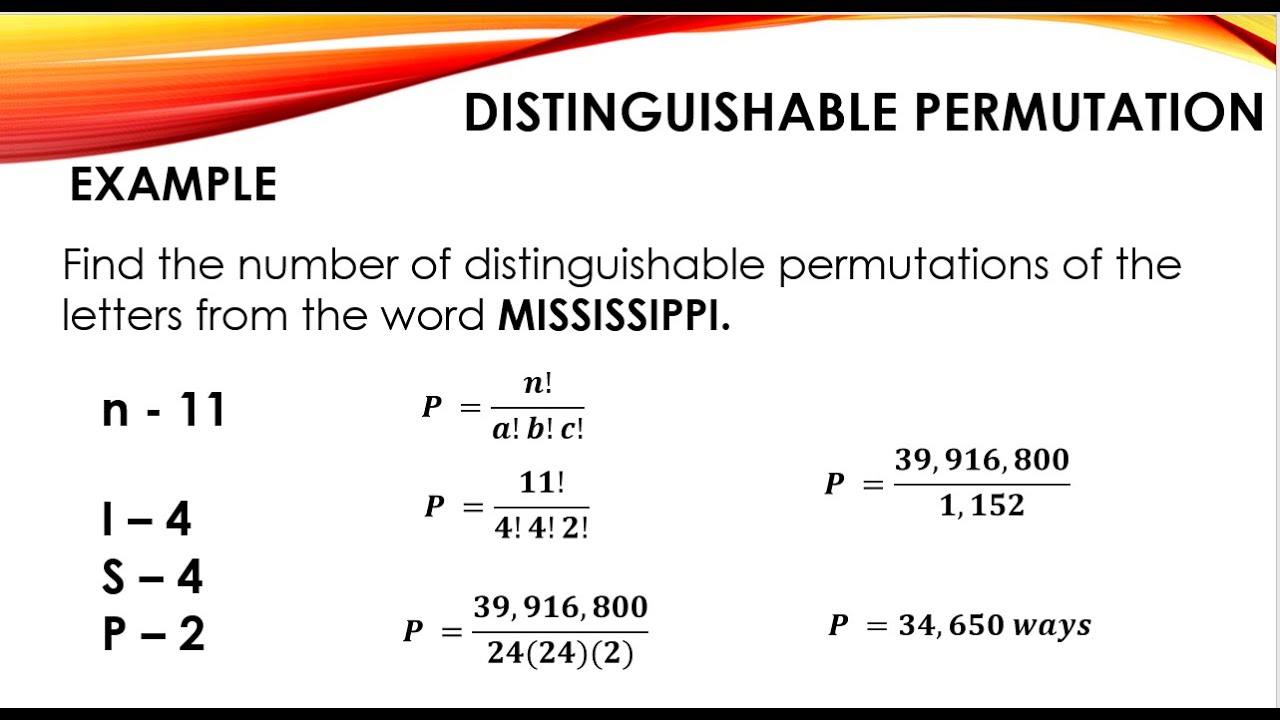
distinguishable permutations
ordered arrangements matter but there are different things
comination permentution
when the order does matter so n choose r
random variable
numerical value from random process
empirical distribution
based on observed data
theoretical distribution
based on mathematical formula
binomial distribution
probability of getting success after a certain number of trials BUT trials are independent, the probability of success is consistent, trial outcome is win or loss, and the number of trials is fixed
geometric distribution
probability of first win on trial x BUT trial must be independent, repeated until won, the probability the same, and the x is independent trials until first win
poisson distribution
probability of x events happening in fixed time or space BUT count the events inan interval, the average rate of the event is constant, and the event outcome is independent of others
normal distribution
a symmetric, unimodal, bell shaped cuve
mutually exclusive
when two or more events can’t happen at the same time
standard deviation
A low SD indicates data points are clustered closely around the mean (high consistency), while a high SD indicates the data is spread over a wider range (higher variability)
coefficient of variation
A CV of 10% means the standard deviation is 10% of the mean.
Normal distribution
It is always symmetric and bell-shaped
The mean, median and mode are all equal, and have value μ
The distribution is defined across all numeric values from –infinity to infinity, and approaches 0, but never reaches 0, as x gets further from the mean
The area under the curve from –infinity to infinity is equal to one to satisfy that the summed probability across all outcomes equals one
the mean is 0 and the standard deviation is 1
z-score interpretation
how far an observation was from the mean in units of standard deviation
ex. An observation with a z-score of 2 is always going to be 2 standard deviations above the mean