Phillips Curve
1/31
Earn XP
Description and Tags
lecture 14- economics 202
Name | Mastery | Learn | Test | Matching | Spaced | Call with Kai |
|---|
No analytics yet
Send a link to your students to track their progress
32 Terms
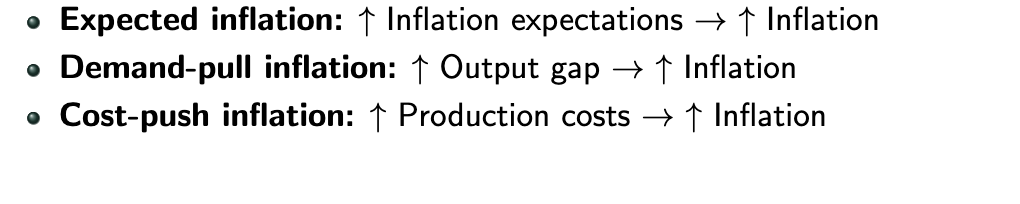
three inflationary forces- causes of inflation
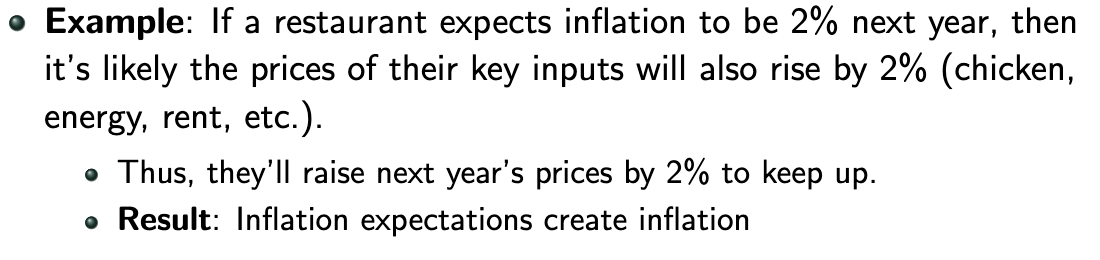
inflation expectations
demand-pull inflation (Phillips curve)
supply shocks and cost-push inflation
inflation expectations
the rate at which average prices are anticipated to rise next year
demand-pull inflation
inflation resulting from excess demand
when demand outstrips a business’ productive capacity= raise prices
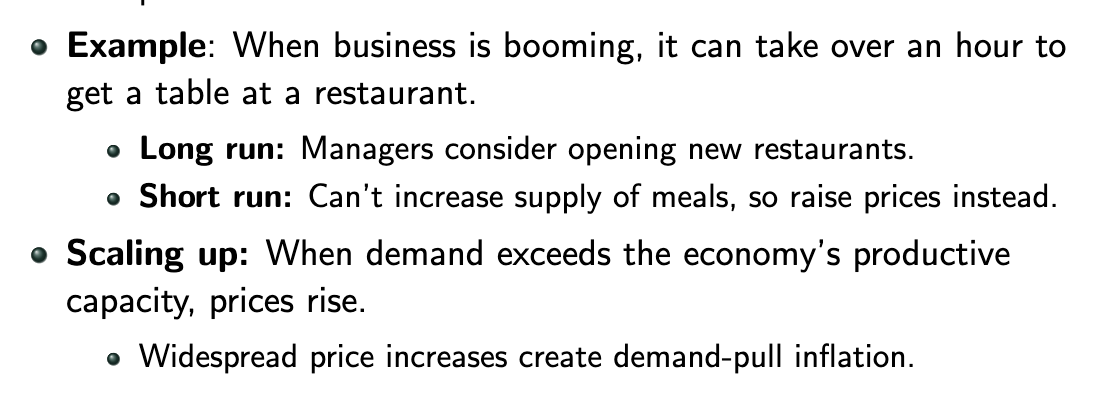
scaling up
when demand exceeds the economy’s productive capacity- prices rise
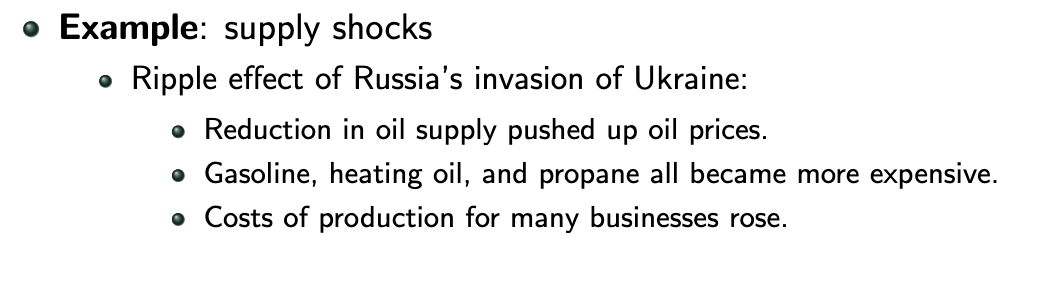
cost push inflation
inflation the results from an unexpected rise in production costs
when an unxpected boost to production costs pushes sellers to raise their prices
all pieces together
inflation = expected inflation + demand pull inflation +cost push inflation
set prices to take account of inflation expectations
two factors:
your marginal cost
if supplier raises prices, then you have to charge higher prices to make up for marginal costs
your competitor’s prices
competitors also facing rising input costs so they will be raising prices as well- can raise prices along side them and remain competitive
should raise your prices for next year because you expect other businesses (both your suppliers and competitors) to raise their prices
self fulfilling prophecy
inflation expectations create inflation
widespread expectation of any particular inflation rate is enoug to push suppliers to raise their prices so that theyll create that inflation
if people expect high inflation, they will get high inflation
if people expect low inflation, they will get low inflation
policy makers goal
convince people that future inflation is going to be low, even when businesses are experiencing a temporary rise in inflation
three ways to track inflation expectations
surveys
survey a representative group of people about their inflation expectations
economist’s forecasts
ongoing survey of professional economists regarding their inflation forecasts
financial markets
the 10 year break - even rate suggests what investors expect inflation to be over the next 10 years
adaptive expectations
people who expect recent levels fo inflation to continue
anchored expectations
people who believe the Fed will deliver on its promist to ensure inflation stays around 2%
rational expectations
people who use all available data to come up with the most accurate forecast possible
sticky expectations
people who revisit their vews on inflation only irregularly, so they stick with their previous view
demand pull inflation pt 2
when excess demand pulls inflation up, so that it rises above expected inflation
can also pull inflation below inflation expectations when demand in unexpectedly weak
when demand mathces economy productive capacity, there’s no demand pull inflation
insufficient demand
when the quantity demanded at the prevailing price is below what’s supplied
2 observations
one) demand pull inflation is driven by output gap
when there’s a positive output gap (actual > potential) , there’s excess demand
when there’s a negative output gap (actual < potential), there’s insuffiecient demand
two) demand pull inflation leads inflation to diverge from inflation expectations
it drives unexpected inflation
unexpected inflation= inflation- inflation expectations
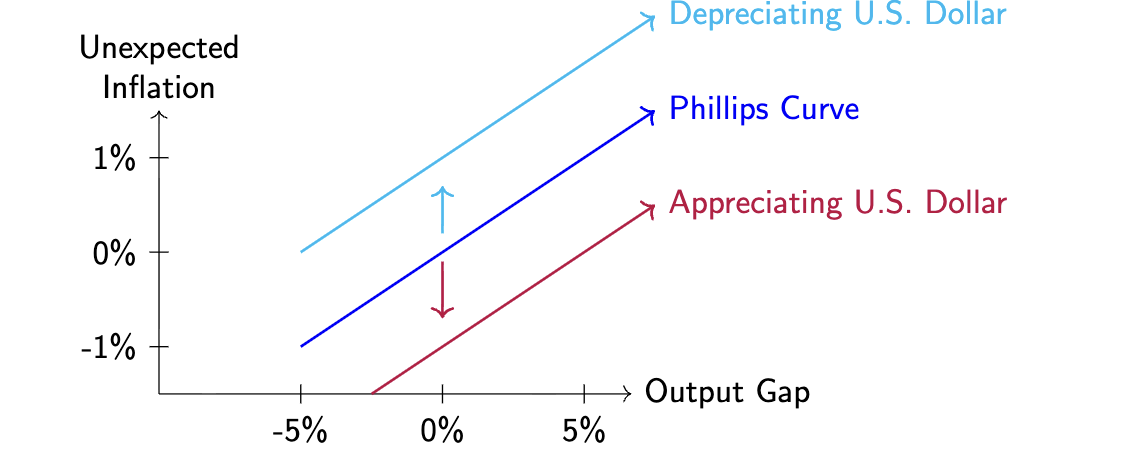
phillips curve is upward sloping
x-axis is output gap
y-axis is unexpected inflation
zeroes are in the middle of both axises
higher output relative to potential leads to greater inflationary pressure
if unexpected inflation is…
zero= actual inflation equals expected inflation
negative= actual inflation will be less than expected inflation
does not mean actual inflation is negative
positive= actual inflation will be greater than expected inflation
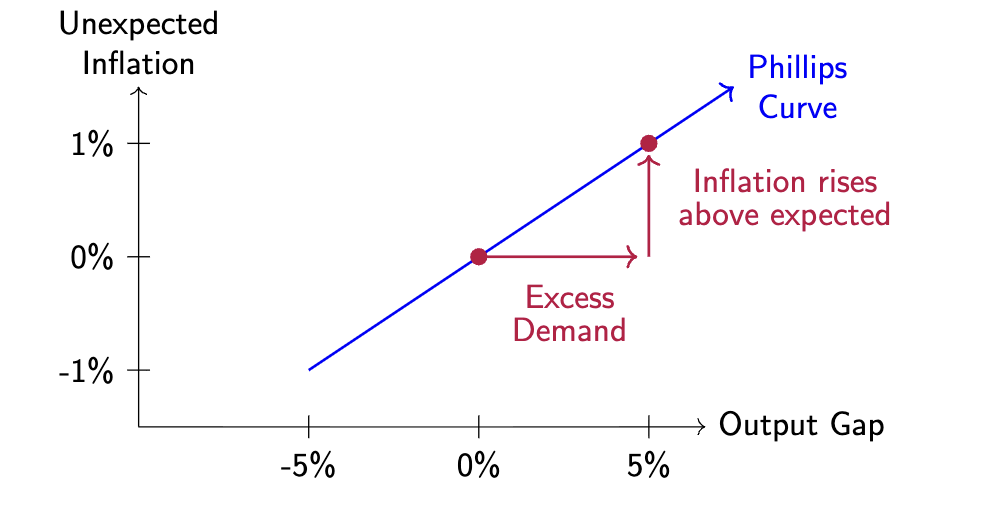
when output exceeds potential output
excess demand leads managers to raise prices more
inflation rises above expected inflation
positive direction (above 0)
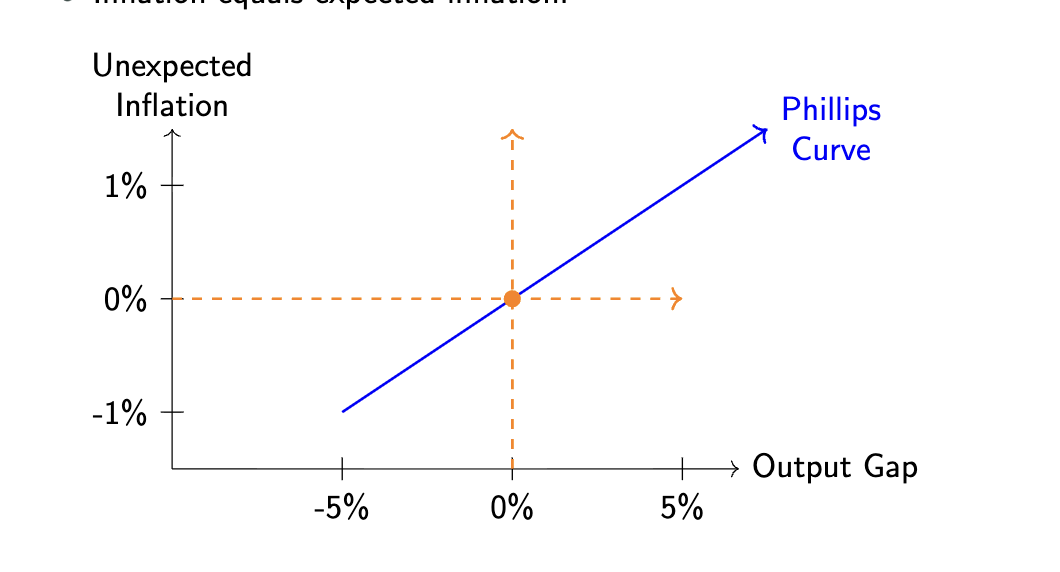
When output is equal to potential output
absence of demand-pull inflation
inflation equals unexpected inflation
when output is less than potential output
insufficient demand leads to price restraint
inflation falls below expected inflation
have to start dropping prices
using the philips curve to forecast inflation:
step 1) assess inflation expectations
analyze surveys of inflation expectations, survey of economists, or financial-based measures
step 2) forecast unexpected inflation
start with output gap estimate
look up and across the phillips curve to get your forecast of unexpected inflation
supply shocks
any change in production costs that leads suppliers to change the prices they charge at any given level of output
three causes of supply shock that will shift the phillips curve
input prices
productivity
exchange rates
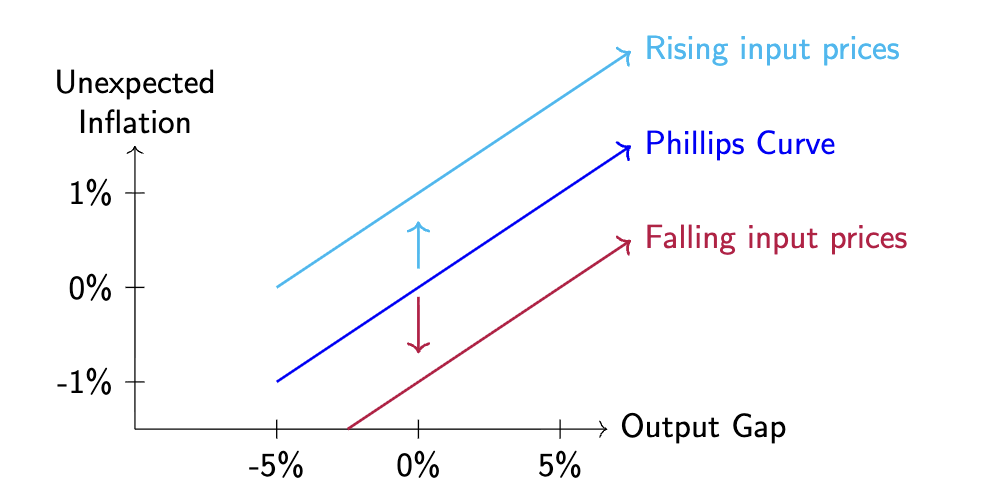
input prices as a shifter of the phillips curve
if prices of inputs rise
marginal costs rise- raise prices
boosts inflation at any given level of the output gap
important input prices:
oil and commodity prices
oil can act as a key source of cost-push inflation
rising wages
wage price spiral
a cycle where higher prices lead to higher nominal wages, which leads to higher prices
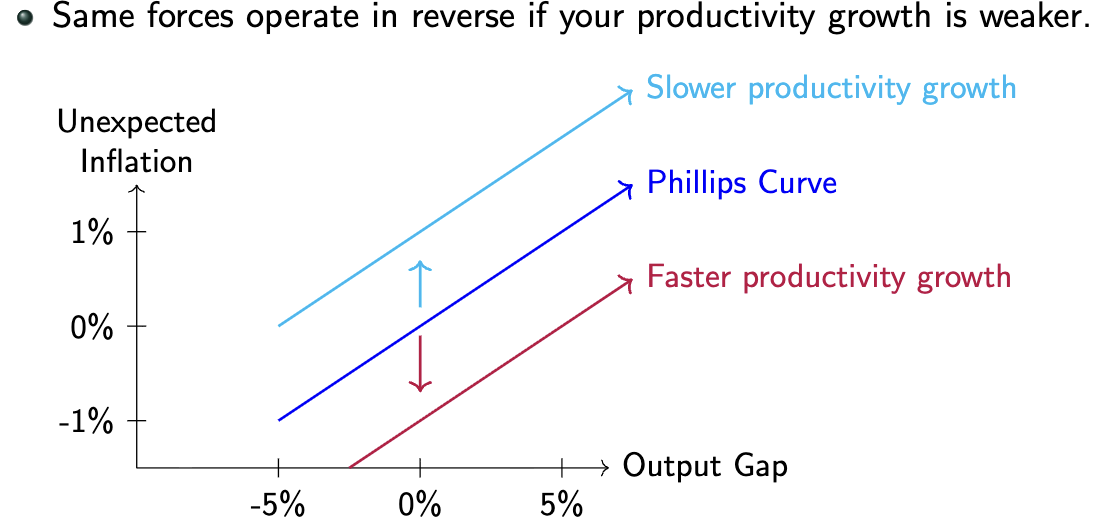
productivity as a shifter of the curve
faster than expected productivity growth lowers marginal costs
greater price restraint at any given output gap
form of negative cost-push inflation
phillips curve shifts down
exchange rates as a shifter
when the nominal exchange rate changes, there is a direct and indirect effect
depreciating US dollar shifts curve up
appreciating US dollar shifts curve down
direct effect
when the US dollar depreciates, foreign goods are more expensive for people in the US
it now takes more US dollars to pay for imported goods
boosts inflation
increases price of foreign made goods
indirect effect
more expensive foreign goods lead to higher prices on domestic goods
US business that use imported inputs now have higher marginal costs-raise prices
US businesses that compete with imported products face less competitive pressure and can raise prices
US business that export their products have foreign buyers who are now willing to pay more, and may also raise prices for US customers
shifts vs movements
demand pull inflation leads to MOVEMENTS along phillips curve
increased output gap= excess demand= rising prices= movement(upward and to the right)
decreased output gap= insufficient demand= falling prices=movement (downwards and to the left)
cost-oush inflation leads to a SHIFT in the curve
rising input costs, decreasing productivity growth, decpreciating US dollar= rising production costs= rising prices at each output gap= shifts up
lower input costs, rising productivity growth, appreciating US dollar= falling production costs= falling prices at each output gap- shifts down