unit 1 scm
1/68
There's no tags or description
Looks like no tags are added yet.
Name | Mastery | Learn | Test | Matching | Spaced | Call with Kai |
|---|
No analytics yet
Send a link to your students to track their progress
69 Terms
structural element
large capital investments that are difficult to reverse
includes tangible resources like buildings, equipment, computer systems
infrastructural element
the policies, people, decision rules and organizational structure choices made by a firm. affect culture and operation of the business. easier to change comparatively.
structural and infrastructural
each part of a business contains ? and ? elements
mission statement
reason for existence
core values
domain
business strategy
protect core competency
targeted customers/markets
areas of sustainable competitive advantage/core competency
role of supply chain partners
time frames and performance objectives
operations and supply chain strategies
translate business strategy into operations and supply chain actions
provide value to targeted customers/markets
develop supporting core competencies in operations and supply chain practices
operations and supply chain strategy
functional strategy that indicates how structural and infrastructural elements with the operations and supply chain areas will be acquired and developed to support the overall business strategy
3 primary objectives of operations and supply chain strategies
help management choose the long term right mix of structural and infrastructural elements based on a clear understanding of the performance dimensions valued by customers and the trade offs involved
ensure that the firm’s structural and infrastructural choices are strategically aligned with the firm’s business straegy
support the development of core competencies in the firm’s operations and supply chains
structural decision categories
capacity
facilities
tech
infrastructural decision categories
organization
sourcing/purchasing
planning and control
business processes and quality management
product and service development
4 major performance dimensions
quality
performance
conformance
reliability
flexibility
mix
changeover (switch to a diff)
volume (incr/decr output)
time
delivery speed
delivery reliability (deliver ON TIME, sometimes preferable to being early)
cost
labor
material
engineering
quality-related
overhead allocation
straddling
seeking to compete on all performance dimensions. may be a very risky strategy
trade offs among performance dimensions
difficult to excel at all 4 (cost, flexibility, time, quality)
some common conflicts
low cost vs high quality
low cost vs flexibility
delivery reliability (on time ) vs flexibility
conformance quality vs product flexibility
straddling (want to compete on all 4). risky.
order qualifiers
organization has to have these in place for customer to even consider buying the product or service
performance dimension on which customers expect a minimum level of performance
order winners
characteristics that attracts a customer to that particular product or service
performance dimension highly valued by customers that differentiates a company’s products and services from its competitors
tends to drive market share within a targeted market segment
prioritizing dimensions of organizational performance
ID product dimensions highly valued by customer, select competitive dimensions, and design supply chain to excel on these dimensions
order winners
characteristics that attracts a customer to that particular product or service
performance dimension highly valued by customers that differentiates a company’s products and services from its competitors
tends to drive market share within a targeted market segment
order qualifiers
organization has to have these in place for customer to even consider buying the product or service
performance dimension on which customers expect a minimum level of performance
could have order winners and not enough order qualifiers and then ur not even considered. sometimes order winners can also regress and become order qualifiers
feedback loop
from functional strategy that feeds back to business what are our capabilities/changes we can make. when we change business strategy we need a functional ability to actually deliver that
stages of alignment btw supply chain and operations strategies
stage 1
internally neutral: not linked to business strategy
just try to deliver at beginning, not much strategy
stage 2
externally neutral: follow industry best practices
then look at competition and basically copy bc u don’t know what else
stage 3
internally supportive: SC strategy aligned with business strategy
make concerted effort to align supply chain and business strategy. supply chain supports business strategy. (most successful companies)
stage 4
externally supportive: develop/exploit SC core competencies
world class
supply chain essentially becomes ur business strategy.
framework for order winners/qualifiers
divide mkt into segments based on order winners/qualifiers
cost, flexibility, service, quality, etc
ID current market segment or segment(s) to enter
translate order winners/qualifiers into process requirements
design processes to meet requirements
equipment, facility, labor, etc
design infrastructure to support processes
information and accounting systems, HR, etc.
structural decisions
capacity, facilities, tech
infrastructural decisions
organization, sourcing, planning & control, business processes, quality management, product development
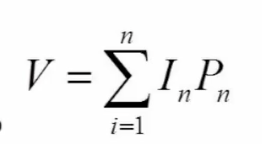
customer value index
a measure that uses performance and importance scores for the various performance dimensions for a product or service to calculate a score that indicates the overall value of an item or service to a customer
In= importance of dimension n (want high)
Pn performance for dimension n (want high)
sometimes this is just one component like if the difference is immaterial then may want to consider what other options the less “valuable” supplier offers
could reconfigure our product to favor a diff supplier
forecast
an estimate of the future level of some variable
underlying basis of all business decisions
mkt: promotions and sales
supply chain: purchasing, capacity, production, inventory
finance: cash flow projections, profits
HR: hiring/firing
MIS: user base size, tech development
challenge: actual future level of variable likely is higher/lower than the prediction (often significant amt)
demand forecasts
considering overall mkt demand and firm-level demand
supply forecasts
predict material availability based upon suppliers, trends, risk
price forecasts
forward buying (know price is low rn but predict will increase. determine that price of storing them is less than addtl cost of buying later)
futures contracts (pay for materials now but don’t take ownership of them until future. pay lower price. don’t pay for storage)
buying frequency (price is high, predict will decrease. increase frequency but smaller qty to take advantage of price drops)
benefits of better SC forecasts
lower inventories
reduced stockouts
smoother production plans
reduced costs
improved customer service
economic forecasts
inflation rates, borrowing rates
forecasting laws
almost always wrong (but still useful)
short term often more accurate than long term
? for groups/categories of products/services tend to be more accurate than ? for specific products or services
cheaper to forecast for group than individual (think like DOW)
not substitute for calculated values. only use ? when more reliable method isn’t available
forecasting steps
determine how it will be used
select values
determine planning time horizon
select potential model(s)
gather historical data
calculate using the model(s)
evaluate accuracy and choose model
make future predictions based on the model
long range forecast
asset acquisition
yearly planning bucket
3-10 years planning horizon
new product planning, facility cosntruction, tech
medium range forecast
asset utilization
monthly/quarterly planning bucket
3 mo- 2 yrs planning horizon
seasonal production, inventory, employment, budgeting
short range forecast
asset execution
weekly/monthly planning bucket
1-26 week planning horizon
job scheduling, worker assignments, inventory stocking
qualitative forecasting methods
subjective (opinion) based
used when there is limited quantitative data available
used when the relationship btw the past and the future is uncertain
new or trendy products
new tech
involves intuition, experience
forecasting sales of a new product
ex., market surveys, panel consensus, delphi method, life cycle analogy method, build up
quantitative methods
objective (calculation) based
used when quantitative historical data is available
used when the relationship btw the past and the future is predictable
existing or stable products
current technology
involves mathematical techniques
forecasting sales of products within a stable market
market surveys
structured questionnaires or mkt research panels
qualitative forecast method
panel consensus forecasting
experts meet together to develop forecasts
qualitative forecasting method
delphi method
experts develop forecasts separately and then revise
since separate, less likely to be initially influenced by groupthink
qualitative forecast method
life cycle analogy method
modeling growth and decline based upon similar products
qualitative forecasting
build up forecasts
market segment experts develop forecasts that are added together
qualitative forecasting
basically sales ppl give to regional directors who give to forecast to corporate and then nationwide basically.
id underly demand pattern
key to quantitative forecasting
demand patterns
key to quantitative forecasting
level or constant
avg value is relatively constant over time
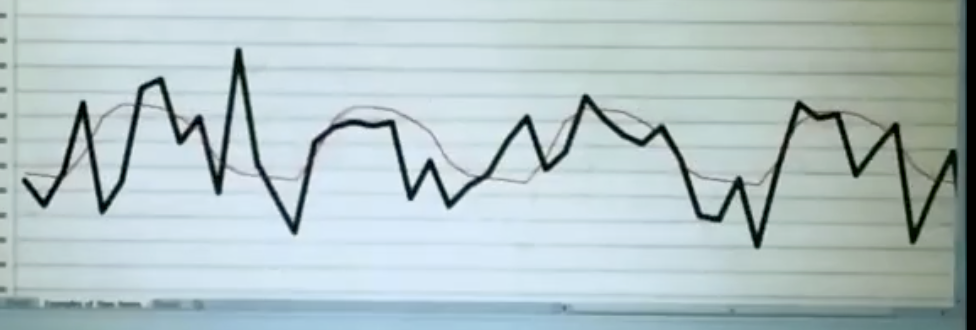
trend
long term movement up or down in a time series
seasonality
a repeated pattern of spikes or drops associated with certain times of the year
cyclical
long term cycles of demand often over several years
ex., product life cycles, presidential election impact on markets
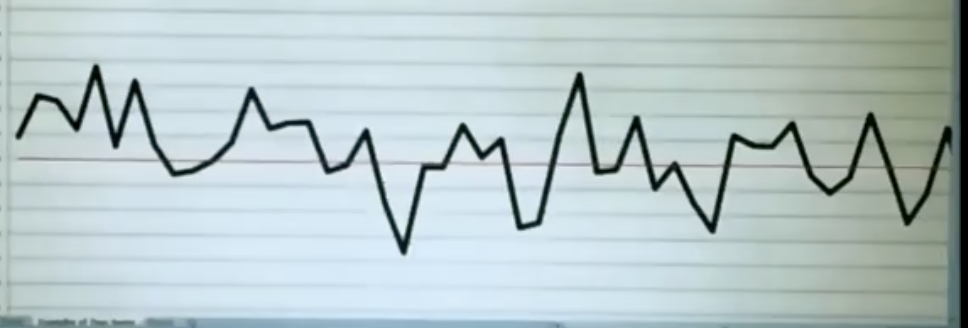
randomness
unpredictable movement from one time period to the next
often serves to hide underlying demand pattern
random variation is what makes forecasts esp difficult
measure by “variance” or “standard deviation”
level demand pattern
avg value is relatively constant over time
shown w/ random variation
seasonality
a repeated pattern of spikes or drops associated with certain times of the year
shown w/ random variation
quantitative forecasting approaches
time series models
demand follows a trend and/or pattern over time
last period or naive forecast
moving average
weighted moving average
exponential smoothing
adjusted exponential smoothing*
linear regression*
causal models
demand predicted by observing environmental factors like economic indicators
linear regression*
multiple regression*
time series
quantitative forecasting model
a set of periodic observations arranged in chronological order
period is the regular frequency with which measurements are plotted
assumption
past is good predictor of the future
risk underlying demand pattern may change over time
trade offs
forecast responsiveness
forecast stability
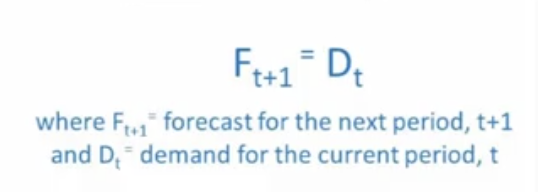
last period/naive approach
current demand becomes the next period’s forecast
simplest time series model
very responsive to demand changes in short term, but unstable for long range planning
major weakness: does not consider historical trends and patterns over time
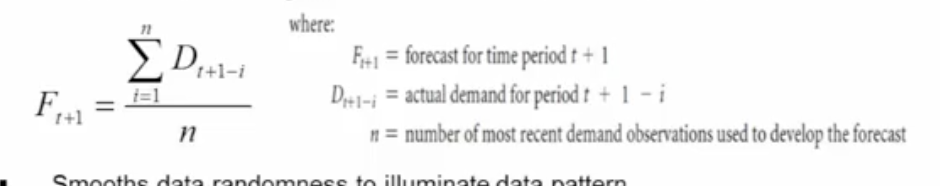
moving average model
forecasts average the n most recent demand values
smooths data randomness to illuminate data pattern
can be adjusted for the type of data being measured
more responsive: smaller n values (for data with frequent data pattern changes)
more stability: larger n values (for data with infrequent data pattern changes)
which day are u standing in, what are u forecasting 2. . ex., standing in day 11.
ex., period 1, demand 3. n=1 (standing in period 1, 3/1, forecast period 2 is 3)
could not have a forecast if not enough to meet n (like if n=5, u need 5 data points, take the 5 most recent points)
does not consider trend or seasonality
NOTE: n=1 is the same as the last period forecast
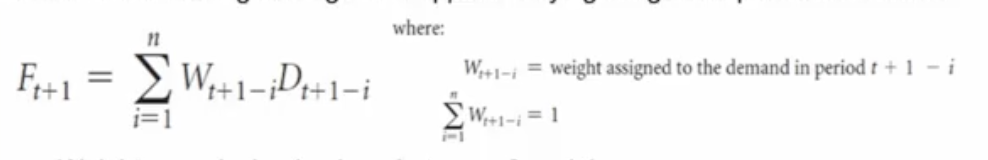
weighted moving avg method
a form of the moving avg that applies varying weights to past observations
weights are decimal values btw 0 and 1
weights are listed, the sum of the weights must equal 1 (check this!!)
first weight listed is applied to the most recent historical demand
last weight listed is applied to the n-th most recent historical demand
highest weights usually placed on more recent past demand
cyclical patterns can be modeled by adjusting weight values
responsiveness determined by weight values
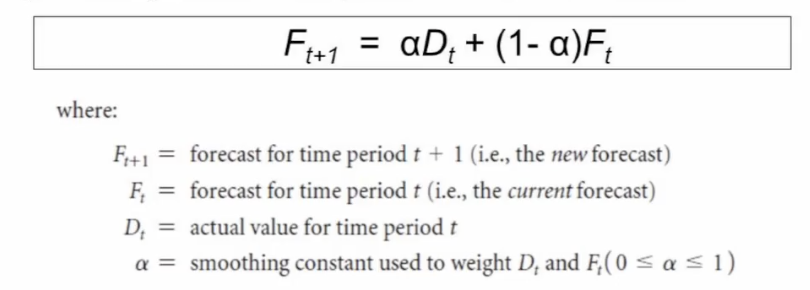
exponential smoothing model
a form of moving avg model in which the forecast for the next period is calculated as the weighted avg of the current period’s actual value and forecast
allows one to adjust the balance btw forecasted values and actual values
the closer alpha is to 1, the greater the weight put on the most recent actual demand value
bc this involves utilizing prev forecast, an initial forecast (using some other method) will always be given
this involves using prev forecast which is based on prev forecast and so on
a forecast based on this method is somewhat influenced by all previous forecasts
exponential smoothing model
features
weighted model with greater weight on most recent data
requires very little stored data (only the past period forecast and demand) and easy to automate
the general rules for determining alpha
stability
the greater the randomness in the time series data, the lower the alpha value (more weight placed on forecast values)
the less randomness in the time series data, the higher the alpha value (more weight that is placed on the most recent demand value)
responsiveness
greater instability in underlying pattern, the higher the alpha value
the less instability in the underlying demand pattern, the lower the alpha value
alpha is selected to minimize forecast error
? constant/alpha is typically btw (incl) 0.05 and 0.3
not well suited to forecast trend or seasonality (tends to lag trending and seasonal data). better for flat or slowly changing data
alternative methods to address trending or seasonality
adjusted exponential smoothing
expanded exponential smoothing calculating considers trending
contains an “unadjusted forecast” component (alpha)
contains a “trend adjustment” component (beta)
linear regression
attempts to model underlying trends using a straight line
form of the line is forecast = constant + slope (time)
seasonally adjusted linear regression
multiplies linear regression forecasts by a seasonal index
adjusted exponential smoothing
expanded exponential smoothing calculating considers trending
contains an “unadjusted forecast” component (alpha)
contains a “trend adjustment” component (beta)
linear regression forecast
attempts to model underlying trends using a straight line
form of the line is forecast = constant + slope (time)
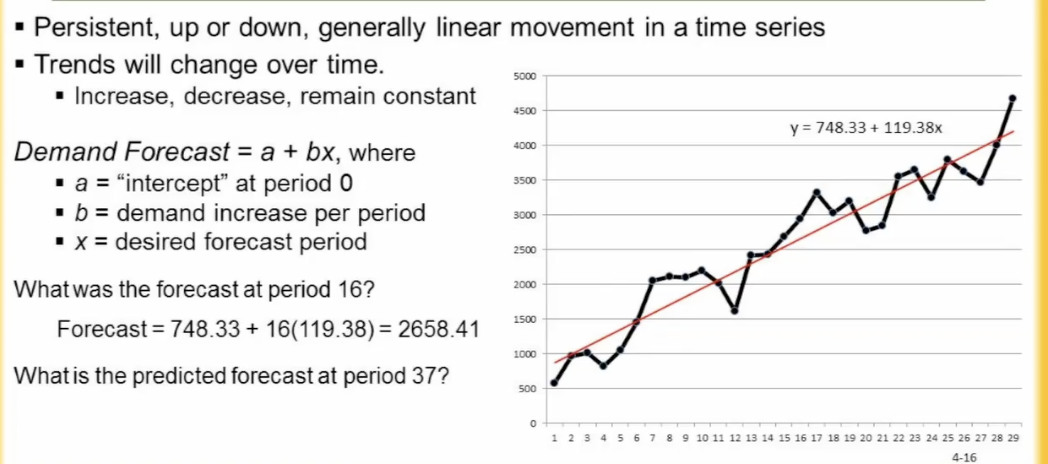
persistent, up or down, generally linear movement in a time series
trends will change over time
increase, decrease, remain cosntant
demand forecast = a + bx, where
a = “intercept” at period 0
b= demand increase per period
x= desired forecast period
seasonally adjusted linear regression
multiplies linear regression forecasts by a seasonal index
causal forecasting/correlation models
quantitative forecasting method that predicts a dependable variable as a mathematical function of something other than time (the independent variable)
linear regression
establishes a mathematical relation btw one dependent variable and one independent variable
multiple regression
establishes a mathematical relation btw one dependent variable and multiple independent variables
dependent variable
the variable that is assumed to be “caused”
independent variable
the variable(s) that are assumed to do the “causing”
linear regression
causal forecasting/correlation model
establishes a mathematical relation btw one dependent variable and one independent variable
multiple regression
causal forecasting/correlation model
establishes a mathematical relation btw one dependent variable and multiple independent variables
measures of forecast accuracy
used to assess how well a model is performing or to compare multiple forecast models to one another
closer to 0 is better
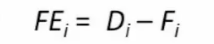
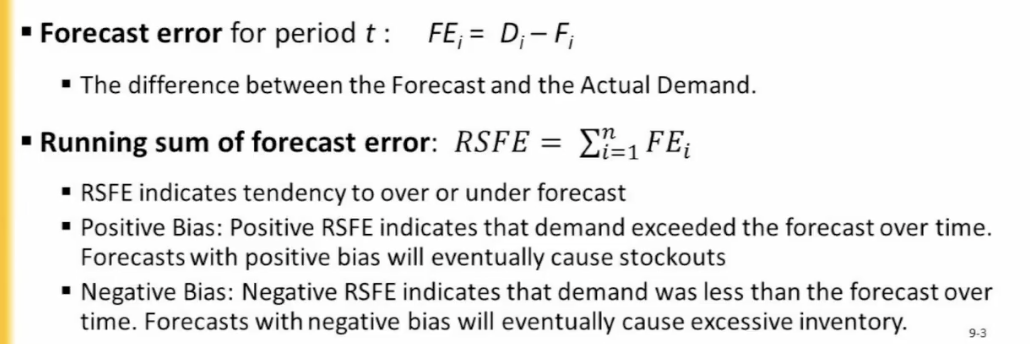
forecast error
difference btw forecast and actual demand
running sum of forecast error
indicates tendency to over/under forecast
positive bias (demand exceeds the forecast over time)
forecasts with positive bias will eventually cause stockouts (no supply)
negative bias (demand less than forecast over time)
forecasts with negative bias will cause excessive inventory
running sum of forecast error RSFE
indicates tendency to over/under forecast
positive bias (demand exceeds the forecast over time)
forecasts with positive bias will eventually cause stockouts (no supply)
negative bias (demand less than forecast over time)
forecasts with negative bias will cause excessive inventory
sum of all the errors basically
can manipulate a positive/negative bias (ex., for positive if fruit will go bad or u know clothing will go out of style, produce less)
forecast error
difference btw forecast and actual demand