Econ Exam 1 - ch. 3
1/49
There's no tags or description
Looks like no tags are added yet.
Name | Mastery | Learn | Test | Matching | Spaced | Call with Kai |
|---|
No analytics yet
Send a link to your students to track their progress
50 Terms
Which of the following is used to explain why consumers buy other goods when the price of a good rises?
a. the law of demand
b. the substitution effect
c. the income effect
d. the ceteris paribus condition
b. the substitution effect
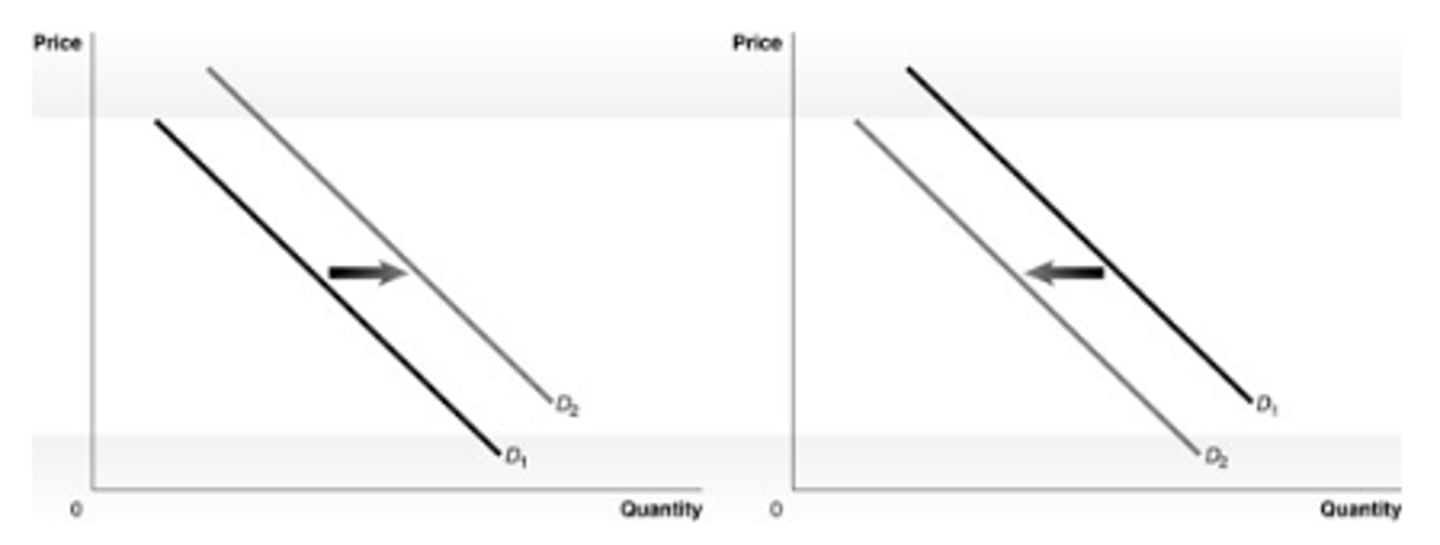
Refer to the graphs below. Each graph refers to the demand for laptops. Which of the graphs illustrates the impact of an increase in income, assuming that laptops are a normal good?
a. the graph on the left
b. the graph on the right
c. both graphs
d. neither graph
a. the graph on the left

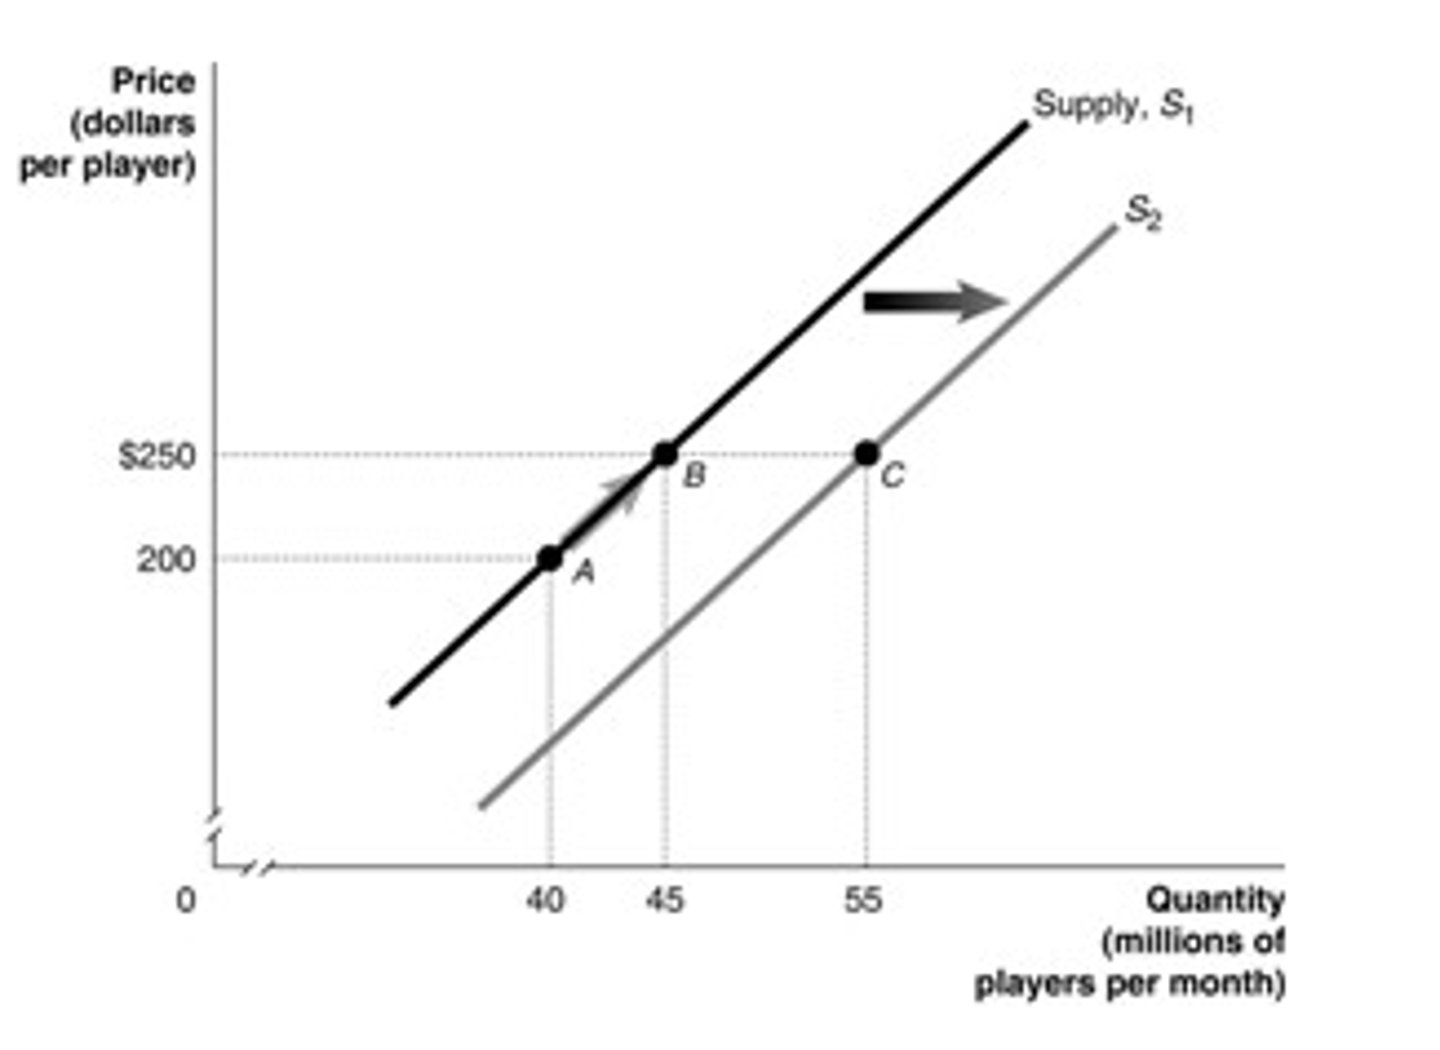
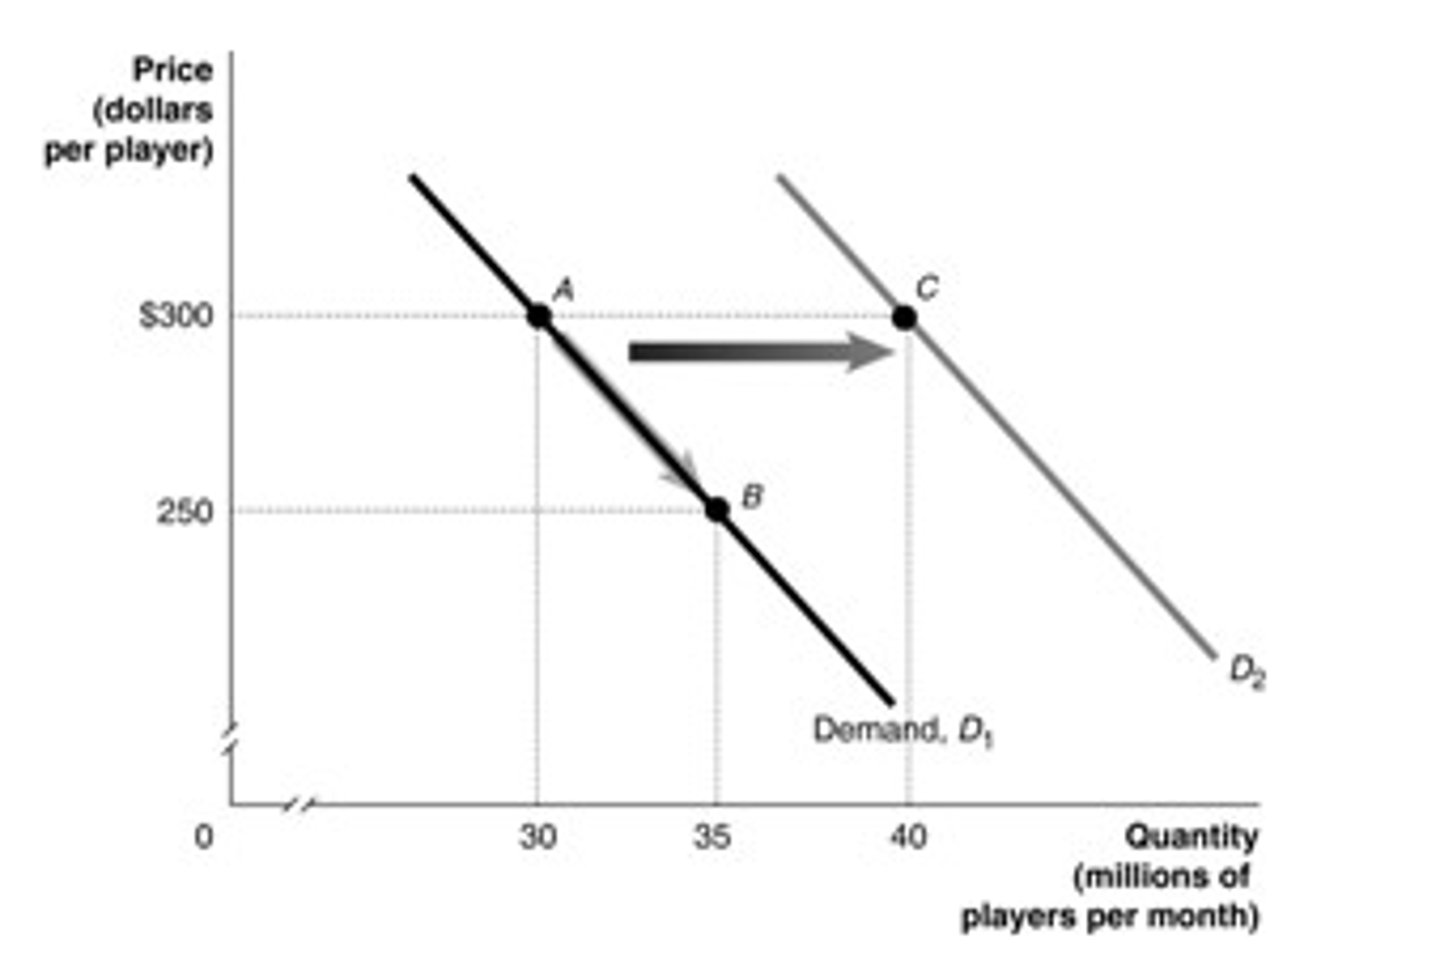
Refer to the graph below. Which of the following moves illustrates a change in demand?
a. the move from A to B
b. the move from A to C
c. either the move from A to B or from A to C
d. the move from B to A
b. the move from A to C

Refer to the graph below. Which of the following moves illustrates what happens when there is a change in the price of the good.
a. the move from A to B
b. the move from A to C
c. either the move from A to B or from A to C
d. none of the above
a. the move from A to B

Which of the following would not shift the demand curve for a good or service?
a. a change in the price of a related good
b. a change in the price of the good or service
c. a change in expectations about the price of the good or service
d. a change in income
b. a change in the price of the good or service
Which of the following is used to describe how changes in price affect a consumer’s purchasing power?
a. the law of demand
b. the substitution effect
c. the income effect
d. the ceteris paribus condition
c. the income effect
Refer to the graphs below. Each graph refers to the demand for earbuds. Which of the graphs illustrates the impact of an increase in the price of a complementary good?
a. the graph on the left
b. the graph on the right
c. both graphs
d. neither graph
b. the graph on the right

The term quantity supplied refers to:
a. the quantity of a good or service that a firm is willing and able to supply at a given price.
b. a table that shows the relationship between the price of a product and the quantity of the product supplied.
c. a curve that shows the relationship between the price of a product and the quantity of the product demanded.
d. none of the above
a. the quantity of a good or service that a firm is willing and able to supply at a given price.
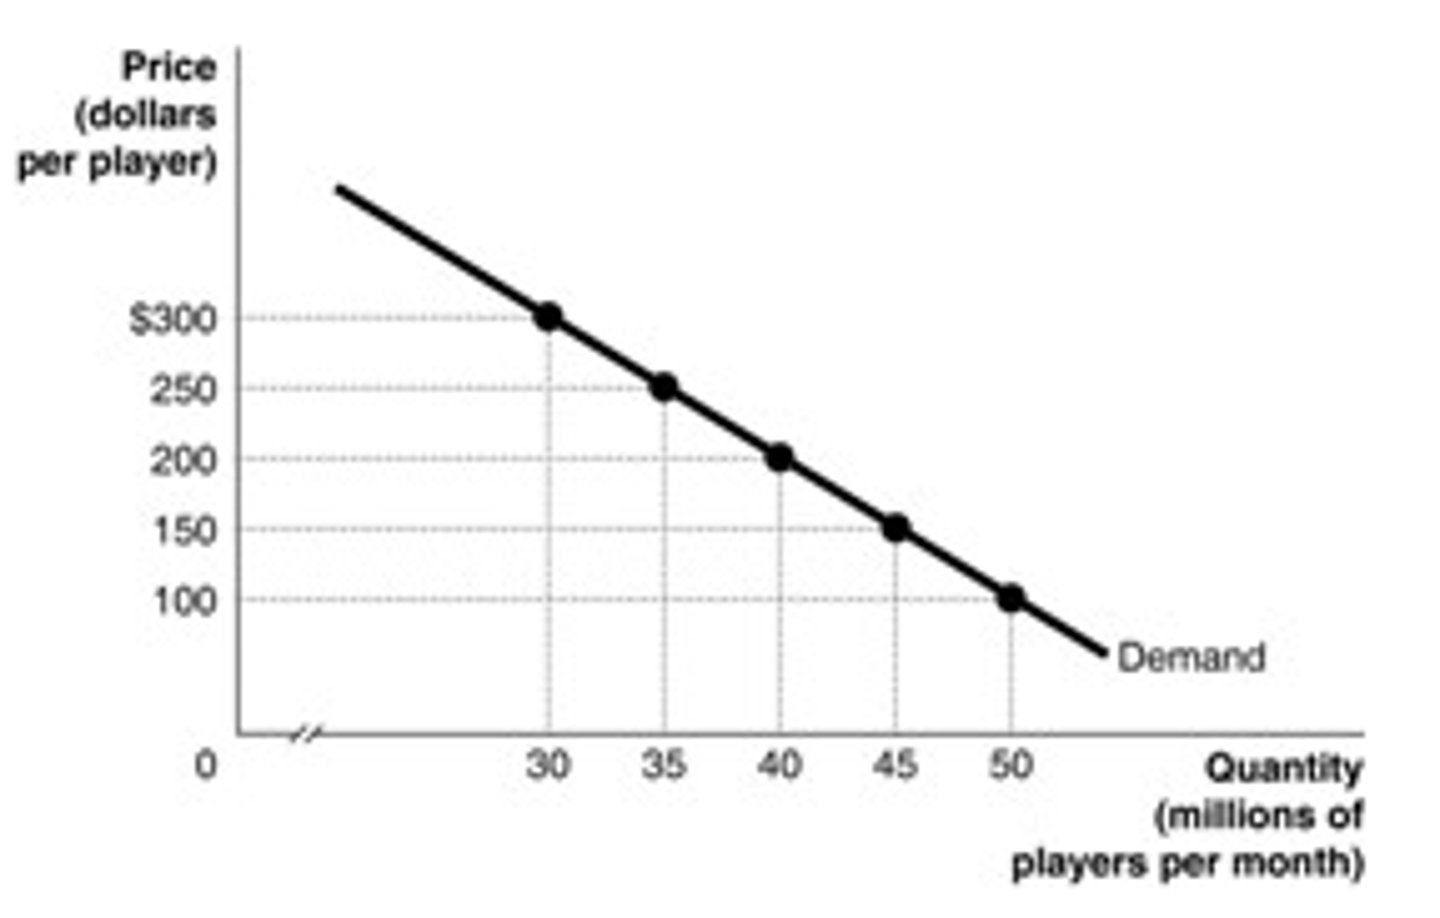
Refer to the graph below. What happens to quantity demanded along this demand curve?
a. Quantity demanded increases as the price increases.
b. Quantity demanded increases as the price decreases.
c. Quantity demanded may increase or decrease as the price increases.
d. Quantity demanded is not related to price.
b. Quantity demanded increases as the price decreases.
Which of the following would definitely result in a higher price in the market for tennis shoes?
a. demand increases and supply decreases
b. demand and supply both decrease
c. demand decreases and supply increases
d. demand and supply both increase
a. demand increases and supply decreases
When two goods are complements, which of the following is true?
a. The two goods can be used for the same purpose.
b. The two goods are used together.
c. The demand for each of these goods increases when income rises.
d. The demand for each of these goods increases as income falls.
b. The two goods are used together.
Refer to the graphs below. Each graph refers to the demand for water. Which of the graphs illustrates the impact of an increase in the expected price of water in the future?
a. the graph on the left
b. the graph on the right
c. both graphs
d. neither graph
a. the graph on the left

When the price of a lattes rises, the quantity of lattes demanded by consumers falls. Therefore, the demand curve for lattes is:
a. unpredictable.
b. upward sloping.
c. downward sloping.
d. an exception to the law of demand.
c. downward sloping.
Which of the following is the correct definition of demand curve?
a. the quantity of a good or service that a consumer is willing to purchase at a given price
b. a table showing the relationship between the price of a product and the quantity of the product demanded
c. a curve that shows the relationship between the price of a product and the quantity of the product demanded
d. the demand for a product by all the consumers in a given geographical area
c. a curve that shows the relationship between the price of a product and the quantity of the product demanded
Which of the following is the correct definition of market demand?
a. the quantity of a good or service that a consumer is willing to purchase at a given price
b. a table showing the relationship between the marginal cost of a product and the quantity of the product demanded
c. a curve that shows the relationship between the price of a product and the quantity of the product supplied
d. the demand by all the consumers for a given good or service
d. the demand by all the consumers for a given good or service
Which of the following is the textbook’s definition of a supply curve?
a. the quantity of a good or service that a firm is willing to supply at a given price
b. a table that shows the relationship between the price of a product and the quantity of the product supplied
c. a curve that shows the relationship between the price of a product and the quantity of the product supplied
d. none of the above
c. a curve that shows the relationship between the price of a product and the quantity of the product supplied
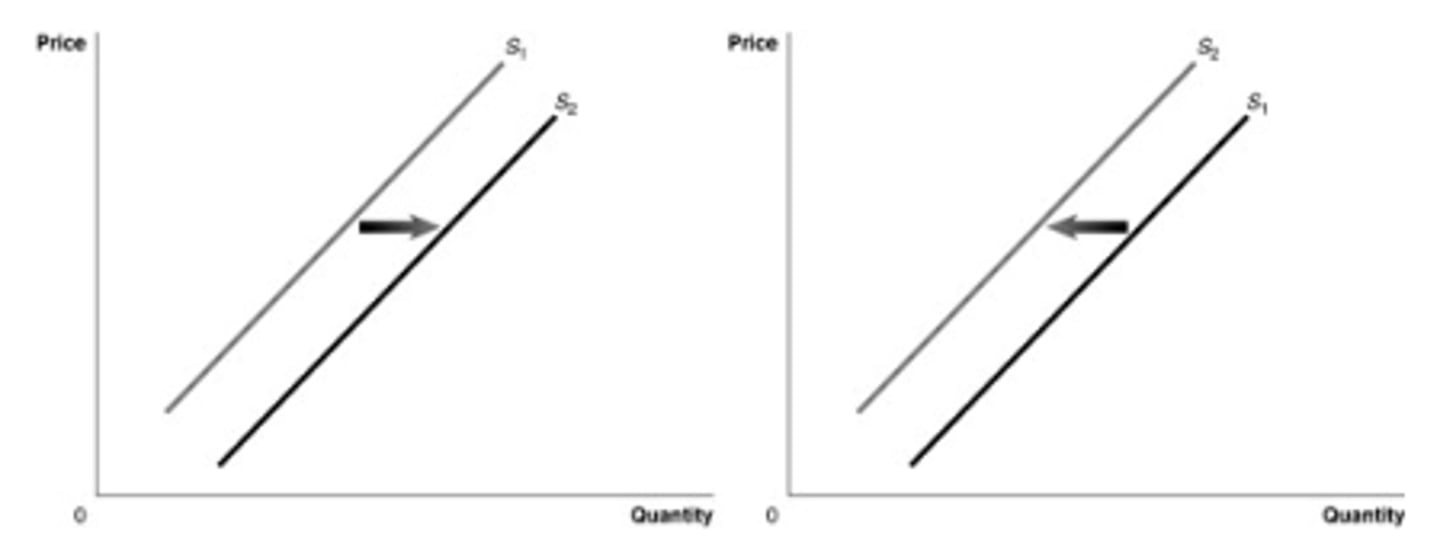
Refer to the graphs below. Each graph refers to the supply for cell phones. Which of the graphs illustrates the impact of an increase in the number of firms in the market?
a. the graph on the left
b. the graph on the right
c. both graphs
d. neither graph
a. the graph on the left

Which of the following would shift the supply of Red Bull to the left?
a. an increase in the price of Red Bull
b. an increase in the price of inputs used to produce Red Bull
c. a decrease in the expected future price of Red Bull
d. all are correct
b. an increase in the price of inputs used to produce Red Bull
If peanut butter and jelly are complements, how will an increase in the price of jelly affect the demand for peanut butter?
a. Demand for peanut butter will increase.
b.Demand for peanut butter will decrease.
c. Demand for peanut butter will not change, but the quantity of peanut butter demanded will increase.
d. Demand for peanut butter will not change, but the quantity of peanut butter demanded will decrease.
b.Demand for peanut butter will decrease.
Refer to the graph below. In the market for digital music players, price is $250 and quantity demanded is 35 million players. Which of the following interpretations of this point on the graph is correct?
a. This point shows that consumers spend a total of $250 on 35 million players each month.
b. When one player costs $250, consumers buy 35 million of them per month.
c. When one player costs $250, suppliers sell 35 million of them per month.
d. At $250, quantity demanded equals quantity supplied.
b. When one player costs $250, consumers buy 35 million of them per month.

Refer to the graphs below. Each graph refers to the supply for earbuds. Which of the graphs illustrates the impact of an increase in the price of a substitute in production?
a. the graph on the left
b. the graph on the right
c. both graphs
d. neither graph
b. the graph on the right

Suppose that the income of buyers in a market increases and a technological advancement also occurs. What would we expect to happen in the market for a normal good?
a. The equilibrium price would increase, but the impact on the amount sold in the market would be ambiguous.
b. The equilibrium price would decrease, but the impact on the amount sold in the market would be ambiguous.
c. Equilibrium quantity would increase, but the impact on equilibrium price would be ambiguous.
d. Both equilibrium price and equilibrium quantity would increase
c. Equilibrium quantity would increase, but the impact on equilibrium price would be ambiguous.
Refer to the graphs below. Each graph refers to the supply for computer chips. Which of the graphs illustrates the impact of an increase in productivity?
a. the graph on the left
b. the graph on the right
c. both graphs
d. neither graph
a. the graph on the left

Refer to the graph below. Which of the following moves illustrates what happens when there is a change in a determinant of the supply other than the price?
a. the move from A to B
b. the move from B to C
c. either the move from A to B or from A to C
d. none of the above
b. the move from B to C
What is a normal good?
a. a good for which demand increases as income rises
b. a good for which demand decreases as income rises
c. a good that can be used together with another good
d. a good that serves more than one purpose
a. a good for which demand increases as income rises
Refer to the graphs below. Each graph refers to the demand for electric cars. Which of the graphs illustrates the impact of an increase in consumers’ tastes for electric cars?
a. the graph on the left
b. the graph on the right
c. both graphs
d. neither graph
a. the graph on the left

What is the law of demand?
a. The law of demand states that a change in the quantity demanded, caused by changes in price, makes the good more or less expensive relative to other goods.
b. The law of demand states that a change in the quantity demanded, caused by changes in price, affects a consumer’s purchasing power.
c. The law of demand is the rule that, holding everything else constant, when the price of a good falls, the quantity demanded will increase, and when the price of a good rises, the quantity demanded will decrease.
d. The law of demand is the requirement that when analyzing the relationship between price and quantity demanded, other variables must be held constant.
A surplus exists in a market if the actual price is:
a. equal to the equilibrium price.
b. below the equilibrium price.
c. above the equilibrium price.
d. either above or below the equilibrium price.
c. above the equilibrium price.
Refer to the graphs below. Each graph refers to the demand for water. Which of the graphs illustrates the impact of an increase in population?
a. the graph on the left
b. the graph on the right
c. both graphs
d. neither graph
a. the graph on the left
Refer to the graphs below. Each graph refers to the supply for gasoline. Which of the graphs illustrates the impact of an increase in the expected future price of gasoline?
a. the graph on the left
b. the graph on the right
c. both graphs
d. neither graph
b. the graph on the right
Refer to the graphs below. Each graph refers to the demand for bikes. Which of the graphs illustrates the impact of an increase in the price of a substitute good?
a. the graph on the left
b. the graph on the right
c. both graphs
d. neither graph
a. the graph on the left

Economists refer to the necessity of holding all variables other than price constant in constructing a demand curve as the:
a. law of demand.
b. substitution effect.
c. income effect.
d. ceteris paribus condition.
d. ceteris paribus condition.
Refer to the graph below. Which of the following moves illustrates a change in quantity demanded?
a. the move from A to B
b. the move from A to C
c. either the move from A to B or from A to C
d. the move from B to C
a. the move from A to B
Which of the following would result in a decrease in the demand for Red Bull?
a. an increase in the price of Red Bull
b. an increase in the price of Monster Energy, a substitute for Red Bull
c. an increase in income, assuming Red Bull is a normal good
d. an increase in the price of pizza, a complement of Red Bull
d. an increase in the price of pizza, a complement of Red Bull
Which of the following is the textbook’s definition of a supply schedule?
a. the quantity of a good or service that a firm is willing to supply at a given price
b. a table that shows the relationship between the price of a product and the quantity of the product supplied
c. a curve that shows the relationship between the price of a product and the quantity of the product demanded
d. none of the above
b. a table that shows the relationship between the price of a product and the quantity of the product supplied
What does the term quantity demanded refer to?
a. the total amount of a good or service that a consumer is willing to buy per month
b. the quantity of a good or service demanded that corresponds to the quantity supplied
c. the quantity of a good or service that a consumer is willing and able to purchase at a given price
d. none of the above
c. the quantity of a good or service that a consumer is willing and able to purchase at a given price
Refer to the graph below. Which of the following moves illustrates what happens when a change in the price affects the market supply?
a. the move from A to B
b. the move from A to C
c. either the move from A to B or from A to C
d. none of the above
a. the move from A to B

Refer to the graph below. Which of the following moves illustrates what happens when there is a change in a determinant of the demand other than a change in price?
a. the move from A to B
b. the move from A to C
c. either the move from A to B or from A to C
d. none of the above
b. the move from A to C

Refer to the graphs below. Each graph refers to the supply for electric cars. Which of the graphs illustrates the impact of an increase in the price of an input?
a. the graph on the left
b. the graph on the right
c. both graphs
d. neither graph
b. the graph on the right

If a shortage exists in a market we know that the actual price is:
a. below equilibrium price and quantity demanded is greater than quantity supplied.
b. above equilibrium price and quantity demanded is greater than quantity supplied.
c. above equilibrium price and quantity supplied is greater than quantity demanded.
d. below equilibrium price and quantity supplied is greater than quantity demanded.
a. below equilibrium price and quantity demanded is greater than quantity supplied.
Refer to the graph below. Along the demand curve, what happens to the quantity demanded as the price falls from $250 to $200 per player?
a. The quantity demanded increases from 35 million to 40 million players per month.
b. The quantity demanded decreases from 40 million to 35 million players per month.
c. We cannot predict the change in the quantity demanded without the supply curve.
d. The change in the quantity demanded is not related to a change in price.
a. The quantity demanded increases from 35 million to 40 million players per month.

Which of the following is consistent with the law of supply?
a. An increase in price causes an increase in the quantity supplied, and a decrease in price causes a decrease in the quantity supplied.
b. A change in price causes a shift of the supply curve.
c. Supply shifts are caused not by a single variable but most likely by a number of different variables.
d. All are consistent with the law of supply.
a. An increase in price causes an increase in the quantity supplied, and a decrease in price causes a decrease in the quantity supplied.
Which of the following describes two goods that are substitutes?
a. As the price of one of the goods increases, the demand for the other good increases.
b. The more consumers buy of one good, the more they will buy of the other good.
c. The demand for each of these goods increases when income increases.
d. The demand for each of these goods increases as income decreases.
a. As the price of one of the goods increases, the demand for the other good increases.
An early frost in the apple orchards of Washington State would cause:
a. an increase in the demand for apple juice, increasing equilibrium price.
b. an increase in the supply of apple juice, decreasing equilibrium price.
c. a decrease in the demand for apple juice, decreasing equilibrium price.
d. a decrease in the supply of apple juice, increasing equilibrium price.
d. a decrease in the supply of apple juice, increasing equilibrium price.
Which of the following is the correct definition of demand schedule?
a. the quantity of a good or service that a consumer is willing to purchase at a given price
b. a table showing the relationship between the price of a product and the quantity of the product demanded
c. a curve that shows the relationship between the price of a product and the quantity of the product demanded
d. the demand for a product by all the consumers in a given geographical area
b. a table showing the relationship between the price of a product and the quantity of the product demanded
If both demand and supply decrease in the market for Red Bull, how will equilibrium be affected?
a. Equilibrium price and equilibrium quantity will rise.
b. Equilibrium price and equilibrium quantity will fall.
c. Equilibrium price will rise, but the impact on equilibrium quantity is ambiguous.
d. The impact on equilibrium price will be ambiguous, but the equilibrium quantity will fall.
d. The impact on equilibrium price will be ambiguous, but the equilibrium quantity will fall.
What is an inferior good?
a. a good for which demand increases as income rises
b. a good for which demand decreases as income rises
c. a good that cannot be used together with another good
d. a good that does not serve any real purpose
b. a good for which demand decreases as income rises
How will a decrease in the expected future price of Red Bull affect the demand and supply of Red Bull?
a. Demand will rise and supply will fall.
b. Demand will rise and supply will rise.
c. Demand will fall and supply will rise.
d. Demand will fall and supply will fall.
c. Demand will fall and supply will rise.
How will a decrease in the expected future price of Red Bull affect the equilibrium price and quantity?
a. Equilibrium price and equilibrium quantity will rise.
b. Equilibrium price will fall, and equilibrium quantity will rise.
c. Equilibrium price will rise; the impact on equilibrium quantity is ambiguous.
d. Equilibrium price will fall; the impact on equilibrium quantity is ambiguous.
d. Equilibrium price will fall; the impact on equilibrium quantity is ambiguous.
Which of the following explains why there is an inverse relationship between the price of a product and the quantity of the product demanded?
a. Markets have many buyers and sellers, and all firms sell identical products.
b. There are no barriers to new firms entering markets.
c. the ceteris paribus condition
d. the substitution effect
d. the substitution effect