DNA Analysis and Interpretation
 Call Kai
 Learn
Learn Practice Test
 Spaced Repetition
 Match
Match Flashcards
 Knowt Play
1/45

There's no tags or description
Looks like no tags are added yet.
Name | Mastery | Learn | Test | Matching | Spaced | Call with Kai |
|---|
No analytics yet
Send a link to your students to track their progress
46 Terms
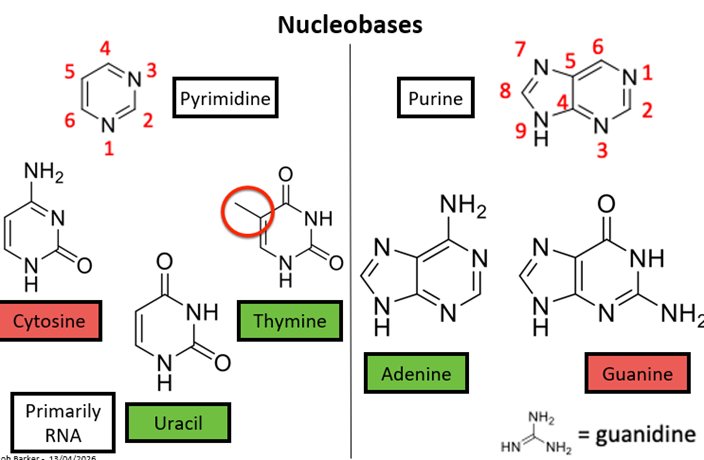
Nucleobases general structure
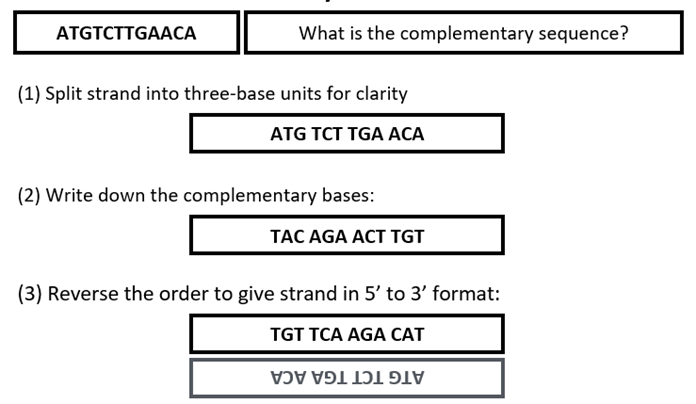
Calculating a complementary sequence base pair pattern
Why is DNA a double helix?
Negatively charged phosphate groups repel each other
Base pairs hydrogen bond
Stacking of nucleobases through hydrophobic/Van der Waals interactions compacts duplex vertically
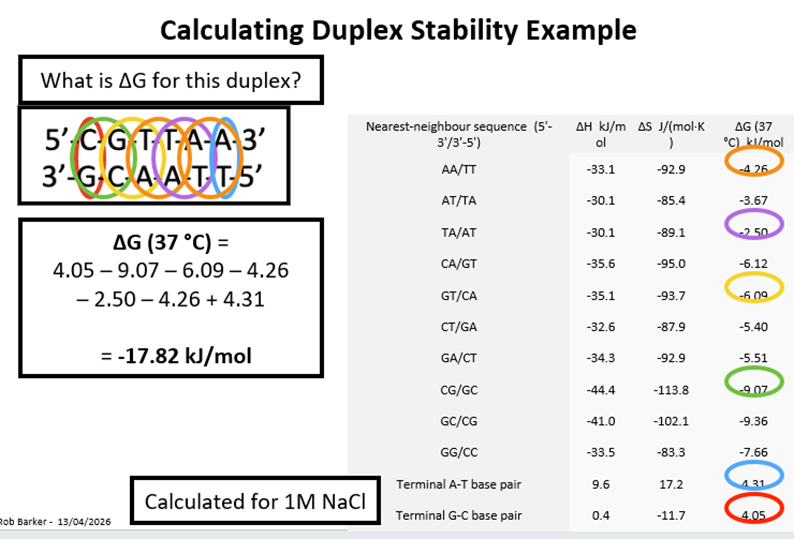
Calculating Duplex Stability
Buffers usage in DNA solution
Ensures we have control over protonation state
Prevents degradation
Maintains a constant pH to control protonation, maintaining the consistent electrical charge of the molecules
Maintains a constant temperature, preventing overheating and potential degradation of the DNA fragments
Henderson-Hasselbalch Equation
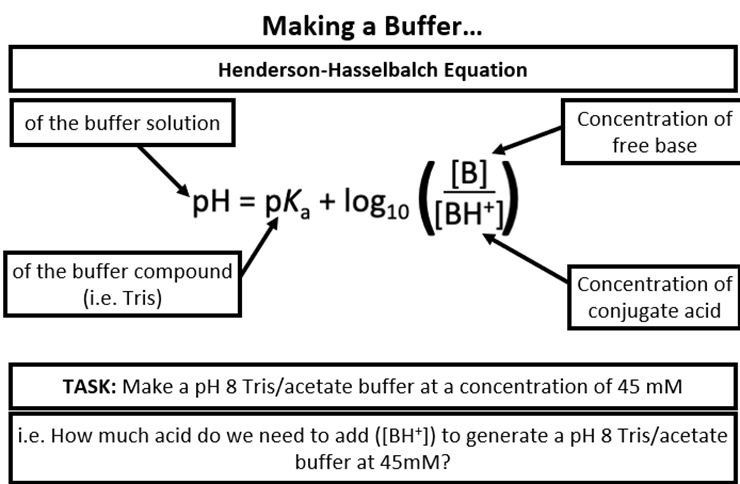
To inverse a log, you do 10 to the minus of it superscript
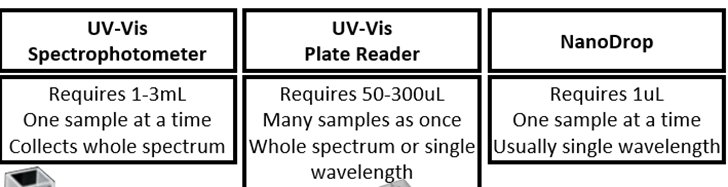
Instrumentations to measure concentration of DNA
Gel Electrophoresis theory
DNA is attracted to the positive electrode, due to the negative phosphate groups in the DNA backbone, attracting to the positive charge
Movement is proportional to charge/mass ratio
Samples are loaded, at the top
Using a ‘ladder’ allows you to compare with known lengths
Shorter strands move faster, appearing at bottom of gel
Visualising a gel
DNA absorbs UV light, so decreased transmission can be observed.
But UV light damages DNA rapidly.
Smeared bands, due to isotropic release of radiation.
32 Phosphorus labelling
Capillary electrophoresis
Used with many types of chemical and biochemical samples
Similar to HPLC, but force is electric field rather than pressure
For nucleic acids, capillary is filled with acrylamide gel
Obtain 1D graph, not 2D image
Faster than running a gel
Higher resolution than a gel
Can be automated
Impact and uses of PCR
Hereditary diseases
Identify viruses or microbes
Paleobiology
Familial relationships
Forensic investigation
PCR components
Template
Taq polymerase
Is a heat-resistant version of the polymerase enzyme
Stable for short periods of time at 90 degrees Celsius
Can replicate a 1000 base pair strand of DNA under 10s
Primers
Polymerase needs primers as it can only add bases to pre-existing strands
Primer sequence needs careful design to ensure proper binding to the right side only, telling Taq polymerase where to begin, only 15-30 bases long
Primers made by solid phase phosphoramidite chemistry, giving us control to design and modify our primers to our needs.
Most of human DNA sequences same in every person
- DNA profiling target repetitive, short tandem repeats (STRs, which are highly variable)
- We design primers to target the edges of these STRs
- Primer concentration determines the maximum yield of product; they are used up in each cycle.
dNTPs
Building blocks of new DNA
Added to allow the Taq polymerase to ‘build’
Build off the 3’ end of the DNA
Buffers and salt
Needed for hybridisation and extension
PCR process
Initialisation:
94 degrees Celsius for 30s – 5mins
Ensures template DNA is fully suspended and properly denatured
Especially important if the template is very long
Some ‘hot start’ polymerases require activation to begin working this way
Denaturation:
~ 94 degrees Celsius for 30s
Splits double stranded DNA into single stranded DNA
Annealing:
~ 64 degrees for 30s
Binds primers to template strands
Temp must be a few degrees lower than melting point of primers
Primers bind over complementary templates because of high concentration
Polymerase will also bind but not proceed
Elongation:
72 degrees for 30s
Or 1 min per 1000 base pairs
Synthesise the complementary strand
Temp is optimised for activity of the enzyme
Cycling:
15-40 repeats
Each cycle doubles DNA concentration
Too few = not enough amplification
Too many = limited by Dntp concentration
Too many leads to truncated products
Final extension and hold:
72 degrees for several minutes
Ensures all strands are finished
Reduces truncated products
Final hold – 4 degrees until needed, best condition for storing product
Troubleshooting - PCR
Occurs due to poor choice of primer sequence
Can occur if too much primer added
Primer dimer – when primer attaches to itself, and not to the DNA strand
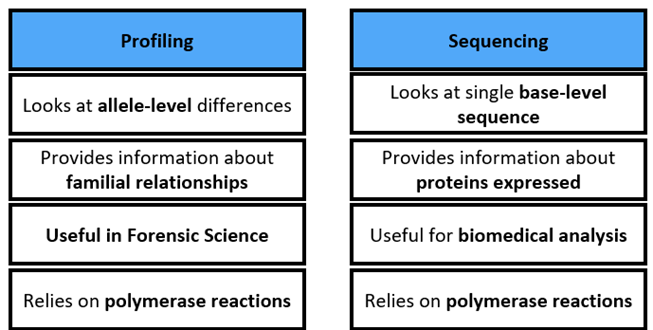
Profiling vs Sequencing
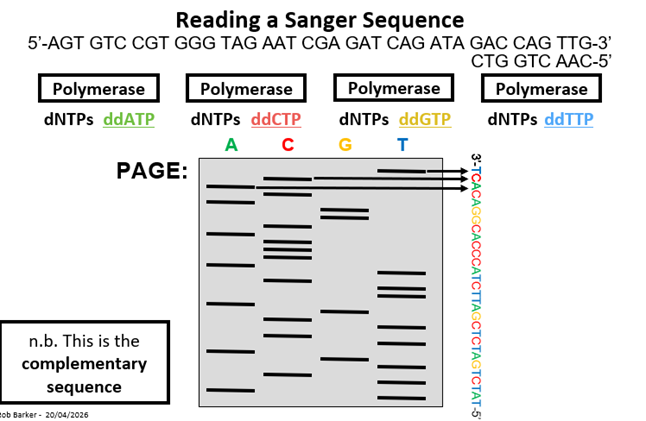
Reading a Sanger Sequence
Visualising a Sanger Sequence
Use phosphorus-32 labelled ddnTPs, but hard work to read the sequence
So, instead of P-32, label each ddNTP with a different colour of fluorescent dye
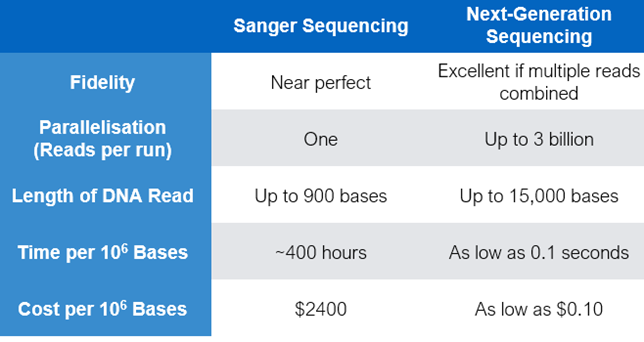
Sanger Sequencing vs Next Generation Sequencing (NGS)
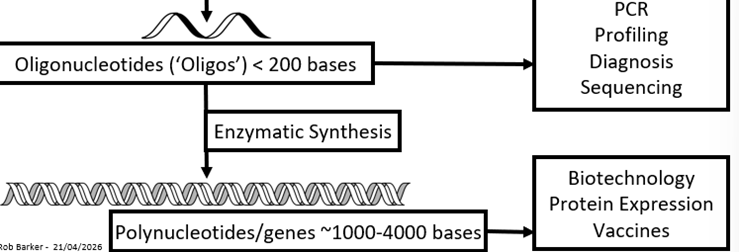
Why makes nucleic acids?
New drugs
Responsive healthcare
Future manufacturing
Making nucleic acids + their uses
Synthetic cycle capping
Capping = killing unreacted strands
One coupling failure every 200 strands
Leads to deleted mutations
Primer may not bind
Error will be carried forward to protein synthesis
Other biochemistry altered
Example shown:

Synthetic cycle - protection + purification of oligonucleotides + PAGE purification
Synthetic cycle – protection:
Protecting non specific groups from attaching to the strand.
Purification of oligonucleotides:
Failed strands have to be removed
PAGE purification:
Cut out portion with strand ‘freeze and squeeze’
Visualising DNA - the EPG axis + interpretating peaks
Graphic representation of DNA fragments
Horizontal axis = time/size (base pairs)
Vertical axis = intensity/quantity (Relative Fluorescence Units - RFU)
Single peaks - homozygous, inherited same allele from both parents
Double peaks - heterozygous, different alleles at the same locus
Height of peak is proportional to the amount of DNA that gave rise to that particular peak during the PCR amplification process
How peak info is read
Computers translate peaks into a series of numbered alleles, two for each marker
A control sample, referred to as an allelic ladder, is run through the genetic analyser
Analytical ladder is made up of DNA fragments that represent common alleles at a locus
Off ladder alleles are those which size outside the categories represented in the ladder
Internal size standards are specific DNA fragments of known sizes which are defined and used to size unknown fragments
Three main factors regarding DNA mixtures
How many people contributed DNA to the mixture?
How much DNA did each person contribute?
How degraded is the DNA?
~ All these can increase the complexity of the mixture
Limit of Detection meaning
= the lowest amount of DNA at which a profiling system can reliably detect true genetic signal rather than background noise.
Environmental challenges - degradation + inhibition + ski slope
Degradation = fragmentation of DNA due to heat, moisture, or UV
Inhibition = contaminants (dyes, soils) that ‘block’ the PCR process
Different ways inhibitors can interfere with Taq polymerase:
Binding to Taq polymerase, to its active site, preventing it from binding to DNA, dNTPs, carrying out strand extension
Denaturing the enzyme, preventing it from binding
Interfering with primer annealing, so weak peaks produced in the end
High peaks on the left (small fragments), low/vanishing peaks on the right (large fragments), causes degradation or inhibition
Both degradation and inhibition show a ski slope on the EPG
Ski slope = technical artefact - gradual decline in baseline signal across the EPG
Potential allele dropout at larger loci
Large and small molecular weights
A big fragment of DNA, an allele that corresponds to a big amount of DNA is more likely to suffer from degradation than a smaller one in the same mix
A big piece of DNA takes more time to go through the capillaries.
It is harder to get amplified during PCR amplification process than a small one.
If we’ve got something in the mix that is making it hard for the DNA polymerase is to amplify the DNA during PCR amplification that effect is going to be observed for the biggest pieces of DNA than it is for the smallest pieces of DNA
Comparison between SGM+ vs DNA 17 profiles
Number of loci = 10 (+ amelogenin) vs 16 (+ amelogenin)
Amelogenin = sex typing gene, whether a DNA sample came from a biological male or female
Robustness against inhibitors
DNA 17 + why it is preferred over previous multiplex
Enhanced DNA profiling system that examines 17 genetic markers (16 autosomal, 1 sex marker), replacing the older SGM+ system
Only small amounts of DNA needed to begin with
SGM+ loci = more sensitive
Increased cycle number of PCR
More resistant to inhibition
Reducing adventitious random match probabilities
How the NDNAD finds matches - 3 possibilities
Crime to person (direct hit)
Crime to crime (linking scenes)
Person to crime (backloading suspects)
Statistical foundations - maths behind the match
Hardy Weinberg principles
Formula 1 (homozygous) - p squared
Formula 2 (heterozygous) - 2pq
Contamination + dealing with it + sources of it + opportunities for it to occur
Contamination = to make something impure, by exposure to, or addition of, a polluting substance
Wearing appropriate PPE
Items brought into the lab wiped with alcohol
All people who enter labs must provide elimination DNA samples, so if DNA matter found on substances then people can be disregarded if present in lab
Each bench has its own equipment, reducing contamination between sets of items
If undetected, contamination could affect the whole batch of samples in a gross or blanket contamination
Sources: police, SOCO, pathologists, forensic scientists
Opportunities: from person to stain from consumable to stain, from stain to stain
Can occur at collection, extraction, amplification, injection. Degraded or low templated DNA increases risk
Touch DNA prone to contamination
Adventitious transfer
A ‘chance’ match where two people share a profile, highly rare
Analytical Threshold + stochastic threshold
Analytical threshold = the RFU level where signal is distinguished from background noise
Stochastic threshold = level where we can confidently say no ‘dropout’ has occurred
Any single allele above the ST would be considered homozygous, any allele below the ST is treated as having a missing sister allele
Deciphering nomenclature, e.g., D8S1179
D = DNA
8 = chromosome 8
S = Single copy sequence
1179 = registration number, variations in the repeat number
Allele dropout
Describes when allelic peaks fall below the analytical threshold of an instrument.
It is generally set to some amount above the lower detection limit of the instrument, where an analyst can reliably assign a peak as allelic with a low or nil risk of the peak being a baseline artifact.
Low-level DNA template and/or degraded DNA results in alleles not amplifying above this threshold, resulting in incomplete or partial profiles
Mixture Interpretation and the Clayton Rules
~ When dealing with more than one contributor
Identify the mixture
Determine the number of contributors
Estimate ratios and identify major vs minor contributors
Rules:
All observed alleles accounted for
No genotype introduces an allele that is not observed
Use the minimum number of contributors needed to explain data
Homozygotes must be justified by peak height
Peak height ratios must be biologically plausible
Dropout considered, but not over assumed
Conditioning on known contributors must not distort mixture
The Laboratory Journey
Firstly, cells harvested
Extraction:
Breaking membranes (lysis), using a blender or pestle and mortar
Key methods: Chelex, silica based
Detergents added to dissolve proteins to free the DNA
Goal is to maximise yield, while removing contaminants
Precipitation:
Sodium ions added to neutralise the negatively charged DNA, then alcohol added to precipitate the DNA, forming a solid
Purification:
DNA precipitate washed with alcohol to remove any impurities
Centrifugation to separate debris, the pellet, from the DNA, supernatant
Quantitation:
Determining concentration before the next step
Amplification and detection
Thermal Cycler - PCR machine
Genetic analyser - the capillary electrophoresis equipment
RFU - unit of measurement for peak height
Quality control protocols
Ensures the results are valid
Positive control - a known DNA sample to ensure PCR worked
Extraction negative - blank sample processed alongside evidence, checking for lab contamination
Forensic History - RFLP era and DQ-Alpha and Blue Dots
RFLP - restriction fragment length polymorphism
Visual output: autoradiograms, resembling a barcode
Much longer timescale - weeks, compared to days now
Early PCR methods:
DQ-Alpha: used test strips
Blue Dots: the specific visual marker
Quantitative Analysis - peak height ratios (PHR)
Checking for balance
Calculation: smaller peak/larger peak x 100
Standard: must be above ~ 60-70% to be ‘in balance’
Imbalance causes: mixture of two people, or stochastic effects (low DNA)
Forensic Workflow Overview
Evidence recovery and extraction
Quantification and Amplification
Capillary Electrophoresis (CE)
Data Analysis (EPG)
Artefacts meaning + types
= things that happen during testing that cannot be reproduced, are not reflective of the DNA that is associated with a sample
Biological artefacts - stutters:
Small peak positioned just before a large clear peak, signifying where a larger peak would appear
Occurs due to the DNA polymerase moving slightly forward and backward, causing a a PCR product which is slightly shorter than true fragment
Stutter filters used to remove stutters on the software
~ Stutter, imbalance, drop-in and dropout are all stochastic effects
Instrumental artefacts:
Spikes and blobs:
Peak on an EPG that is too tall and narrow relative to what we would expect to see for a peak in the range of all the other peaks
If peak is short and squat, it is an indication of a blob
Phadebas testing
Detection of saliva stains
Real time vs standard PCR
Real-time PCR aka quantitative PCR (qPCR) allows for the monitoring of amplification of a targeted DNA molecule during the PCR process.
It provides real-time data on the amount of DNA present in a sample as the reaction progresses. This method is ideal for quantifying DNA and detecting the presence of specific sequences.
Standard PCR, on the other hand, does not provide real-time monitoring of the DNA amplification process. Instead, the amplification is carried out for a set number of cycles, after which the products are analysed. Standard PCR is commonly used for DNA amplification in research, diagnostics, and forensics, but it is not suitable for real-time quantification of DNA.
Real-time PCR allows for the (1) quantification of DNA during the amplification process, while (2) standard PCR does not provide this real-time monitoring capability.