Intraoral, Panoramic, and CBCT Image Quality- Viewing 2D and 3D Images
1/18
There's no tags or description
Looks like no tags are added yet.
Name | Mastery | Learn | Test | Matching | Spaced | Call with Kai |
|---|
No analytics yet
Send a link to your students to track their progress
19 Terms
brightness and contrast
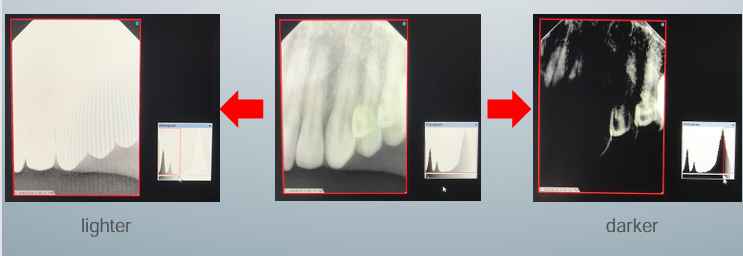
-digital radiographs do not always use the full range of available gray values effectively
-can be relatively dark or light, showing too much contrast in certain areas or not enough
-digital imaging software commonly includes tools for the adjustment of brightness and contrast
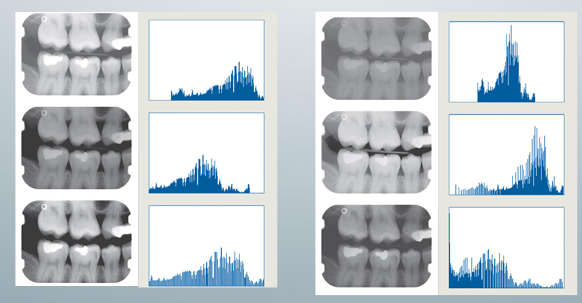
histogram stretch and slide
-although the brightness and contrast can be judged visually, the image histogram is a convenient tool to examine which of the available gray values the image uses
-open the image that you want to work on and click at arrow
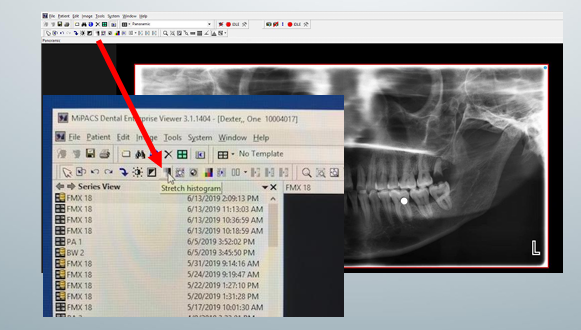
histogram stretch and slide step 2
-tool allows you to adjust the spectrum shown in the image
moving tool R/L
-move to the R: image changes darker because you use a smaller spectrum of color
-move to the L: image changes lighter
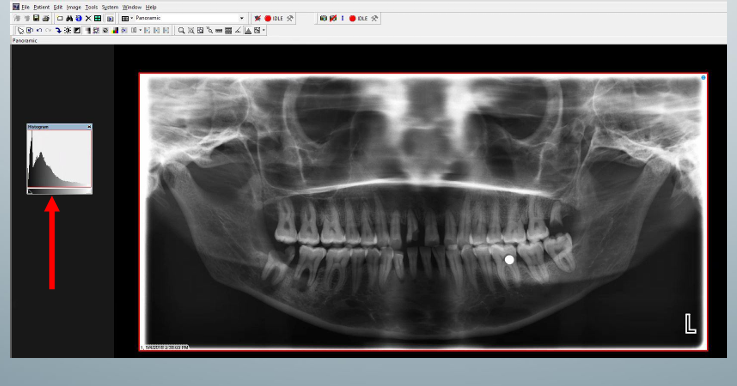
brightness and contrast
-2 ways to change brightness and contrast:
1) move mouse from R to L and up to down across the image to adjust parameters
2) using the box- can move small red circle in the box to adjust brightness and contrast
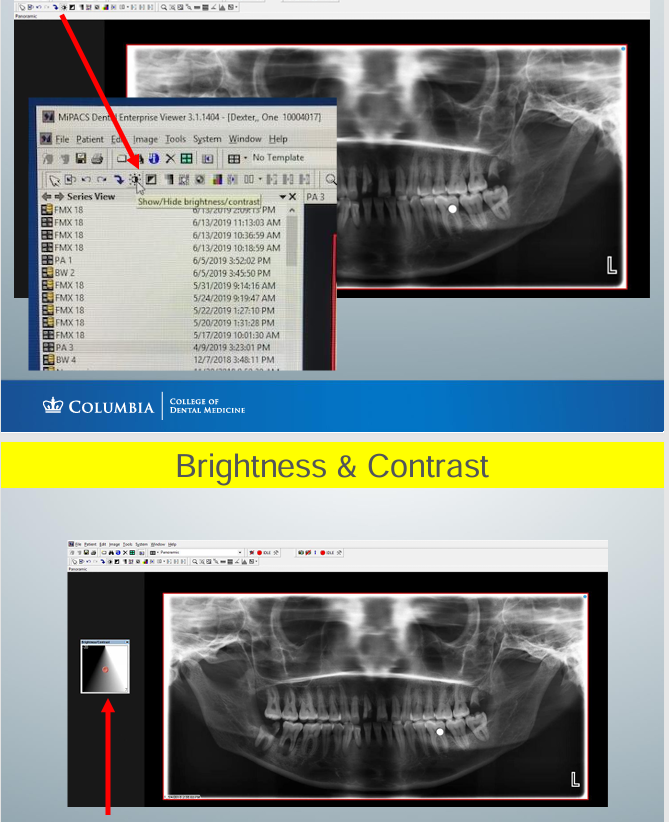
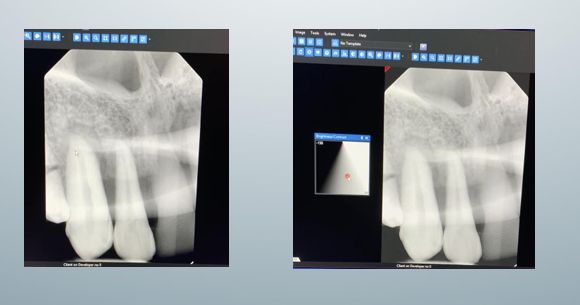
brightness and contrast box
-play with the box to see what would be changed
-move the mouse L and R to adjust brightness
-move mouse up and down to adjust contrast
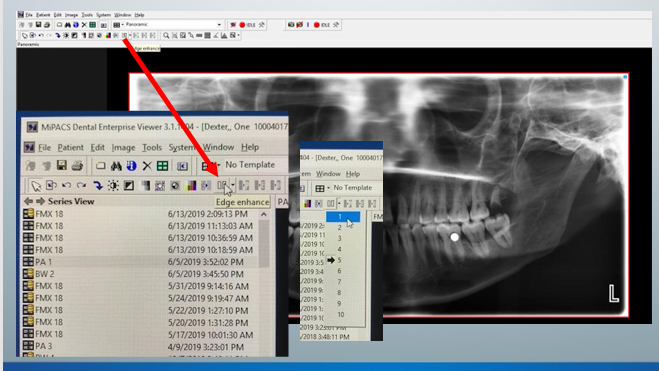
sharpen/edge enhance
-purpose is to improve image quality by removing blur or noise
-can change sharpness from 1 to 10
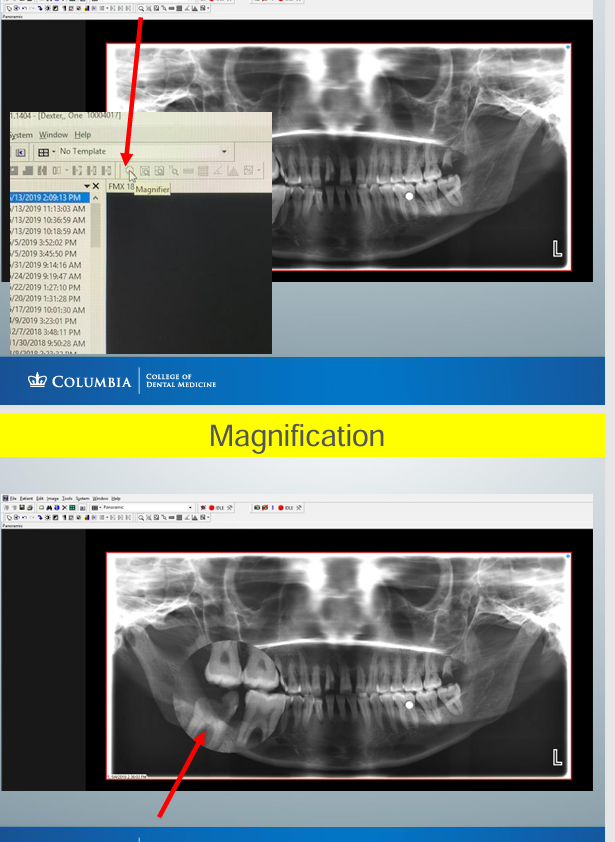
magnification
-place the magnifier on the image to zoom the area of interest with a left click
-do NOT save modification in MiPACS
-need to save the original images
remember the 3 elements that will give us a radiographic image of diagnostic quality
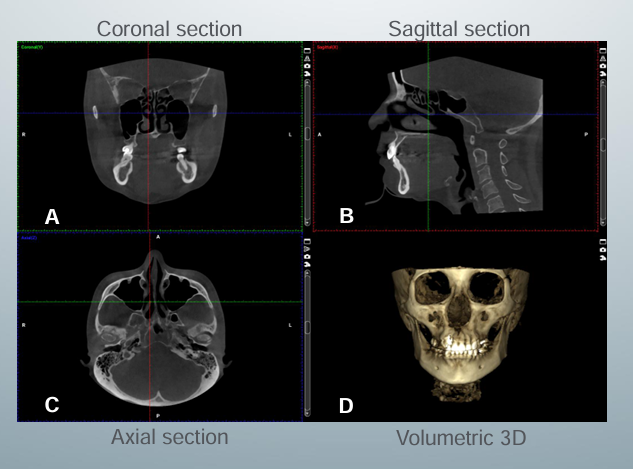
standard CT orthogonal views
CBCT format data
-3 basic format options: multiplanar reformation, ray sum, volumetric rendering
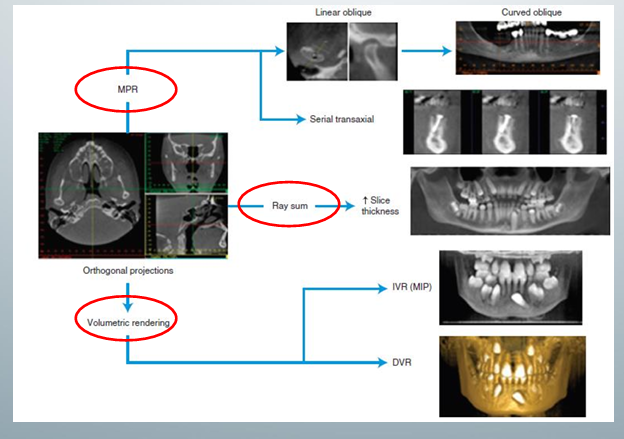
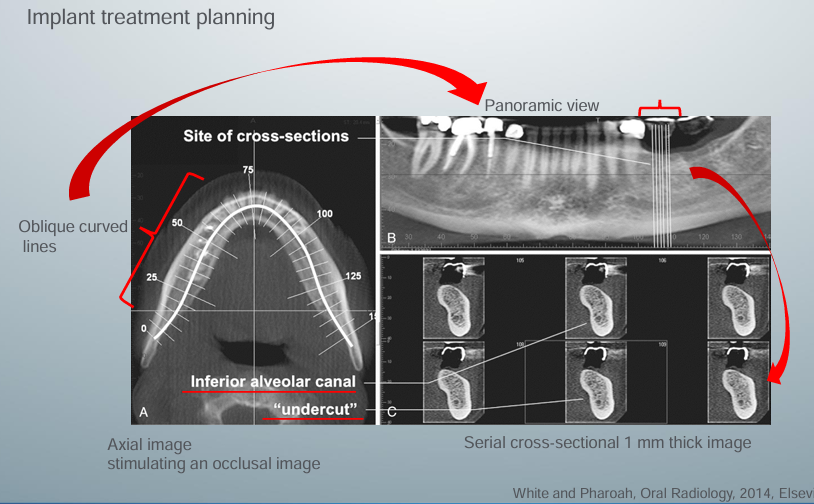
multiplanar reformation (MPR)
-axial and panoramic images are used as reference images to show the location of the cross-sectional images
-cross-sectional images demonstrate the amount of undercut and location of the inferior alveolar canal
-can draw a panoramic curve or be as creative as we like for the clinic scenario
-draw different planes in any direction through the site of interest & image quality is not degraded because of these isotropic voxels
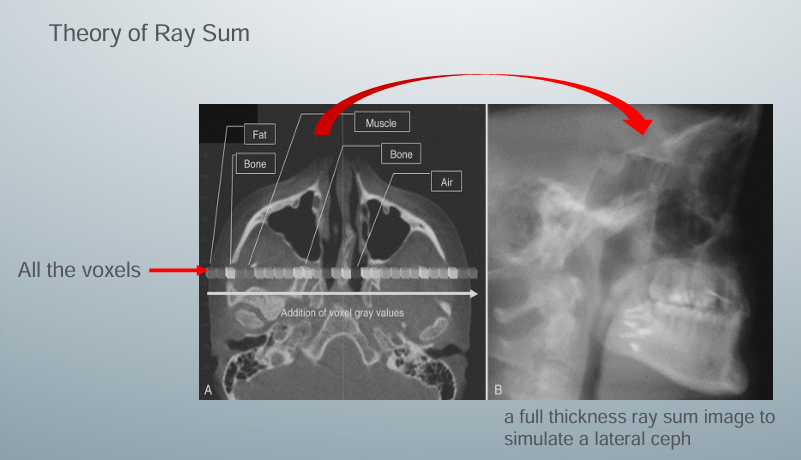
ray sum image
-not an actual 3D reconstruction
-get this image by finding a slice you like and pressing the ray sum function in the CBCT software
-software takes all the voxels within a selected thickness of the slice you like and adds them together (sums them) to give a thick slab of the image
-all the voxels represent air, bone, and soft tissues
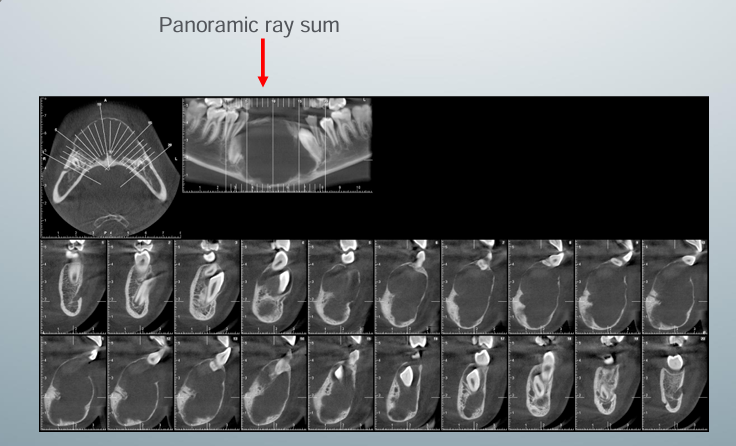
panoramic ray sum
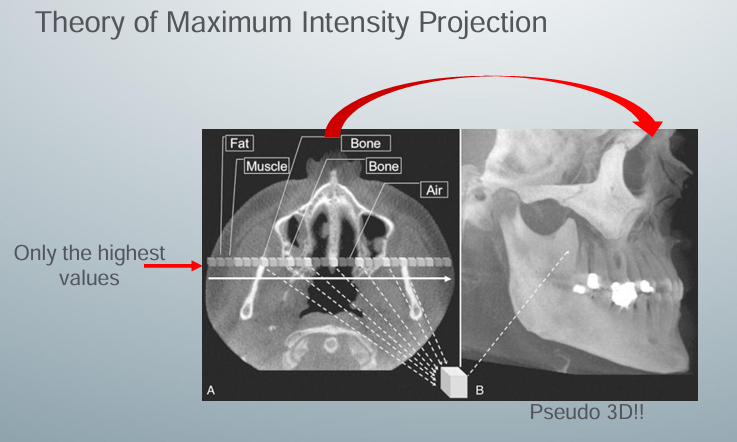
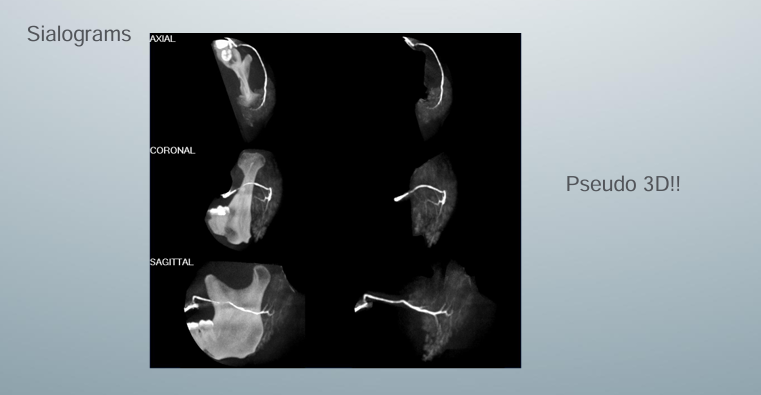
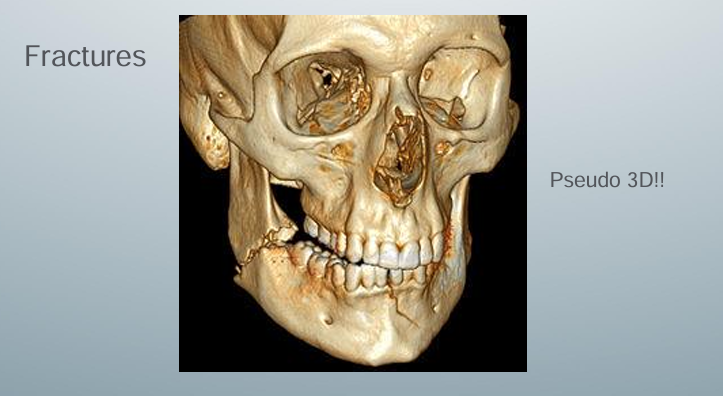
maximum intensity projection (MIP)
-method produces a “pseudo” 3D image by evaluating each voxel value along an imaginary projection ray from the observer’s eyes within the data set and then representing only the highest value as the display value
-projection ray identified throughout the entire volumetric data set, along which individual voxels are identified, each with varying grayscale intensity corresponding to various tissue densities
-MIP algorithm selects only those values along the projection ray with the highest values (usually corresponding to bone)
-represents only one pixel on the resultant image
MIP in practice
-not used often
MIP in practice- fracture
-might be helpful to visualize fractures prior to the surgery
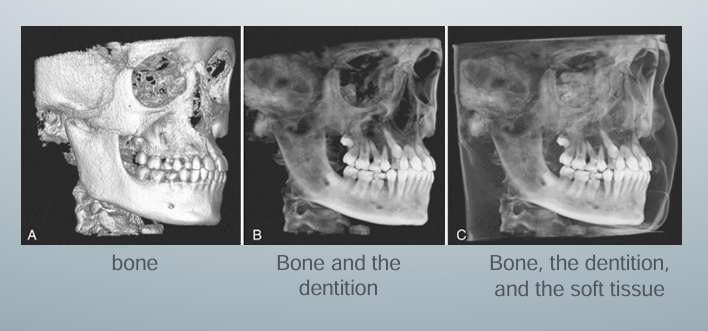
manual segmentation
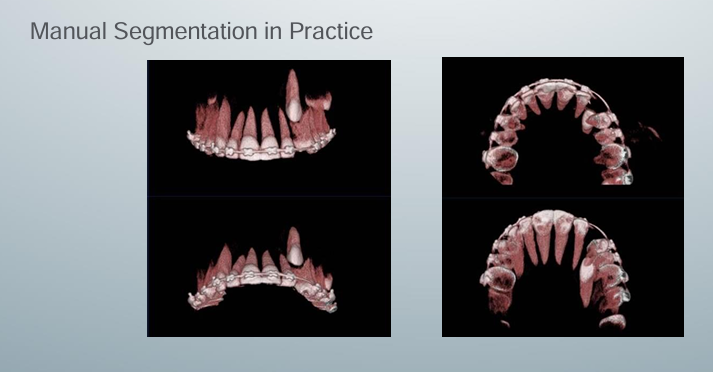
theory of manual segmentation
-often accomplished by an adjustable scale determining the upper and lower limits and range of intensity values to include in the segmentation
-visual result of changes in this scale is displayed in “real-time” to visualize the effects of incremental changes
-segmentation may be optimized to reveal the objects of interest including A) bone as a solid surface or shaded surface display, B) bone and the dentition under the bone as a transparency using volumetric imaging, C) bone, the dentition, and the soft tissue surface using volumetric imaging