Melitz (2003) model - firm heterogeneity
 Call Kai
 Learn
Learn Practice Test
 Spaced Repetition
 Match
Match Flashcards
 Knowt Play
1/37

There's no tags or description
Looks like no tags are added yet.
Name | Mastery | Learn | Test | Matching | Spaced | Call with Kai | Chat |
|---|
No analytics yet
Send a link to your students to track their progress
38 Terms
1990 firm level data revolution findings
Only a small fraction of firms export
Exporters sell most of their output domestically
Exporters are bigger than non-exporters
increasing RtS means larger firms can divide fixed costs over more units
Exporters are more productive than non-exporters
Increasing RtS + size leads to increased productivity
Trade liberalisation reduces a firm’s probability of surviving
pushing less productive firms out as competition increases
Trade costs fall
Trade liberalisation increases share of exporting firms
Surviving firms take up left over share from pushed out firms
More firms export as TC reduced → more productive firms select into the export market
Selection → trade liberalisation increases aggregate productivity as least productive firms ‘die’
K, L reallocated to surviving firms (less consensus)
Learning by exporting
Who exports
2002 US firm census
Under 35% of firms in an industry
Of exporting firms, only 10-20% of shipments are exports
How Melitz (2003) built on Krugman (1980)
Within-sector firm level heterogeneity
in size and productivity
Included fixed / sunk costs → leads to only most productive firms exporting
Kept Monopolistic competition framework
Preferences under Melitz
Constant elasticity of substitution (CES) over a continuum of varieties
ω ε (0, M)
Utility function
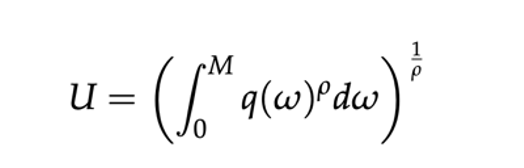
0 < ρ < 1 & σ = 1 / (1 - ρ) > 1
Technology function
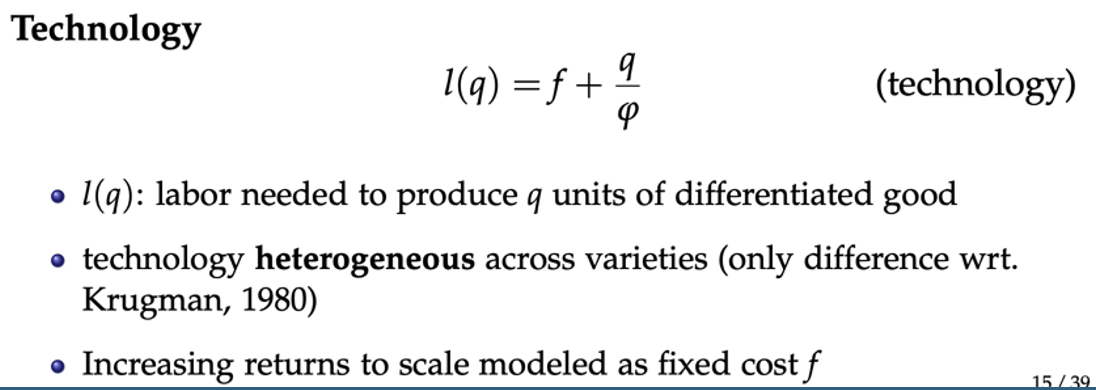
Each variety will now have a different productivity
Trade costs and extensive margin of export
As TC increase → reduces prob of firm entering X market
effect weaker for more productive firms
Low barriers to trade = more firms exporting
Household problem - Melitz (2003)
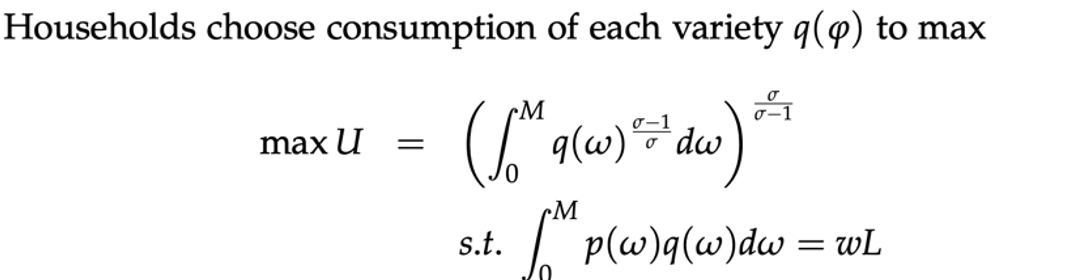
Household problem solved for variety
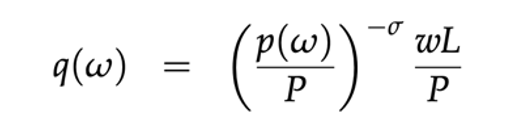
Price index function
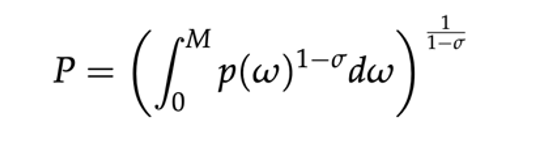
Firm problem - Melitz (2003)
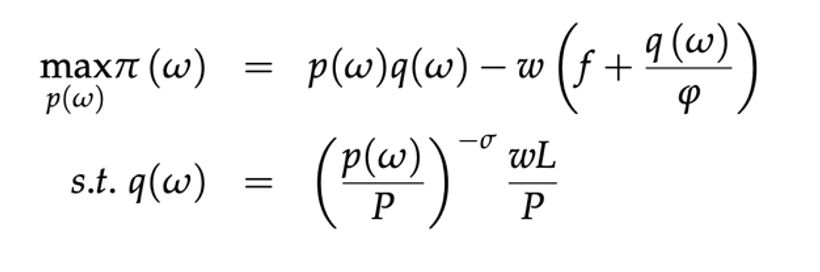
Firm problem - markup / optimal pricing
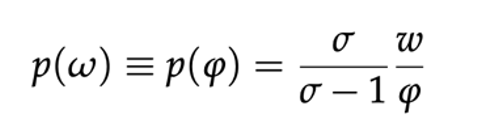
More productive firms can set lower prices
use w as the numeraire (set = 1)
L = 1 by assumption
Optimal profit function
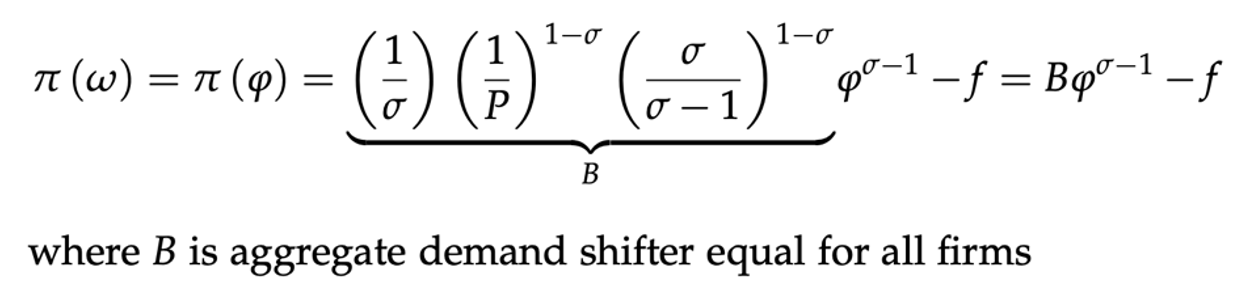
B is exogenous - depends on economy so B is the same for all firms
Mono C - each variety produced by 1 firm so can replace variety (ω) with productivity (φ)
Survival cutoff
firms pay a fixed cost of entry (fe)
to draw productivity from a given distribution and earn profits

If profits > 0 then firm produces, otherwise exit
Zero Profit Condition (ZPC)
φ* - minimum productivity firm that is indifferent between producing & exiting
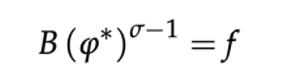
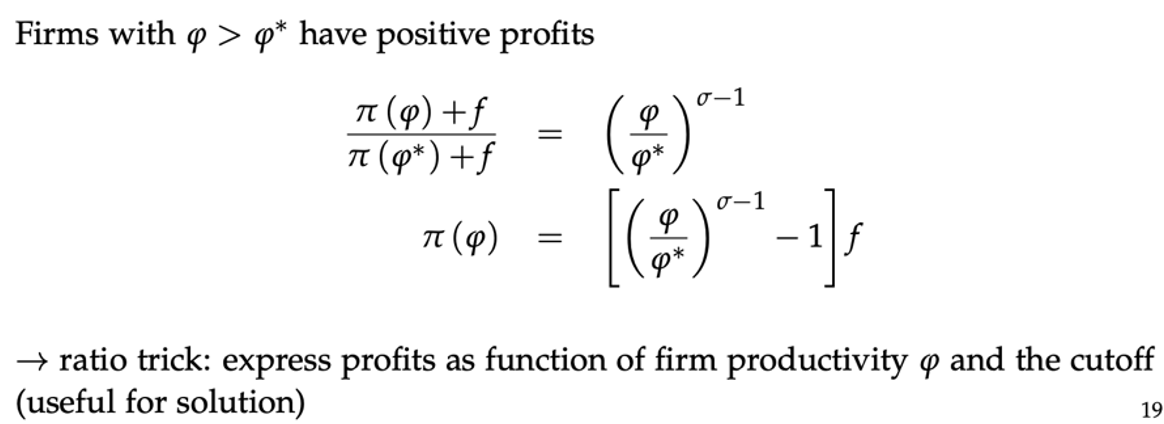
profits solution
Free entry (FE)
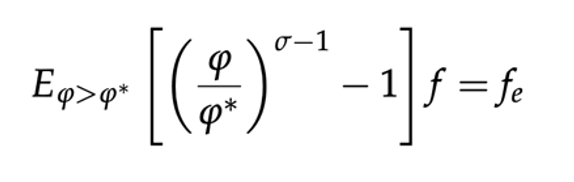
Firms enter up to point they expect to stop making profits
To find out firm type is costly but reveals their productivity
Firms know the distribution of productivities and so join based on expectations
Expected productivity drop (of paying Fixed C) > cutoff productivity OR cost of learning firm productivity -> join market
EQ in autarky - profits & productivity
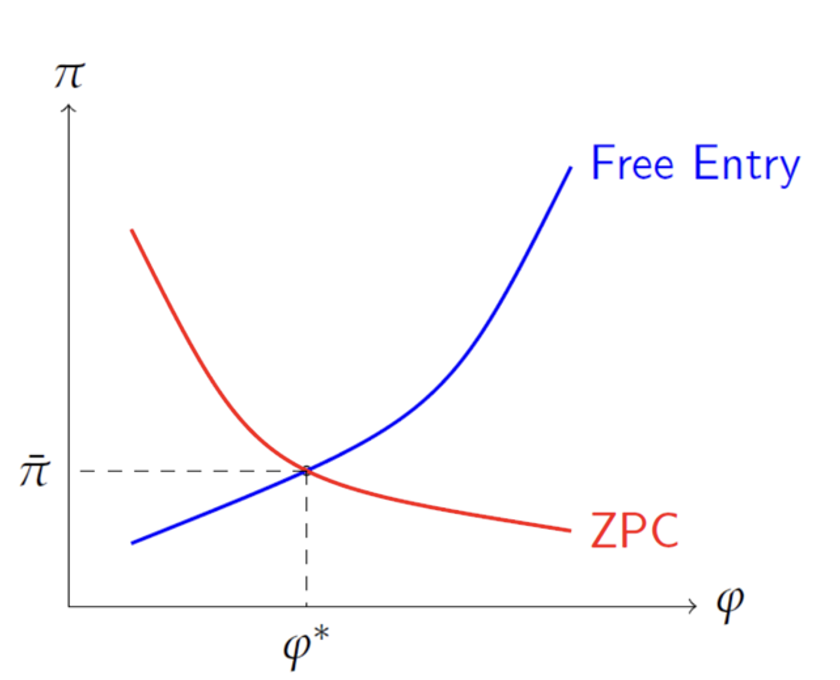
EQ in autarky - B & productivity
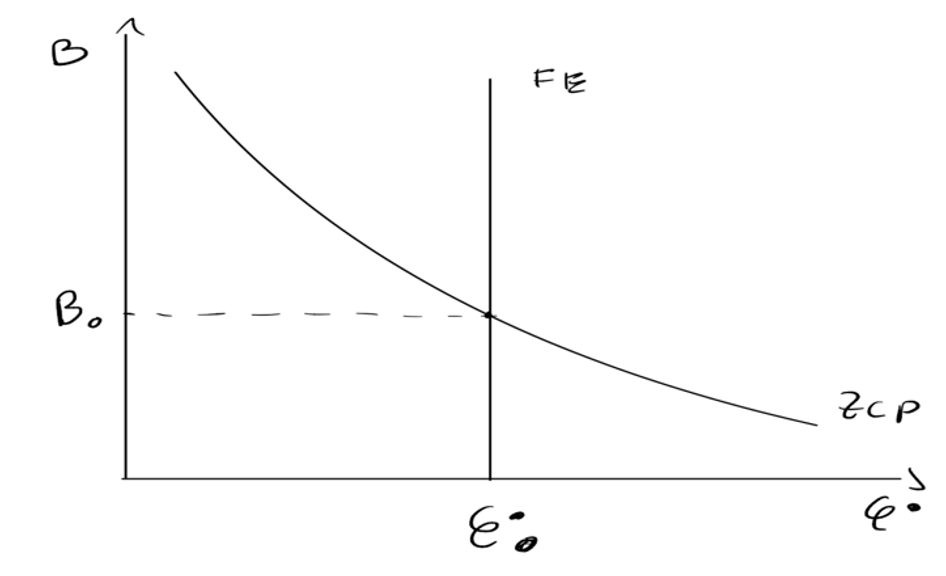
Selection in autarky
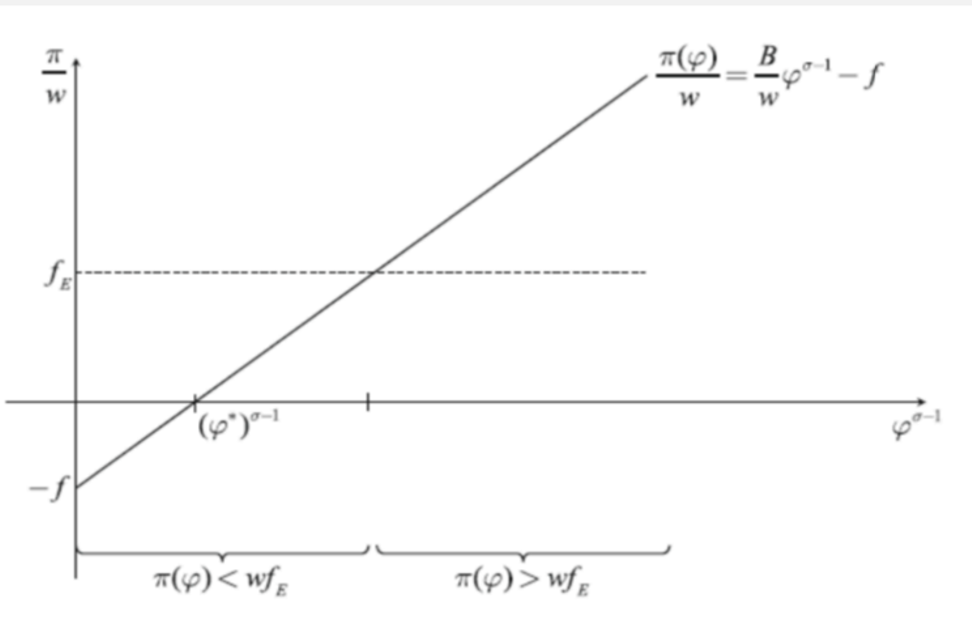
Firms only enter if expected profit > fE
Firms below φ* do not produce
w = 1 as numeraire but show for generality
Open to trade assumptions
2 identical countries
GFT from variety + selection
Fixed cost of exporting and dom sales
only most productive / largest can pay to export
Exporting has iceberg TC
Firm problem - trade
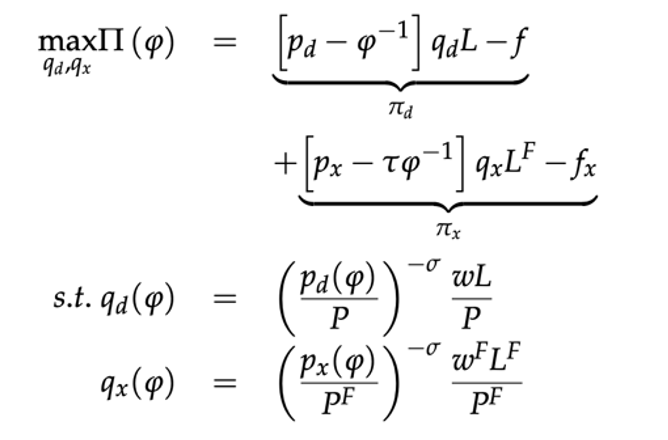
Symmetrical apart from iceberg cost
w = w* , B = B*, L = LF (=1), P = PF as symmetric countries
Solve dom & X markets separately
Firm problem solved for markup pricing - trade

Markup depends on elasticity of substitution
Cutoffs with trade
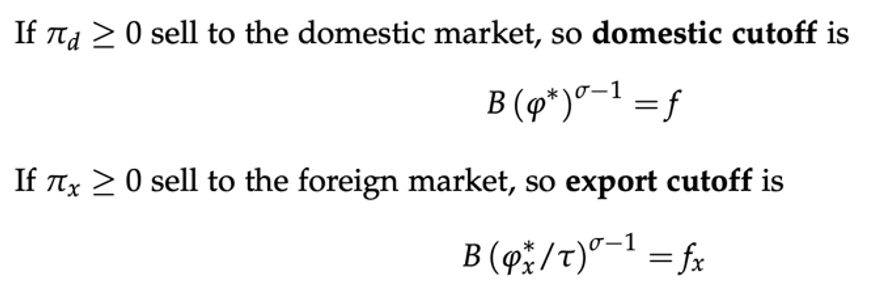
Cutoff ratio
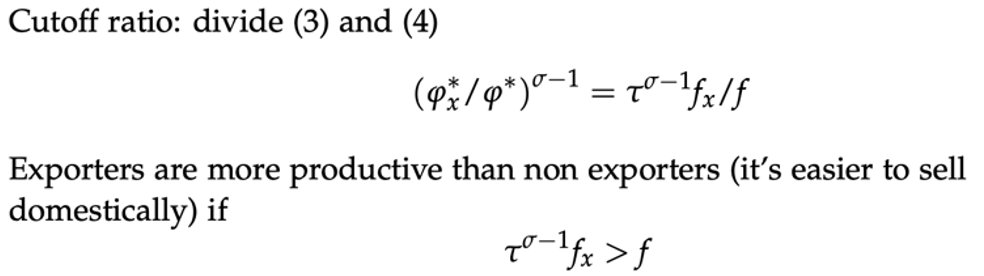
Selection in open economy
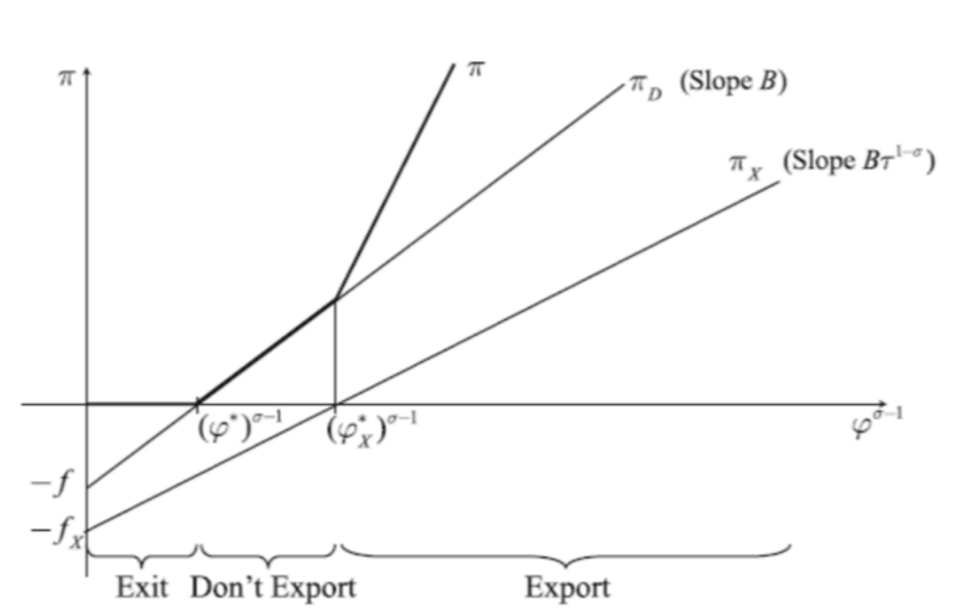
π = πD + πX
ZPC in open economy

Free entry with trade

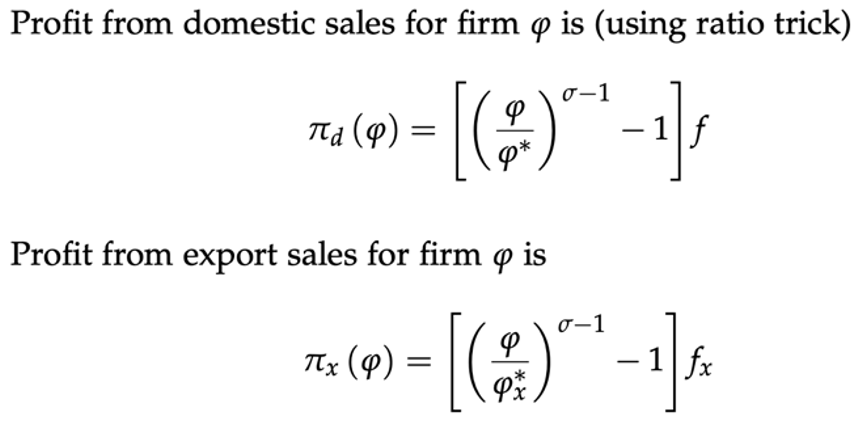
Profit in open economy
EQ in open economy - graph
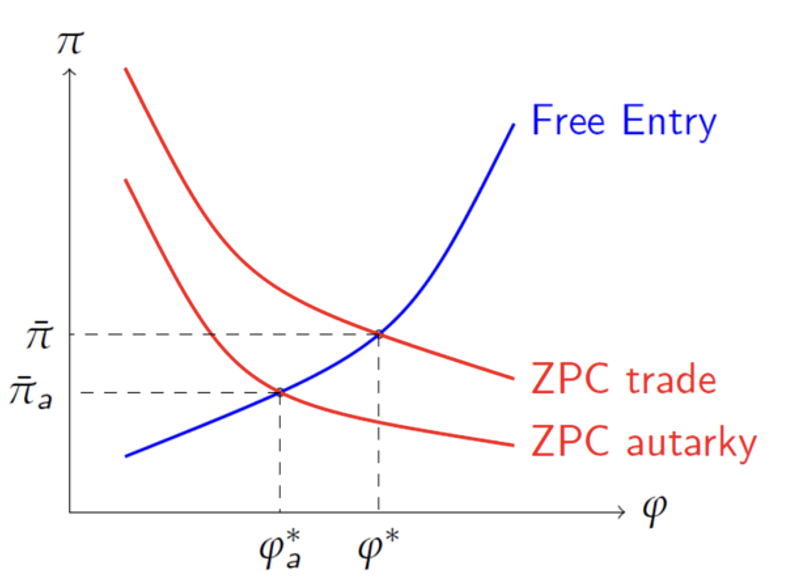
Cutoff shifts upward when opening up to free trade
leads to fewer but more productive firms
Trade liberalisation & cutoff ratio graph
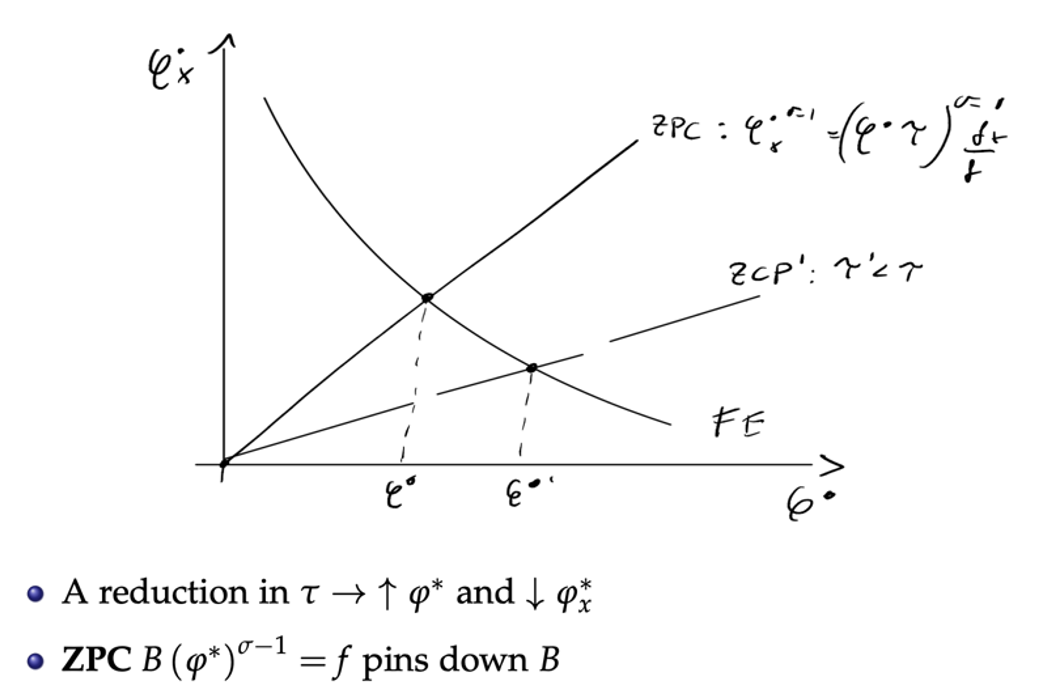
Conditional on surviving, TC fall makes X easier BUT dom cutoff higher
Trade lib & selection effects on productivity
Reduction in TC makes F firms more competitive
Dom market D falls so non-exporters lose market share
Least productive dom firms exit → Min dom productivity rises
Trade lib makes X cheaper
Most productive non-exporters start exporting
Min productivity to X falls
Raises industry avg productivity
Avg productivity at entry
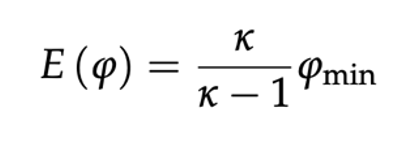
Pareto distribution with k > 1
low k = few very productive firms and many small low productivity firms
High k means productivity more evenly distributed
Welfare and Price index
Welfare is proportional to price index (P)
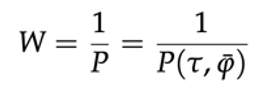
P is a negative function of avg productivity

Increasing avg productivity generates new GFT - selection
Price index, Demand and trade
Dom market D changes when opening to trade: B → BA
B < BA
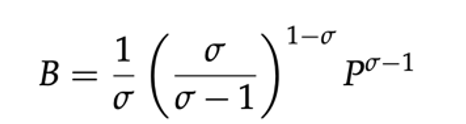
Due to GFT, P must be lower under trade
Therefore profit (trade vs autarky) curves must intersect
Winners and losers - graph
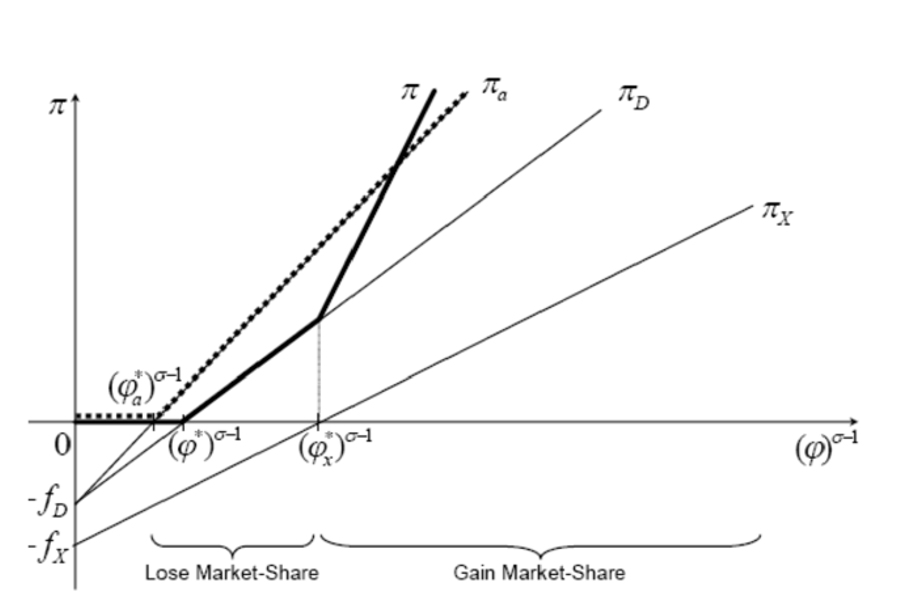
Winners and losers from trade
Compared to autarky
All non-exporters lose profits → some lose all and exit
Least productive exporters lose profits & Only most productive exporters gain
Since productivity distribution highly skewed, there are only few firms at the top → gains highly concentrated
Unequal gains
All Consumers gain - trade leads to lower P + love for variety
Small firm owners / entrepreneurs lose → may shut down
A few large firm owners gain → concentrates market share / profits even more
Extending model to account for unemployment
Allowing for unemployment shows workers in ‘losing firms’ either lose their jobs or have to take a pay cut
Even though unemployment may be reduced, workers still worse off in smaller firms FROM TRADE