Inflation (2)
 Call Kai
 Learn
Learn Practice Test
 Spaced Repetition
 Match
Match Flashcards
 Knowt Play
1/15

There's no tags or description
Looks like no tags are added yet.
Name | Mastery | Learn | Test | Matching | Spaced | Call with Kai |
|---|
No analytics yet
Send a link to your students to track their progress
16 Terms
What is inflation ?
Inflation is the sustained increase in the average price level of goods/services in an economy
The average price level is measured by checking the prices of a 'basket' of goods/services that an average household will purchase each month
This basket of goods is turned into an index and it is called the consumer price index (CPI)
The UK has an inflation target of CPI at 2% per annum
Low inflation is better than no inflation, as it is a sign of economic growth
What is deflation ?
Deflation occurs when there is a fall in the average price level of goods/services in an economy
Deflation only occurs when the percentage change in pricesfalls below zero %
What is disinflation ?
Disinflation occurs when the average price level is still rising, but at a lower rate than before
These figures demonstrate disinflation: Y1 = 5% Y2 = 4% Y3 = 2%
Inflation is increasing but at a decreasing rate
Calculating inflation using the Consumer Price Index (CPI)
Inflation is the sustained increase in the average price level of goods/services in an economy
The inflation rate is the change in average price levels in a given time period
The inflation rate is calculated using an index with 100 as the base year
If the index is 100 in year 1 and 107 in year 2, then the inflation rate is 7%
What two inflation indices does the UK use ?
The consumer price index (CPI)and the retail price index (RPI)
Each is calculated slightly differently
The Consumer Price Index (CPI)
A 'household basket' of 700 goods/services that an average familywould purchase is compiled on an annual basis
A household expenditure survey is conducted to determine what goes into the basket
Each year, some goods/services exit the basket and new ones are added
Goods/services in the basket are weighted based on the proportion of household spending
E.g. More money is spent on food than shoes, so shoes have a lower weight in the basket
Each month, prices for these goods/services are gathered from 150 locations across the UK
These prices are averaged out
The price x the weighting determines the final value of the good/service in the basket
These final values are added together to determine the price of the 'basket'
CPI = Cost of basket in year x / Cost of basket in base year → x100
The percentage difference in CPI between the two years is the inflation rate for the period
Limitations of using the CPI
The CPI provides a level of inflation for the average basket and the basket of many households is not the average basket
Depending on what households buy, the level of inflation for each one can vary significantly
As an average, it also ignores regional differences in inflation, e.g. London inflation may be much higher than Harrogate inflation
The CPI is one of several methods used by countries in determining inflation; another is the retail price index (RPI)
This can make comparisons between countries less meaningful, as one may use the RPI and another the CPI
The CPI does not capture the quality of the products in the basket
Product quality changes over time, so the comparison with different time periods is less useful
The CPI only measures changes in consumption on an annual basis
Changes in consumption can occur more frequently and theindex is always behind these changes
The CPI is prone to errors in data collection
It is based on a survey that goes to thousands of households each year, yet it is still a small sample
The respondents have no incentive to fill in the survey carefully and accurately
The Retail Prices Index (RPI)
The retail price index (RPI) is calculated in exactly the same way as the CPI
Certain goods/services that are excluded from the CPI are included with the RPI
These include council tax, mortgage interest payments, house depreciation, and other house purchasing costssuch as estate agents fees
Due to the extra inclusions, inflation measured using the RPI is usually higher than the CPI
This is mainly due to its sensitivity to interest rate changes,which affect mortgage interest
It's argued that the RPI is a more accurate indication of household inflation
The Causes of Inflation
An increase in the average prices in an economy can be caused by demand-pull inflation, cost-push inflation, an increase in the money supply, and an increase in wages
Demand - pull inflation
Demand-pull inflation is caused by excess demand in the economy
Aggregate demand (AD) is the sum of all expenditure in the economy
AD = Consumption (C) + Investment (I) + Government spending (G) + Net Exports (X-M)
Short-run aggregate supply (SRAS) is the total supply provided in the economy at a given average price level
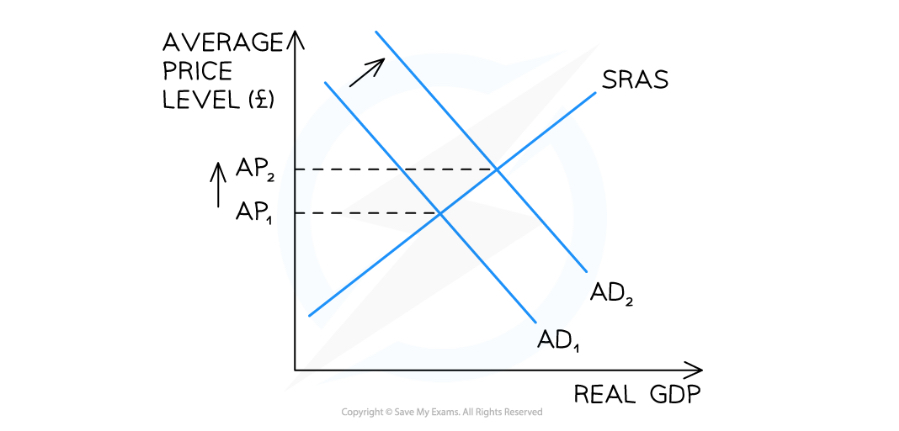
A diagram that shows how an increase in aggregate demand raises the average price level in an economy - Diagram Analysis
If any of the four components of AD increase, there will be a shift to the right of the AD curve from AD1 → AD2
At the original price (AP1), there is now a condition of excess demand in the economy
As prices rise, there is a contraction of AD and an extension of SRAS
Prices for goods and services are bid up from AP1 → AP2
Demand pull inflation has occurred
Cost - push Inflation
Cost push inflation is caused by increases in the costs of production in an economy
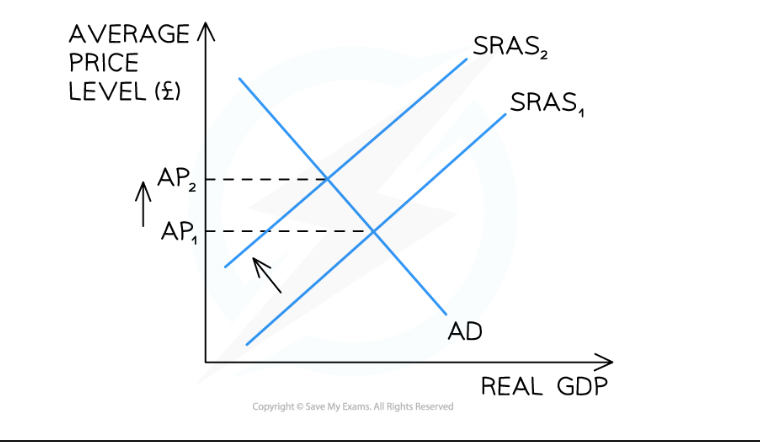
A diagram that shows how an increase in the costs of production raises the average price level in an economy - Diagram Analysis
If any of the costs of production increase (wages, raw materials, etc.), there will be a shift to the left of the SRAS curve from SRAS1→SRAS2
At the original price (AP1), there is now a condition of excess demand in the economy
As prices rise, there is a contraction of AD and an extension of SRAS
Prices for goods/services are bid up from AP1→AP2
Cost-push inflation has occurred
Changes to the money supply
If the Central Bank lowers the base rate, there is likely to be increased borrowing by firms and consumers
This will result in an increase in consumption and investment
It is likely to lead to a form of demand-pull inflation
The Central Bank can also increase the money supply through quantitative easing - (Occurs when the Central Bank purchases securities (bonds) on the open market so as to increase the money supply)
This will result in increased liquidity and lower interest rates
It is likely to lead to a form of demand-pull inflation
Changes to Wages
Increased aggregate demand in an economy causes demand pull inflation
Workers now feel less well off as their wages no longer have the same purchasing power
Workers may demand wage increases to compensate for the higher prices
Those wage increases are now a form of cost-push inflation (increased costs of production) and drive prices even higher
This economic phenomenon is called the wage-price spiral
The impact of inflation on different stakeholders
Firms | Consumers | Government | Workers |
|---|---|---|---|
|
|
|
|