Acquiring and interpreting lab data
1/39
There's no tags or description
Looks like no tags are added yet.
Name | Mastery | Learn | Test | Matching | Spaced | Call with Kai |
|---|
No analytics yet
Send a link to your students to track their progress
40 Terms
Non-biological pre-analytical factors
Right patient, right test
Patient and sample identification
Appropriate test
Sample types (e.g. urine, faeces, saliva, CSF, blood - serum or plasma)
Right sample handling
Biological pre-analytical factors
Fluctuation of analytes around a set point due to natural factors.
Can be within or between subjects.
Can be modifiable (e.g. fasted / non-fasted) or non-modifiable (e.g. age)
Within individual:
Diet - creatinine, lipids, glucose, iron (fasted / non-fasted)
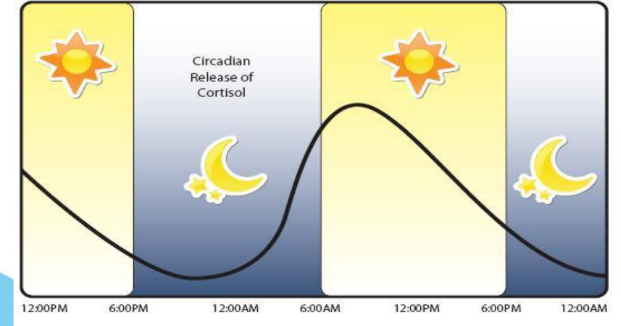
Time of day: several plasma constituents show diurnal variation, or a sleep/wake cycle e.g. cortisol.
Timing e.g. relative to menstrual cycle or antibiotic dose.
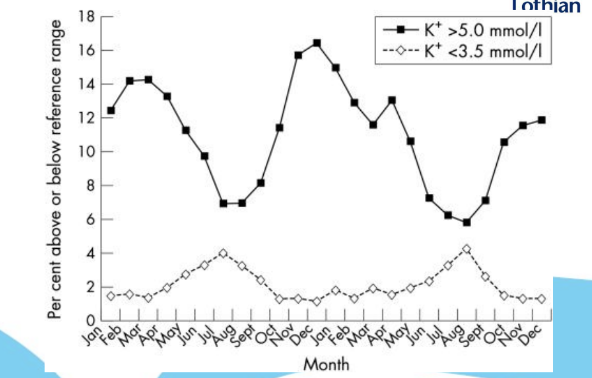
Timing e.g. seasonal variations in vitamin D and potassium.
Medication: prescribed, over the counter and online.
Diurnal release of cortisol
Low morning cortisol can be adrenal insufficiency - or a messed up sleep cycle.
Seasonal variation in potassium
High in winter, low in summer.
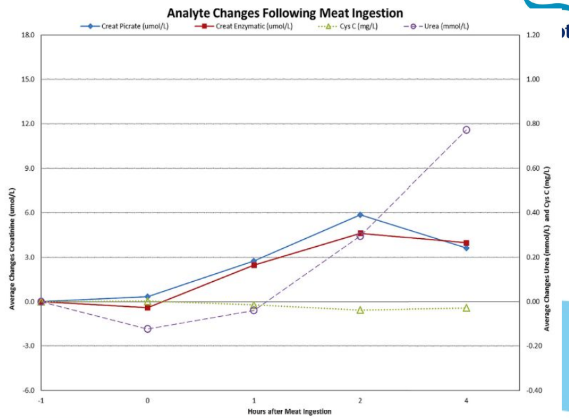
Creatinine before and after meat ingestion
Creatinine increases after red meat ingestion.
What differences can age cause in between individual biological pre-analytical factors?
ALP
Creatinine
Gonadotropins
Sex hormones
What differences can sex cause in between individual biological pre-analytical factors?
Creatinine
Iron
Gonadotropins
Tumour markers
What differences can ethnicity cause in between individual biological pre-analytical factors?
Some analytes (vitamin D, cholesterol, and CK)
May be difficult to distinguish factors and alterations in metabolism from environmental factors.
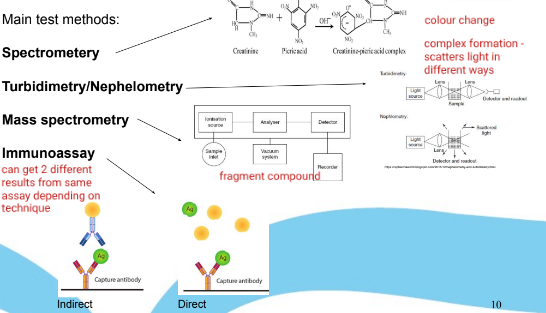
Main analytical lab methods
Spectrometry (complex formation changes what frequencies of light are absorbed)
Turbidity / nephelometry (complex formation changes how light is scattered)
Mass spectrometry (breaking compound into fragments for analysis)
Immunoassay (antibodies capture the target if present): direct and indirect
How is analytical variation in test results accounted for?
Estimation of variability through quality control protocols, which establish goals for performance, precision, limit of detection, limit of quantification. They are important for comparing successive patient results, assessing the clinical utility of test results, and determining the utility of reference ranges.
Types of quality control protocols
Internal quality control (IQC) - in real time within lab.
External quality assurance (EQA) - retrospective, between labs.
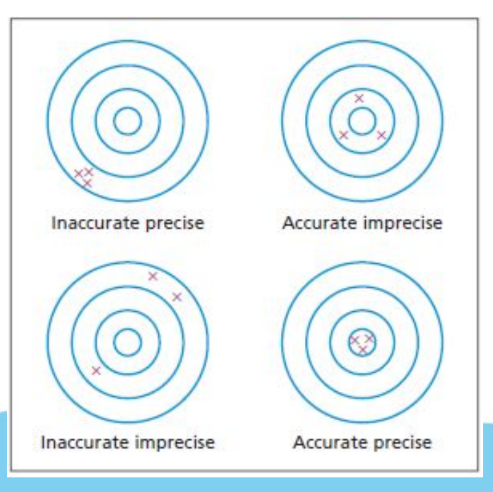
Precision of test results
How reproducible is a result (measured by SD, coefficient of variation). Affected by random error.

Accuracy
How near to the true value is the result. Affected by systematic error (bias)
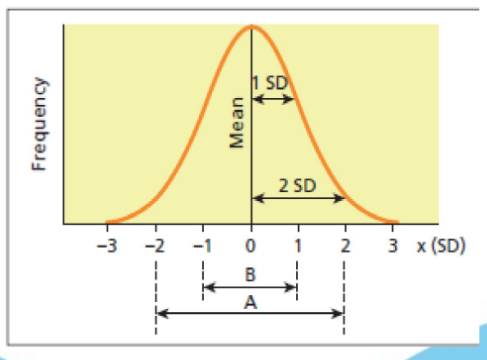
Reference range
Tells us whether lab test results are normal or not. This will be 95% of the results (2 SDs around the mean) that healthy people would obtain - meaning 5% of healthy people’s results will fall outside of the reference range. (A = reference range in diagram). This only works for normally distributed lab results.
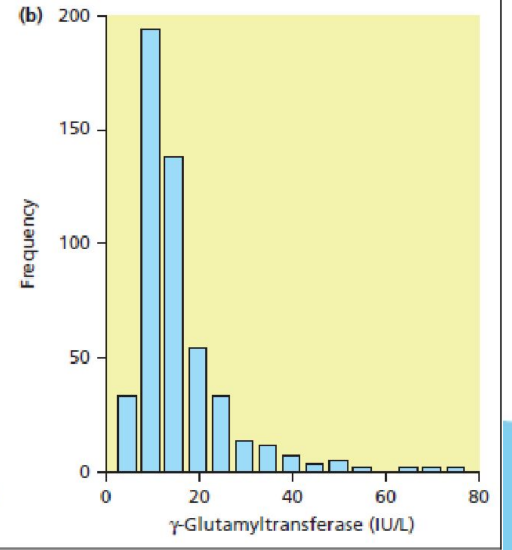
How are reference ranges calculated if the lab results are not normally distributed?
Centiles
Critical limits
Critical limits of laboratory results need urgent notification to the clinician because they are an indicator of a critical or even life-threatening condition. They are usually quite far outside of the reference range.
Age specific reference ranges
These are becoming increasingly common as frequently age significantly alters the reference ranges for certain lab results (e.g. lowered reference ranges for Na in elderly patients)
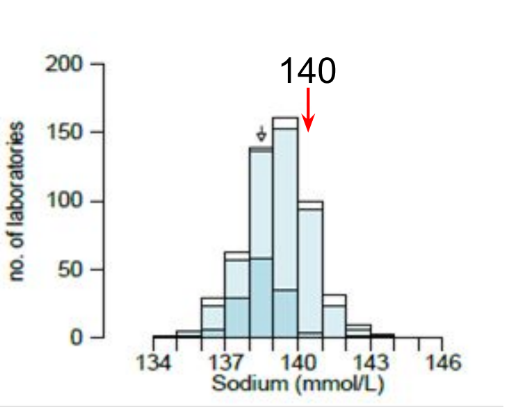
How reproducible are lab results between labs?
This graph shows EQA results of sodium lab results. There is not much variation between labs, with most clustered around the correct value. However, there are also outliers - 1-2 mmol/L is usually considered acceptable while values outwith this range are not.
Sensitivity
Can the diagnostic test accurately identify patients with the disease? (True positives). Sensitivity = TP / (TP + FN) x 100.
Specificity
Can the diagnostic test accurately identify patients without the disease? (True negatives). Sensitivity = TN / (TN + FP) x 100.
How are diagnostic tests assessed?
Via specificity, sensitivity, PPV, and NPV.
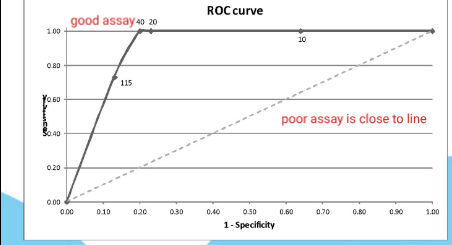
Receiver Operating Characteristic (ROC) curve
Plot sensitivity vs PPV for different thresholds. Are under the curve helps to determine cut-offs.
Which reflects the reality of clinical practice more: Sensitivity and specificity OR PPV and NPV
PPV and NPV - as the disease status is unknown, they can provide information about how likely a disease is to be present or not in the presence of a +ve / -ve test result.
Prevalence
Percentage of population with the condition (at a specific time).
What do PPV and NPV depend on?
Prevalence - higher prevalence leads to more accurate values.
Positive Predictive Value (PPV)
The likelihood that a person with a positive test result actually has the condition. PPV = TP / Total of +ve tests
Negative Predictive Value (NPV)
The likelihood that a person with a negative test result does not actually have the condition. NPV = TN / Total of -ve tests.
If there are two tests for a disease is combination testing a good idea? How should this be carried out?
When doing combination testing, parallel testing (testing at the same time) maximises sensitivity, but series testing maximises specificity and PPV (less false positives and more likely to mean disease is present with a positive results). The series order does not affect PPV but it does affect the number of 2nd line analysis. The higher specificity test should be first to reduce the total number of tests (and reduce over-investigation).
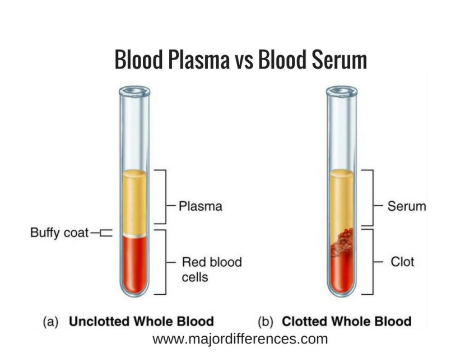
Blood serum
Whole blood minus clotting factors (centrifuged after clotting).

Blood plasma
Blood sample treated with anticoagulants to prevent clotting (then centrifuged).
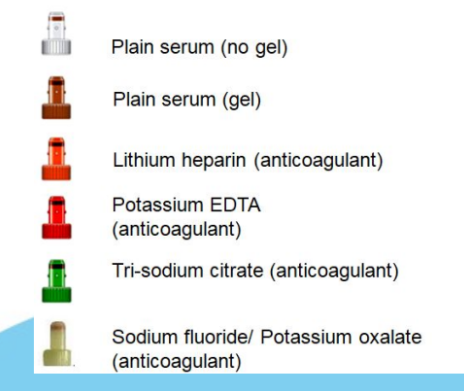
Blood sample bottle colours
Artefacts definition
Artificial and foreign substances present in lab samples - errors introduced through mishandling, malfunctions and technical processes.
Common preanalytical artefacts
Blood from vein above IV infusion of potassium in dextrose solution.
Blood sample placed in K-EDTA preservative.
Sample stored overnight prior to cell separation.
Why can placing a blood sample in K-EDTA preservative lead to errors?
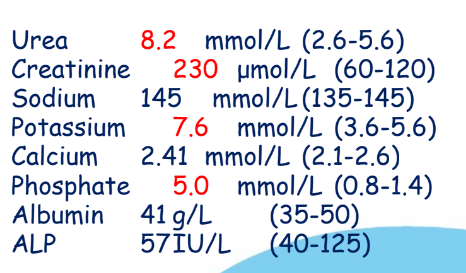
The EDTA acid binds to Ca and Mg meaning they appear falsely low , falsely elevated K (from K-EDTA), and falsely low ALP (relies on Mg). Can have different levels of contamination (e.g. wrong tube, pouring of sample, order of draw).
How can a sample being stored overnight prior to cell separation lead to errors?
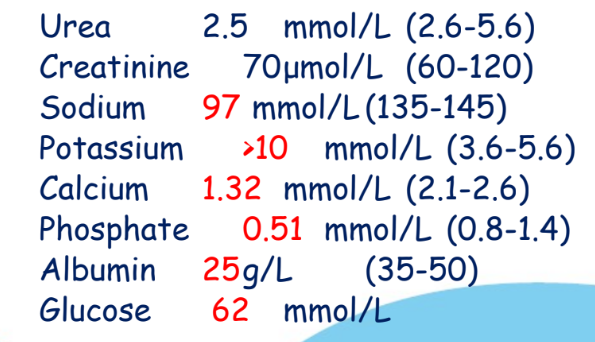
The cold + delay leads to a failure of the Na+/K+ ATPase. Na then moves into cells and K moves out, leading to falsely elevated K and P levels.
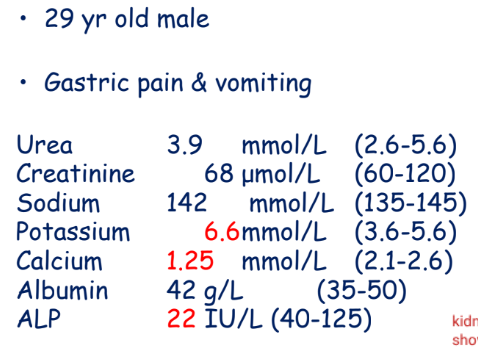
All other biochemistry is normal - what has caused the blood results to look like this?
K-EDTA contamination.
What has caused these blood results?
Sample was stored in fridge overnight prior to separation. (urea and creatinine is also elevated because blood cells degrade)
What has caused these blood results?
Blood was taken from the vein above IV infusion of K+ in dextrose (elevated glucose and K+ while everything else is diluted).
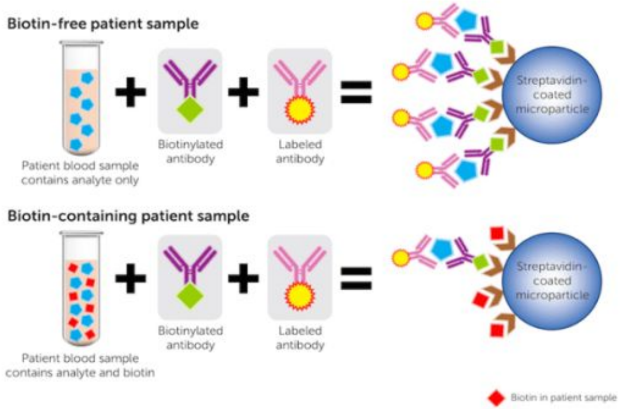
Biotin and immunoassays
Many immunoassays use streptavidin to capture biotinylated antibodies for detection (eg. troponin marker for myocardial infarction). But biotin supplements can cause interference in assays, leading to falsely low results.
Post-analytical factors
Post analytical data entry error
Misinterpretation of results
Oral miscommunication of results
Turn around times
Clinician or other provider fails to retrieve test result
Failure to communicate critical value
Provider misinterprets lab result