Chapter 9: Measuring Campaign Effectiveness
1/61
There's no tags or description
Looks like no tags are added yet.
Name | Mastery | Learn | Test | Matching | Spaced | Call with Kai |
|---|
No analytics yet
Send a link to your students to track their progress
62 Terms
1. Big idea of Chapter 9
Chapter 9 is about how marketers measure whether marketing communication actually worked.
The key idea is:
Campaign evaluation should not only judge whether a campaign was creative, but whether it achieved its communication and marketing objectives.
A campaign can be funny, beautiful, emotional, or memorable but still fail if it does not improve awareness, attitude, purchase intention, behaviour, sales, or loyalty.
The chapter also stresses that measuring effectiveness is difficult because sales and market share are influenced by many things besides communication, such as:
price,
distribution,
competitor actions,
product quality,
seasonality,
economic conditions,
promotions,
brand history.
So, campaign evaluation often uses intermediate effects, such as awareness, recall, recognition, attitude, intention, website behaviour, social media engagement, or activation.
2. Advertising effectiveness research
The chapter explains three broad types of advertising effectiveness research:
1. Pre-testing
Testing advertising before it appears in the media.
Purpose:
choose the best creative idea,
improve the ad before launch,
detect weaknesses early,
check if the message is understood,
assess whether the ad fits objectives.
2. Post-testing
Testing a specific ad after it has appeared in the media.
Purpose:
measure whether people noticed it,
measure recall or recognition,
measure brand attribution,
assess attitudes,
assess behavioural responses.
3. Campaign evaluation research
Evaluating the whole campaign, not just one ad.
Purpose:
compare campaign results with objectives,
assess changes in awareness, image, attitude, sales, market share, loyalty, etc.,
understand whether the campaign contributed to outcomes.
Exam sentence:
Advertising effectiveness research includes pre-testing before exposure, post-testing after exposure, and campaign evaluation research that assesses whether the full campaign achieved its objectives.
3. Pre-testing of advertising
Pre-testing means testing an ad before it is launched.
The purpose is to maximise effectiveness and avoid wasting money on weak advertising.
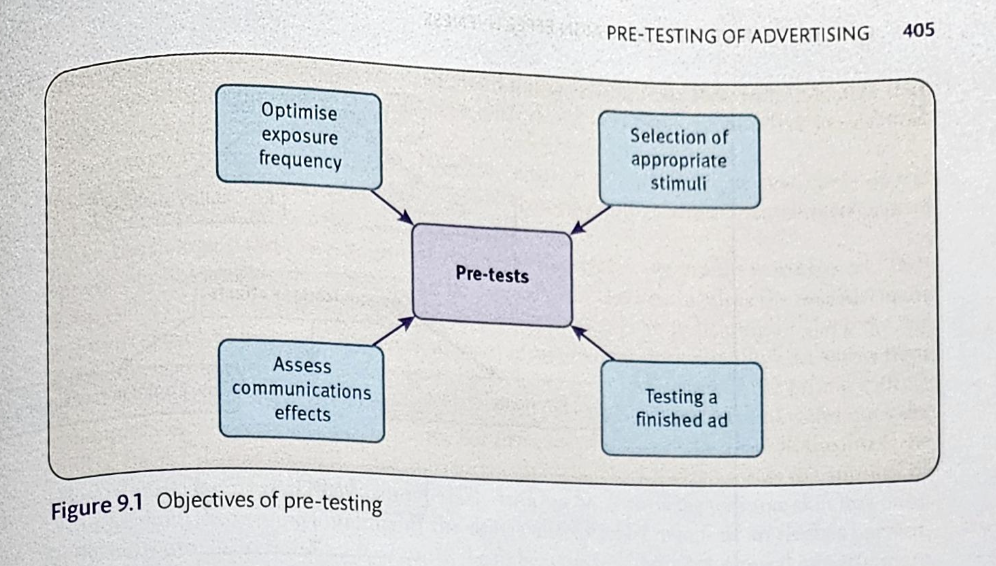
According to the figure on page 405, pre-testing can help with four things:
Optimise exposure frequency
Select appropriate stimuli
Test a finished ad
Assess communication effects
Why pre-testing matters
Pre-testing can check whether the ad:
attracts attention,
communicates the intended message,
is understood,
creates the desired emotions,
improves brand attitude,
fits the brand,
motivates consumers,
is persuasive,
avoids confusion or irritation.
When pre-testing happens
Pre-testing can happen at different stages:
Early concept stage
Testing rough ideas, storyboards, scripts, or animatics.
Finished execution stage
Testing a completed ad before placing it in media.
Exam sentence
Pre-testing evaluates advertising before media placement in order to improve creative execution, check communication effects, and avoid launching ineffective ads.
4. Pre-testing techniques
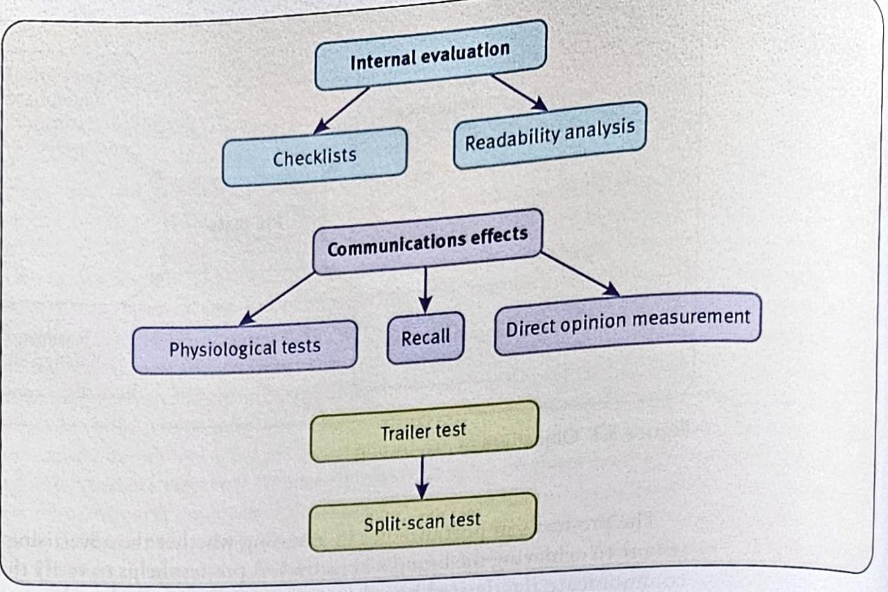
The figure on page 406 groups pre-testing techniques into several types.
1.
Internal evaluation
This is done inside the company or agency.
Examples:
checklist,
readability analysis.
Readability analysis
Readability analysis checks whether the text is easy to understand.
2. Communication effects tests
These measure how consumers respond to the ad.
Examples:
physiological tests,
recall,
direct opinion measurement.
3. Trailer tests
Consumers are exposed to ads in a more realistic setting, such as before a film or programme.
4. Split-scan tests
Different ads are shown to different groups, often in a controlled media setting, to compare effectiveness.
5. Internal evaluation: checklists and readability
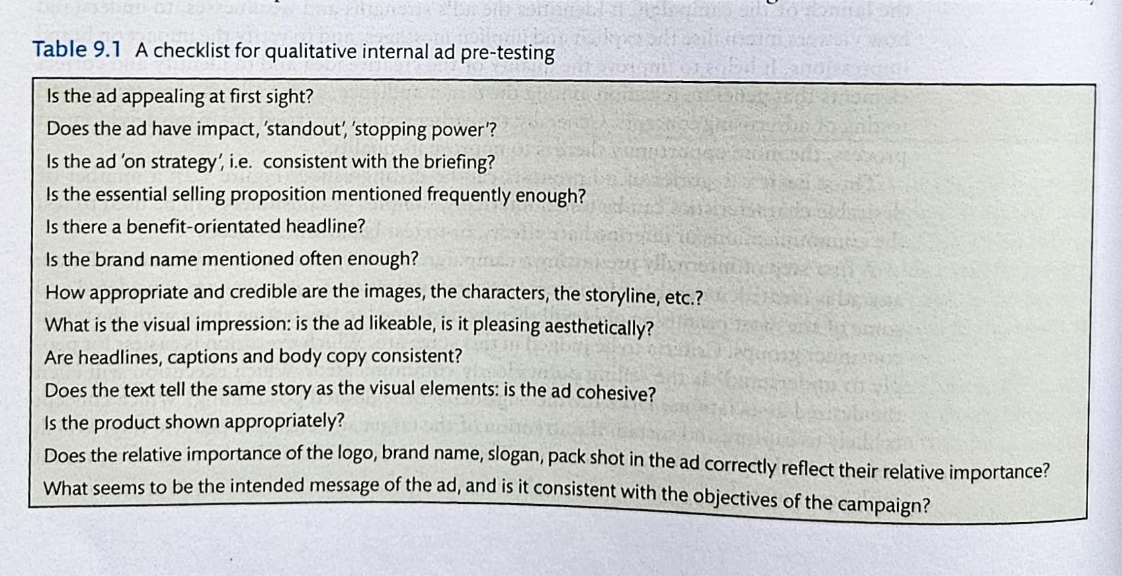
Checklist evaluation
A checklist helps evaluate whether an ad meets basic quality criteria.
The checklist on page 406 includes questions such as:
Is the ad attention-grabbing?
Does it have stopping power?
Is the message clear?
Is the benefit mentioned frequently enough?
Is there a benefit-oriented headline?
Is the brand name mentioned often enough?
How appropriate and credible are the images, characters, and storyline?
Are headline, captions, and copy consistent?
Is the brand/logo/slogan/pack shot visible and correctly prioritised?
Is the ad consistent with campaign objectives?
Readability analysis
Readability analysis checks whether the text is easy to understand.
Research suggests that easier text often uses:
short sentences,
familiar words,
concrete words,
limited complex concerns.
Exam sentence
Internal pre-testing uses tools such as checklists and readability analysis to assess whether the ad is clear, consistent, credible, brand-linked and easy to understand.
6. Physiological tests
Physiological tests measure bodily or unconscious reactions to an ad.
Examples include:
eye tracking,
pupil dilation,
skin conductance / galvanic skin response,
heart rate,
facial coding,
EEG,
fMRI.
What they measure
These tests can assess:
attention,
arousal,
emotional response,
memory-related processing,
visual attention,
unconscious reactions.
Advantage
They can capture responses that consumers may not be able or willing to report.
Limitation
They can be expensive, difficult to interpret, and may not directly predict real-world behaviour.
Exam sentence
Physiological pre-tests measure unconscious or bodily responses such as attention, arousal or emotional reaction, but they can be costly and difficult to interpret.
7. Research insight: Implicit Association Test, IAT
The chapter includes a research insight on measuring attitudes indirectly with the Implicit Association Test.
The IAT measures automatic associations between concepts.
Example:
How quickly people associate a brand with “good” or “bad,” or with “healthy” or “unhealthy.”
Why this matters
Explicit attitude measures can be biased because people may give socially desirable answers. Implicit methods can reveal automatic associations that consumers may not report directly.
Exam sentence
The Implicit Association Test measures automatic brand associations and is useful when explicit self-reports may be biased by social desirability or lack of awareness.
8. Recall tests
Recall tests measure whether people remember the ad after exposure.
The chapter explains that recall can be tested in several ways.
Portfolio test
Consumers look through a portfolio containing ads and editorial content. Later, they are asked what they remember.
Day-after recall test
Consumers are contacted the day after exposure and asked what they remember.
What recall can measure
Recall tests can measure:
whether people remember seeing the ad,
which elements they remember,
whether they remember the brand,
whether they remember the message,
what emotions or thoughts they remember.
Limitation
Recall is not always the same as effectiveness. Some ads may be persuasive even if not strongly recalled, and some ads may be recalled for the wrong reason.
Exam sentence
Recall tests measure whether consumers remember an ad or its message after exposure, but recall does not automatically prove persuasion or sales effectiveness.
9. Direct opinion measurement
Direct opinion measurement asks consumers to evaluate an ad directly.
Consumers may rate the ad on dimensions such as:
interesting,
informative,
believable,
original,
irritating,
understandable,
likeable,
beautiful,
relevant,
persuasive.
The research insight on page 408 gives examples of items used to measure attitude toward the ad.
Example items:
This ad appeals to me.
This ad is interesting.
This ad is beautiful.
This ad is irritating.
This ad draws attention.
This ad tells me something new.
This ad fits the brand.
This ad is original.
This ad gives me a positive impression of the brand.
Exam sentence
Direct opinion measurement asks consumers to rate the ad on characteristics such as liking, clarity, credibility, originality, irritation and perceived fit with the brand.
10. Business insight: pre-test for a bank commercial
The textbook gives an example of pre-testing a bank commercial.
Consumers watched a video and then selected words that described the video, such as:
dynamic,
calm,
controlled,
spontaneous,
boring,
exciting,
mainstream,
exclusive,
entertaining,
informative,
conservative,
new.
Then they described their ideal bank using similar word pairs.
Exam meaning
This checks whether the campaign creates the desired brand image. If the ad image does not match the desired brand image, the campaign can be adapted and retested.
Exam sentence:
A pre-test can compare how consumers perceive the ad with how they perceive the ideal brand, helping marketers adjust the campaign before launch.
11. Indirect opinion tests
Indirect opinion tests try to reduce social desirability or artificial responses.
Examples:
Theatre test
Consumers are invited to watch a programme or film and are exposed to ads in a more natural setting.
Clutter test
The tested ad is shown among other ads to simulate real media clutter.
On-air test
A test commercial is shown in a real TV environment or local market.
Split-scan test
Different ads are shown to different consumer groups so researchers can compare their effects.
Exam sentence
Indirect pre-tests expose consumers to ads in more realistic or less obvious testing situations, reducing the risk that consumers respond unnaturally because they know they are being tested.
12. Limitations of pre-testing
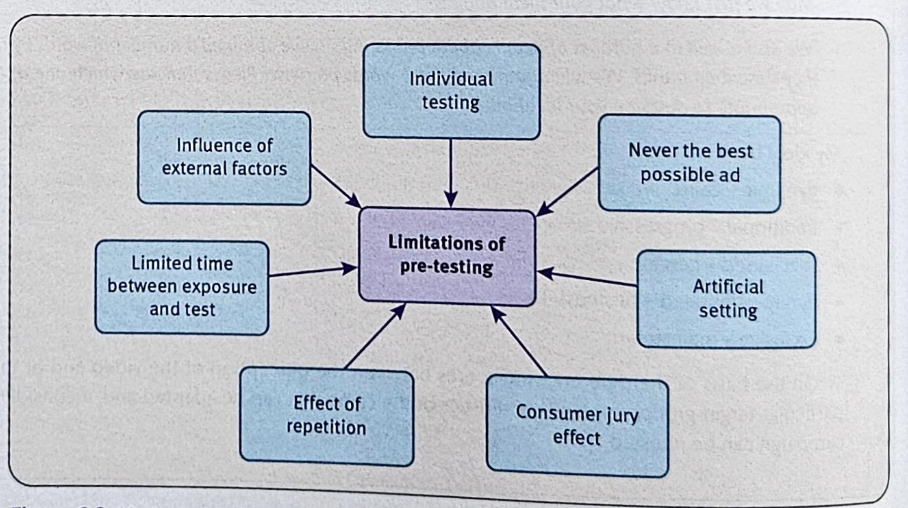
The figure on page 410 lists several limitations of pre-testing:
influence of external factors,
limited time between exposure and test,
effect of repetition,
individual testing,
never the best ad possible,
artificial setting,
consumer jury effect.
Why this matters
Pre-tests are useful but cannot perfectly predict real-world campaign success.
For example:
Real consumers see ads with distractions and competitors.
Repetition matters, but pre-tests may show the ad only once.
Participants may overthink their answers.
A test may identify the best of several weak ads, not a truly excellent ad.
Exam sentence
Pre-testing is useful for improving ads before launch, but its predictive power is limited because test settings are artificial, repetition and context may differ from reality, and external market factors are not captured.
13. Post-testing of advertising
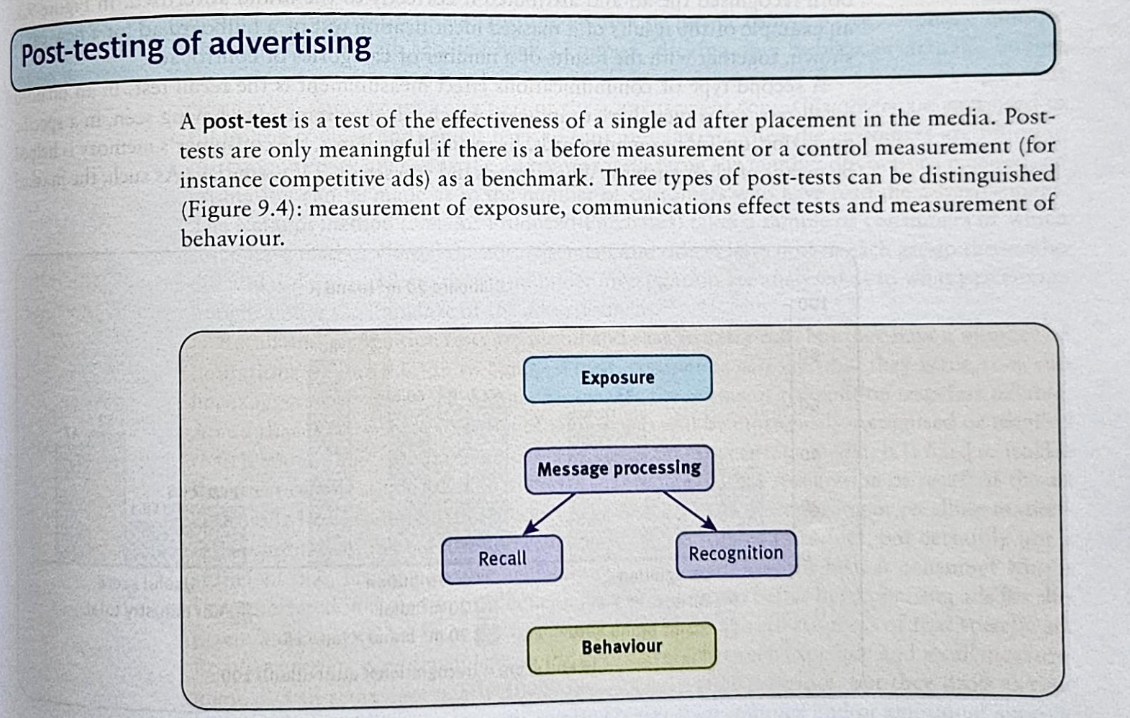
Post-testing measures the effectiveness of an ad after it has appeared in media.
According to the figure on page 411, post-testing can measure:
Exposure
Message processing
Recall
Recognition
Behaviour
Exposure measurement
This checks whether the ad reached the audience.
Examples:
reach,
GRP,
OTS,
audience numbers.
Communication effects
This checks whether consumers processed the message.
Examples:
recognition,
recall,
brand attribution,
message understanding,
attitude.
Behavioural effects
This checks whether consumers acted after exposure.
Examples:
visiting a store,
buying,
calling,
requesting information,
clicking,
searching,
talking about the brand.
Exam sentence
Post-testing evaluates an ad after media exposure by measuring exposure, recall, recognition, message processing and behavioural response.
14. Recognition and recall in post-testing
Recognition
Recognition means consumers recognise the ad when they see it again.
Example:
They are shown an ad and asked: “Have you seen this before?”
Recall
Recall means consumers can remember the ad without seeing it again.
Example:
“What ads do you remember seeing yesterday?”
Recognition vs recall
Recognition is easier because the consumer receives a cue.
Recall is harder because the consumer must retrieve the ad from memory without seeing it.
Exam sentence
Recognition measures whether consumers identify an ad when shown it again, while recall measures whether they can remember the ad without being shown it.
15. Starch test
The Starch test is a recognition test for print ads.
It classifies readers into categories:
Category | Meaning |
|---|---|
Non-readers | Do not remember seeing the ad |
Noted | Remember having seen the ad |
Associated | Remember seeing the ad and correctly identify the brand |
Read most | Read at least half of the ad |
Exam sentence
The Starch test measures, print ad recognition, by classifying readers as non-readers, noted, associated or read most.
16. Masked identification test
In a masked identification test, the brand name is covered. Respondents are asked if they recognise the ad and whether they can identify the brand.
This helps measure whether consumers correctly link the ad to the brand.
The figure on page 412 shows that effectiveness can be evaluated through:
recognition,
attribution,
useful score.
Useful score formula
The figure gives:
Useful score = recognition × attribution / 100
This matters because an ad is less useful if people recognise it but cannot connect it to the correct brand.
Exam sentence:
The masked identification test measures whether consumers recognise an ad and correctly attribute it to the brand; the useful score combines recognition and attribution.
17. Bruzzone test
The Bruzzone test is a prompted recall test.
Respondents receive a deck of cards with brand names in a category and indicate which ads they remember seeing.
It can measure:
proved name registration: remember brand and ad.
idea penetration: understand the main idea.
conviction: intention to buy or use the product.
Exam sentence
The Bruzzone test measures prompted recall and can assess whether consumers remember the brand, understand the main idea and feel convinced to buy.
18. Gallup-Robinson Impact Test
The Gallup-Robinson Impact Test is an unprompted recall test, often using telephone interviews.
Respondents are asked what ads they remember seeing or hearing.
It is useful because it does not give brand cues, so it measures spontaneous recall.
Exam sentence
The Gallup-Robinson Impact Test measures unprompted recall by asking consumers what advertisements they remember without giving brand cues.
19. Behavioural post-testing
Behavioural post-tests measure what consumers actually did after exposure.
Examples include:
calls to a phone number,
coupon redemption,
website visits,
store visits,
test drives,
purchases,
information requests,
competition entries.
The chapter gives examples such as using coded coupons, phone numbers, or campaign-specific links to identify which campaign caused the response.
Exam sentence
Behavioural post-testing measures actions after ad exposure, such as buying, visiting a website, using a coupon or requesting information.
20. Limitations of post-testing
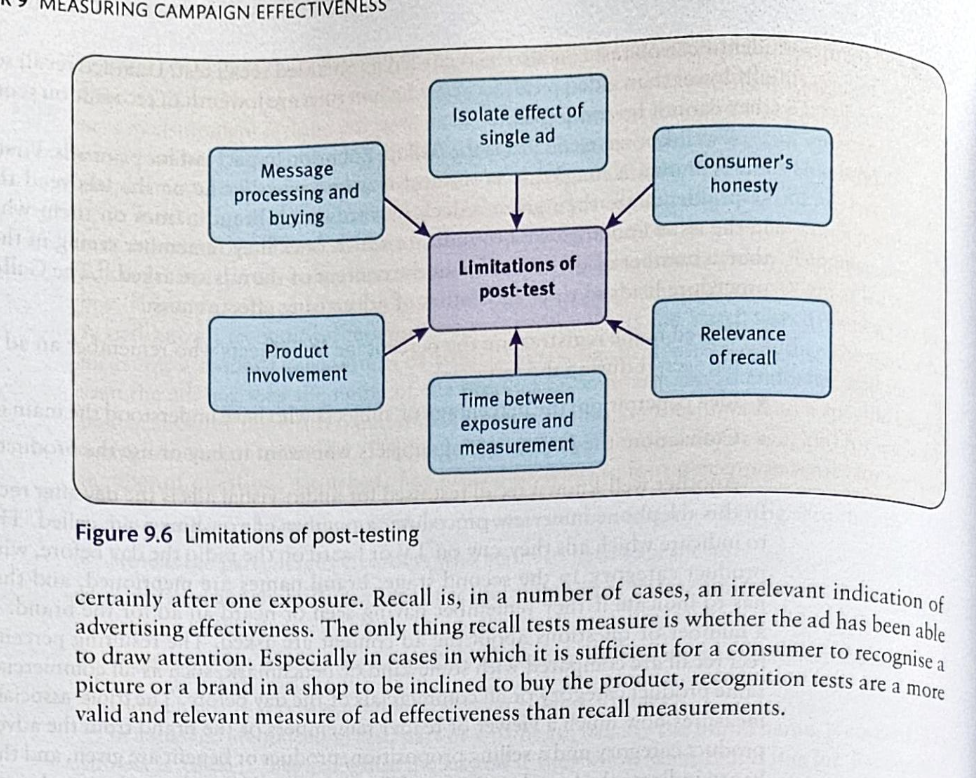
The figure on page 414 lists limitations such as:
message processing and buying are hard to separate,
single-ad effects are difficult to isolate,
consumers’ honesty,
relevance of recall,
product involvement,
time between exposure and measurement.
Important exam idea
Recall is not always a valid measure of effectiveness. Some effective ads may not be consciously remembered, and some memorable ads may not change behaviour.
Exam sentence
Post-testing is useful but limited because recall may not equal effectiveness, consumers may not report honestly, and it is difficult to isolate one ad’s effect from other marketing influences.
21. Advertising campaign evaluation research
Campaign evaluation research looks at the overall campaign, not just one ad.
It asks:
Did the campaign achieve its communication and marketing objectives?
It can measure changes in:
brand awareness,
top-of-mind awareness,
brand knowledge,
brand image,
attitude,
purchase intention,
trial,
repeat purchase,
sales,
market share,
loyalty,
NPS,
activation.
Why campaign evaluation is harder than post-testing
Post-testing usually measures one ad.
Campaign evaluation measures the effect of a full campaign, often across many media and touchpoints.
It must also separate campaign effects from other factors such as price, distribution, competitor activity or product changes.
Exam sentence
Campaign evaluation research assesses whether the whole campaign achieved its objectives, using measures such as awareness, image, attitude, intention, behaviour, sales and loyalty.
22. Communication effects in campaign evaluation
The chapter explains that campaigns may be evaluated according to the hierarchy-of-effects logic.
Common indicators include:
Brand awareness
Can consumers recognise or recall the brand?
Top-of-mind awareness
Is the brand the first one mentioned in the category?
Brand image
What associations do consumers have with the brand?
Brand attitude
Do consumers evaluate the brand positively?
Purchase intention
Do consumers intend to buy?
Net Promoter Score, NPS
NPS measures recommendation intention.
Formula:
NPS = % promoters − % detractors
Where:
promoters usually score 9–10,
passives score 7–8,
detractors score 0–6.
Exam sentence
Campaign evaluation often measures communication effects such as awareness, image, attitude, purchase intention and NPS before examining actual behavioural outcomes.
23. Activation measures
The research insight on pages 415–416 lists many activation measures.
Activation means whether the campaign stimulated people to do something.
Examples include:
Information seeking
search online,
search in magazines or newspapers,
visit brand website,
visit a store,
find price information,
find a store or selling point.
Sharing and social action
share the campaign,
post about the brand,
start or join conversations,
talk positively about the campaign,
talk positively about the brand.
Entertainment and participation
watch a movie or clip,
play a game,
enter a contest,
participate in a promotion.
Buying behaviour
buy the brand in-store,
buy the brand online,
buy another product from the brand,
buy at a later time.
Exam sentence
Activation measures assess whether consumers respond behaviourally to a campaign, such as searching, sharing, visiting, participating, talking or buying.
24. Tracking studies
Tracking studies repeatedly measure campaign effects over time.
They often compare:
awareness before, during and after the campaign,
attitudes before and after,
sales development,
purchase behaviour,
competitor performance.
Why tracking matters
A single measurement may be misleading. Repeated measurements show whether the campaign effect increases, decreases or disappears over time.
Exam sentence
Tracking studies measure campaign effects repeatedly over time, helping marketers see whether communication effects and behaviour change during or after the campaign.
25. Isolating the effect of advertising
A major problem in campaign evaluation is isolating whether the campaign caused the result.
The business insight on pages 417–418 gives examples.
Example 1: bank savings account
A small bank advertised a savings account with a high interest rate.
The campaign seemed successful because:
spontaneous brand awareness increased,
added brand awareness increased,
correct attribution increased,
account holders increased during campaign periods.
But the textbook warns:
The campaign may not be the only reason for success. The high interest rate itself may have attracted consumers.
So the communication effect and the product/offer effect are hard to separate.
Example 2: chain of clothing stores
A clothing retailer launched a radio campaign and sales increased.
At first the campaign looked very successful.
But after correcting for the increased number of stores, the results looked less impressive.
Exam sentence
Campaign effects are difficult to isolate because sales may increase due to other factors, such as price, distribution, product attractiveness, competitor activity or store expansion.
26. ART framework: awareness–trial–retention
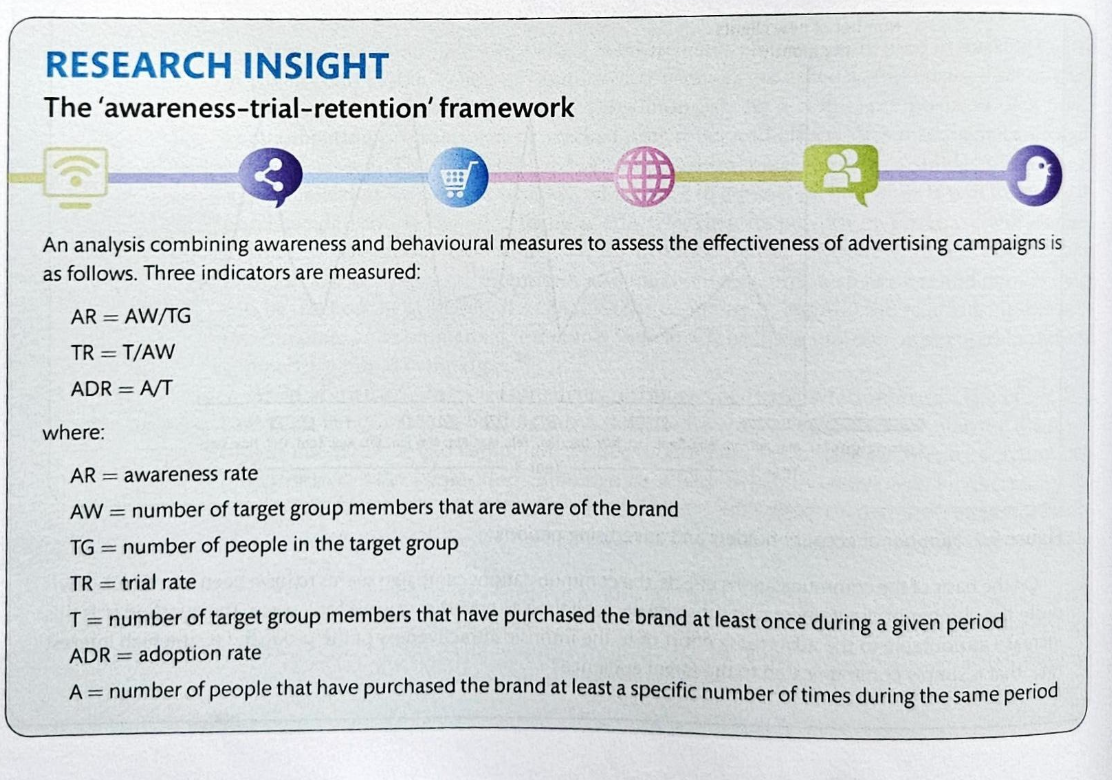
The research insight on page 418 introduces the awareness–trial–retention framework.
It uses three measures:
Awareness rate, AR
AR = AW / TG
Where:
AR = awareness rate
AW = number of target group members aware of the brand
TG = number of people in the target group
Trial rate, TR
TR = T / AW
Where:
TR = trial rate
T = number of target group members that have purchased the brand at least once
AW = number aware of the brand
Adoption rate, ADR
ADR = A / T
Where:
ADR = adoption rate
A = number of people who have purchased the brand a specific number of times during a period
T = number who have purchased the brand at least once
Meaning
The ART framework helps identify where the problem is:
low awareness: people do not know the brand,
low trial: people know it but do not try it,
low retention/adoption: people try it but do not repeat.
Example from the book
Two brands may have the same commercial result, but for different reasons:
Brand A has high awareness but low trial/adoption.
Brand B has low awareness but high trial/adoption.
This means they need different strategies.
Exam sentence
The ART framework separates awareness, trial and retention/adoption, helping marketers identify whether a brand’s problem is lack of awareness, lack of first purchase, or lack of repeat buying.
27. Behavioural and financial campaign effects
Beyond communication effects, campaigns can be evaluated through behavioural and financial outcomes.
Examples:
trial purchase,
repeat purchase,
adoption,
loyalty,
market share,
sales,
profit,
ROI.
However, these are harder to attribute directly to advertising.
Sales response and advertising investment
The textbook gives a simple sales response relationship.
One formula shown is:
S = 1.5 + 0.2 × A
Where:
S = sales in million euros
A = advertising in million euros
This means:
For every extra €1 million invested in advertising, sales increase by €0.2 million.
But the chapter then explains that advertising effects may carry over into future periods.
A more realistic formula is:
S(t) = 1.5 + 0.2 × A(t) + 0.8 × S(t − 1)
Where:
S(t) = sales in the current period,
A(t) = advertising investment in the current period,
S(t − 1) = sales in the previous period.
This model includes both:
a short-term effect of current advertising,
a carryover effect from previous sales.
Exam sentence
Sales response models can estimate the relationship between advertising investment and sales, but sales are also affected by carryover effects and many non-communication factors.
28. Measuring online advertising effectiveness
The section ends by moving into online effectiveness measurement.
The internet allows marketers to track many behaviours directly.
For websites, marketers can measure:
number of visitors,
unique visitors,
page views,
time on site,
bounce rate,
traffic sources,
search keywords,
countries,
navigation path,
conversions,
sales,
sharing behaviour.
Why this matters
Online evaluation is often more behavioural and real-time than traditional media evaluation.
But the chapter warns that online measurement should still be linked to campaign objectives, not just easy-to-measure metrics.
For example, clicks are not always meaningful if they do not lead to conversion or brand improvement.
Exam sentence
Online advertising effectiveness can be measured through website analytics, conversions, traffic sources, user paths and engagement, but metrics should be interpreted according to campaign objectives.
29. Website effectiveness
Website effectiveness can be measured by asking for direct feedback and through analytics.
Website feedback
Brands can collect feedback through:
online forms,
pop-up feedback,
customer satisfaction surveys,
complaints,
contact forms.
Website analytics
Analytics can measure:
number of visits,
unique visitors,
repeat visitors,
how users arrived at the site,
keywords used,
pages visited,
time spent,
clicks,
conversions,
sharing,
sales.
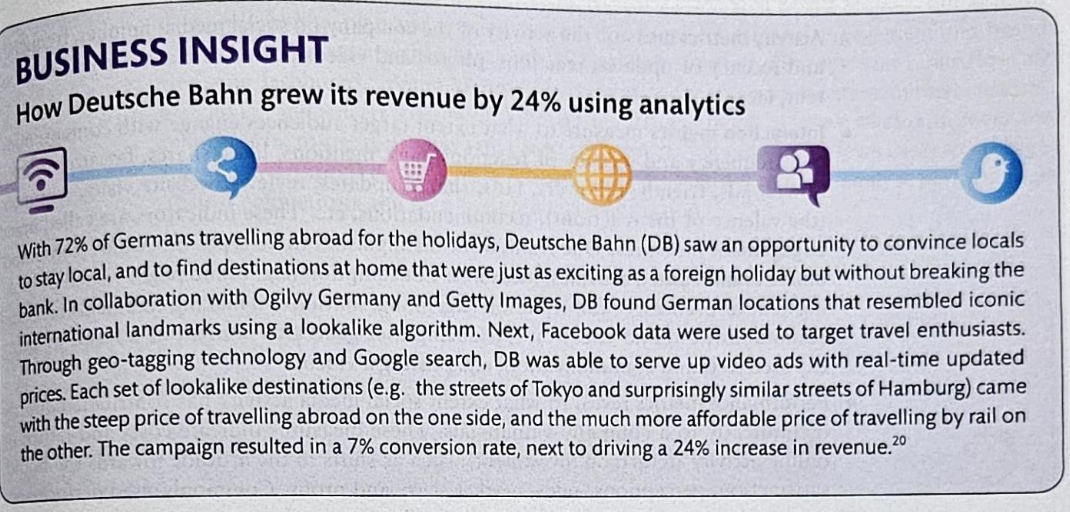
Business insight: Deutsche Bahn
The Deutsche Bahn example shows how analytics can improve campaign performance.
Deutsche Bahn used data and targeted travel ads to encourage Germans to holiday locally instead of abroad. The campaign used personalised comparisons between international destinations and similar German destinations, producing a strong conversion rate and revenue increase.
Exam sentence
Website analytics help marketers understand how users arrive, navigate, interact and convert on a website, enabling campaigns and websites to be improved.
30. Usability testing and user experience research
page also introduces usability and UX testing.
Methods include:
laboratory testing,
observational testing,
thinking aloud,
task-based testing,
click-speed and efficiency testing,
eye tracking,
click maps,
surveys,
customer panels,
crowdsourcing,
co-creation with users.
Purpose
The goal is to improve website or app performance by understanding whether users can complete tasks easily.
Exam sentence
Usability and UX testing evaluate whether consumers can use a website or app easily and efficiently, helping firms improve digital customer experience and conversion.
Most important exam takeaways from pages 403–421
Effectiveness research should evaluate objectives, not just creativity.
Pre-testing happens before launch and helps improve the ad.
Post-testing happens after exposure and measures recognition, recall, processing and behaviour.
Campaign evaluation looks at the whole campaign, not just one ad.
Pre-testing techniques include internal evaluation, physiological tests, recall, direct opinion, trailer tests and split-scan tests.
Checklist tests assess clarity, brand linkage, benefit, credibility and consistency.
Physiological tests measure unconscious responses, but can be difficult to interpret.
IAT measures implicit brand associations.
Recognition is easier than recall because recognition provides cues.
Starch test classifies readers into non-readers, noted, associated and read most.
Useful score = recognition × attribution / 100.
Campaign evaluation can measure awareness, image, attitude, intention, NPS, activation, sales and loyalty.
NPS = % promoters − % detractors.
Activation measures include searching, sharing, talking, visiting, participating and buying.
Campaign effects are hard to isolate because many other factors influence sales.
ART framework separates awareness, trial and adoption/retention.
AR = AW / TG.
TR = T / AW.
ADR = A / T.
Sales response models estimate advertising effects, but carryover and external variables matter.
Online effectiveness can be measured through analytics, conversion tracking and UX testing.
Mini exam paragraph
Chapter 9 explains how marketers measure campaign effectiveness before, during and after advertising exposure. Pre-testing evaluates ads before launch to improve the creative idea, message clarity, brand linkage and expected communication effects. Post-testing measures whether an ad was noticed, recognised, recalled, correctly attributed to the brand and whether it stimulated behaviour. Campaign evaluation research assesses whether the whole campaign achieved its objectives, such as awareness, image, attitude, purchase intention, activation, sales or loyalty. However, isolating advertising effects is difficult because sales are also influenced by price, distribution, competitors and product attractiveness. Therefore, marketers use frameworks such as ART, which separates awareness, trial and adoption, and online analytics, which measure visits, traffic sources, conversions and user behaviour. The key exam point is that effectiveness should be judged against the campaign objective, not just by creativity, recall or clicks.
Textbook pages 422–438 / PDF pages 20–36
Chapter 9, textbook pages 422–438 / PDF pages 20–36. This final section covers social media effectiveness, online metrics, analytics problems, social media intelligence, sales promotion effectiveness, direct marketing effectiveness, PR effectiveness, sponsorship effectiveness, and exhibition/trade show effectiveness.
1. Measuring social media advertising campaigns
The section starts by explaining that social media effectiveness must be measured against the campaign goal.
A social media campaign can aim to:
sell more products,
drive traffic to a website,
build brand image,
increase positive reviews,
increase reach,
build a fan base,
increase engagement,
stimulate sharing,
increase awareness,
activate consumers.
The key exam idea is:
Social media success cannot be judged by one metric. The right metric depends on the objective.
For example, if the objective is awareness, reach and impressions matter. If the objective is engagement, likes, shares, comments and conversations matter. If the objective is sales, conversions, cost per action and ROI matter.
2. Three types of social media metrics
The textbook distinguishes between activity metrics, interaction metrics, and performance metrics.
Activity metrics
These measure what the company does on social media.
Examples:
number of posts,
frequency of updates,
recency of updates,
number of photos/videos posted,
creativity and variety of content.
These do not measure consumer response directly. They only measure brand activity.
Exam sentence:
Activity metrics measure the amount and frequency of the brand’s own social media communication.
Interaction metrics
These measure how consumers respond to the brand’s content.
Examples:
likes,
comments,
shares,
mentions,
favourites,
links,
downloads,
followers,
fans,
reviews,
sentiment,
website visits.
The textbook links this to COBRA, meaning consumers’ online brand-related activities.
COBRA includes:
Consumption: viewing brand content, visiting brand pages, watching ads.
Contribution: liking, sharing, commenting.
Creation: producing user-generated content about the brand.
Exam sentence:
Interaction metrics measure how audiences engage with brand content, ranging from consuming content to contributing to it or creating brand-related content themselves.
Performance metrics
These measure whether social media contributes to business or financial results.
Examples:
attitude change,
satisfaction,
sales,
market share,
profit,
ROI,
cost per thousand impressions,
cost per click,
cost per action.
Exam sentence:
Performance metrics assess whether social media activity contributes directly or indirectly to business outcomes such as sales, profit, ROI or brand attitude.
3. Four social media metric categories
The textbook also gives another framework with four categories:
1. Conversation rate
The number of responses to a social media post.
Example:
How many comments or replies did a post generate?
2. Applause rate
The number of positive appreciation signals.
Example:
Likes, favourites, reactions.
3. Amplification rate
The number of times content is shared, reposted or retweeted.
Example:
Shares on Facebook or reposts on X.
4. Economic value
The total short-term and long-term return or cost savings from social media activity.
Exam sentence:
Conversation, applause and amplification measure different types of engagement, while economic value links social media activity to financial return.
4. Data management platforms, DMPs
A data management platform, or DMP, collects, organises and activates data from many sources.
Sources can include:
online data,
offline data,
mobile data,
CRM data,
website behaviour,
advertising data,
social media data.
DMPs help marketers measure campaign effectiveness and estimate the lifetime value of a customer.
Exam sentence:
A DMP integrates data from different sources so marketers can better understand customers, measure campaign effects and estimate customer lifetime value.
5. Online advertising and e-commerce tracking measures
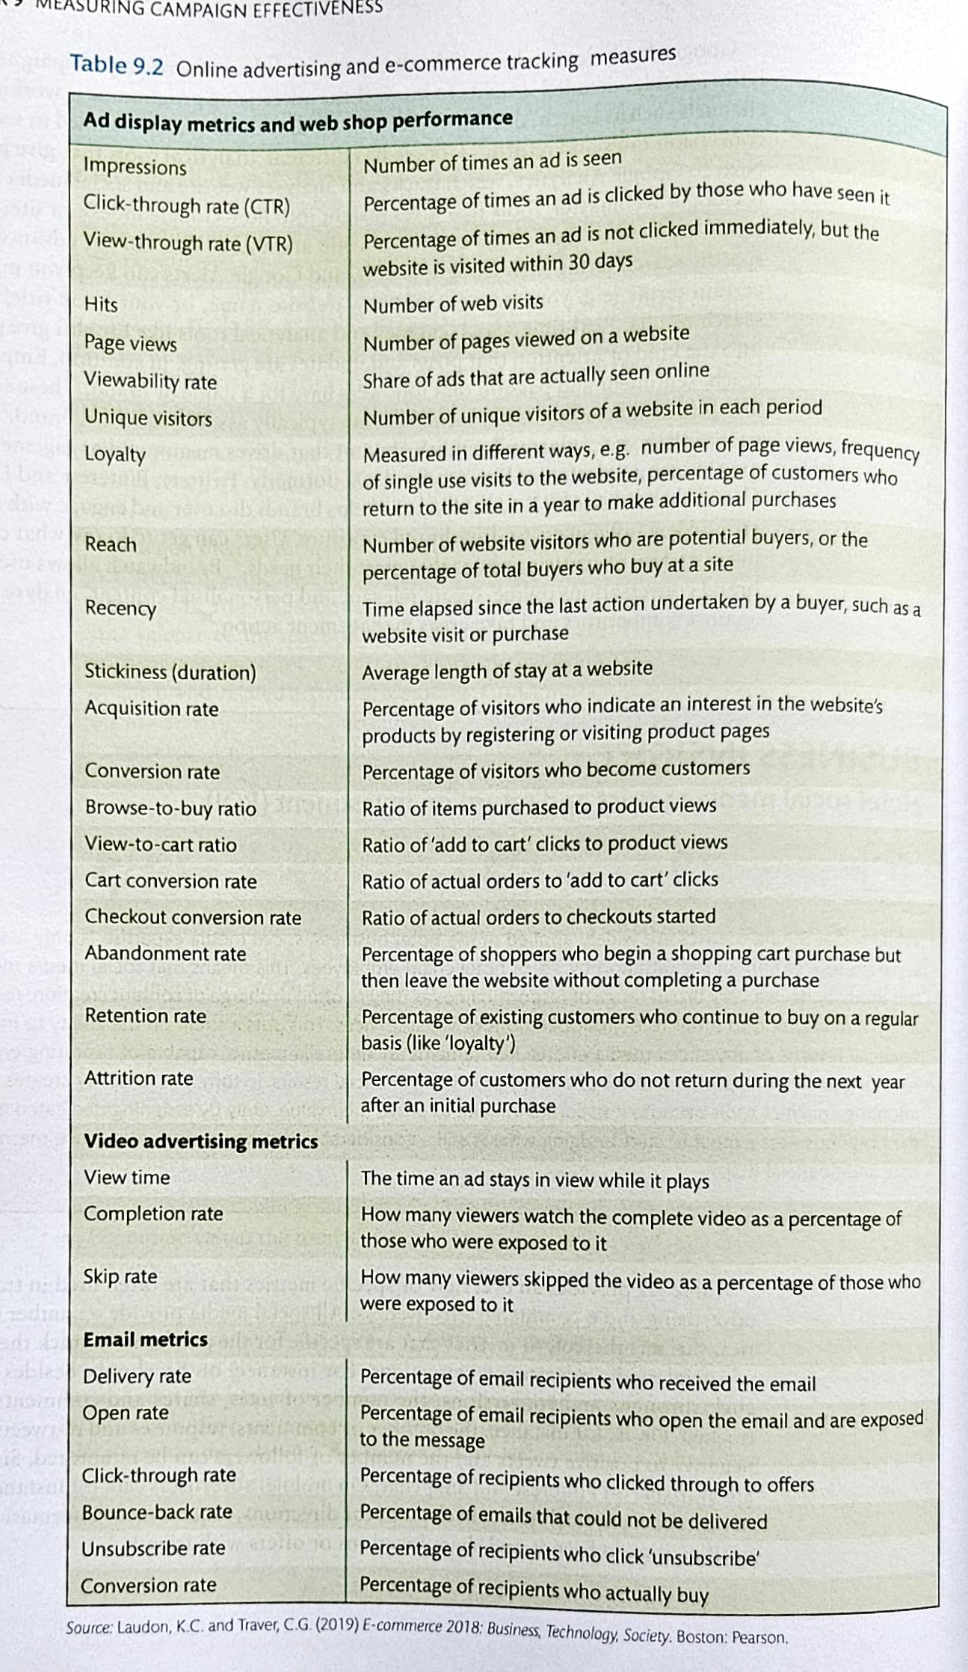
The table on textbook page 424 is very exam-relevant. It lists many online metrics.
Ad display and website metrics Impressions
Number of times an ad is shown.
Click-through rate, CTR
Percentage of impressions that lead to clicks.
Formula:
CTR = clicks / impressions × 100
View-through rate, VTR
Percentage of people who did not click immediately, but visited the website later, usually within a defined period.
Hits
Number of web visits or server requests.
Page views
Number of pages viewed on a website.
Viewability rate
Share of ads that were actually viewable on screen.
Unique visitors
Number of different people visiting the website during a period.
Loyalty
Can be measured through repeat visits, return purchases or frequency of returning to the site.
Reach
Number of website visitors who are potential buyers, or the percentage of total buyers who buy at the site.
Recency
Time since the buyer’s last action, such as a visit or purchase.
Stickiness
Average time spent on the website.
Exam sentence:
Website metrics measure exposure, attention and behaviour on the site, such as impressions, CTR, page views, unique visitors, recency, loyalty and stickiness.
6. E-commerce funnel metrics
The chapter then gives metrics that track movement through the buying funnel.
Acquisition rate
Percentage of visitors who show interest, for example by registering or visiting product pages.
Conversion rate
Percentage of visitors who become customers.
Formula:
Conversion rate = conversions / visitors × 100
or, when based on clicks:
Conversion rate = conversions / clicks × 100
Browse-to-buy ratio
Ratio of items purchased to product views.
View-to-cart ratio
Ratio of “add to cart” clicks to product views.
Cart conversion rate
Ratio of actual orders to “add to cart” clicks.
Checkout conversion rate
Ratio of actual orders to checkouts started.
Abandonment rate
Percentage of shoppers who start a shopping cart purchase but leave before completing it.
Retention rate
Percentage of existing customers who continue to buy regularly.
Attrition rate
Percentage of customers who do not return after an initial purchase.
Exam sentence:
E-commerce metrics help identify where consumers drop out of the purchase funnel, from viewing products to adding to cart, starting checkout and completing purchase.
7. Video advertising metrics
Important video metrics include:
View time
How long the ad stays in view while it plays.
Completion rate
Percentage of exposed viewers who watch the complete video.
Formula:
Completion rate = completed views / exposed viewers × 100
Skip rate
Percentage of exposed viewers who skip the video.
Formula:
Skip rate = skipped views / exposed viewers × 100
Exam sentence:
Video effectiveness can be measured through view time, completion rate and skip rate, which show whether viewers actually stayed with the video.
8. Email metrics
The table also gives email effectiveness metrics.
Delivery rate
Percentage of recipients who received the email.
Open rate
Percentage of recipients who opened the email.
Click-through rate
Percentage of recipients who clicked through to the offer.
Bounce-back rate
Percentage of emails that could not be delivered.
Unsubscribe rate
Percentage of recipients who unsubscribe.
Conversion rate
Percentage of recipients who actually buy or complete the desired action.
Exam sentence:
Email campaign effectiveness can be tracked through delivery, open, click-through, bounce-back, unsubscribe and conversion rates.
9. Relevant and irrelevant KPIs for Facebook ads
The business insight on page 425 warns that marketers often focus on the wrong KPIs.
A KPI, key performance indicator, should match the campaign objective.
For example:
If the goal is awareness, impressions and reach are relevant.
If the goal is engagement, comments, shares and reactions are relevant.
If the goal is traffic, clicks and CTR are relevant.
If the goal is sales, conversion rate, cost per purchase and ROI are relevant.
The warning is that vanity metrics can look impressive but may not show real effectiveness.
Examples of vanity metrics:
many likes,
many followers,
many impressions,
high reach without action.
These are not useless, but they are weak if they are not linked to the campaign objective.
Exam sentence:
A KPI is only useful if it matches the campaign objective; likes and impressions can become vanity metrics when the real goal is leads, sales or conversion.
10. Data analytics pitfalls
The textbook explains that online analytics do not simply show “the truth.”
Different platforms can report different results.
For example:
Facebook may count a page visit from the moment someone clicks an ad.
Google Analytics may count a visit only once the landing page loads.
So if someone clicks but leaves before the page loads, Facebook may count the visit while Google may not.
Attribution problem
Another major issue is attribution.
Attribution asks:
Which channel, ad or touchpoint deserves credit for the conversion?
Simple models include:
Last-click attribution
The final touchpoint before conversion gets all credit.
Problem: ignores earlier touchpoints.
First-click attribution
The first touchpoint gets all credit.
Problem: ignores later persuasion.
Data-driven attribution
Uses data to estimate how much each touchpoint contributed.
Better, but still imperfect.
Exam sentence:
Attribution models allocate credit for conversions across touchpoints, but simple models such as first-click and last-click can misrepresent the real customer journey.
11. Cookie and tracking problems
Analytics tracking often depends on cookies, but cookies have limitations.
Problems include:
people use multiple devices,
people use multiple browsers,
cookies expire,
third-party cookies are restricted,
some users block cookies,
tracking can feel intrusive,
privacy regulation limits tracking.
Because of this, online campaign measurement is becoming less complete and more difficult.
The textbook suggests using a combination of:
attribution models,
micro-conversions,
media mix modelling,
machine learning,
AI,
qualitative insights.
Exam sentence:
Cookie-based tracking is increasingly limited by privacy restrictions and multi-device behaviour, so marketers should combine attribution, micro-conversions, media mix modelling and qualitative insights.
12. Micro-conversions
Instead of only measuring final sales, marketers can measure smaller steps in the customer journey.
Examples of micro-conversions:
adding to cart,
selecting size,
watching product video,
downloading information,
registering,
clicking store locator,
starting checkout.
Micro-conversions help identify where friction occurs.
Exam sentence:
Micro-conversions are smaller actions before final conversion that help marketers identify friction points in the customer journey.
13. Social media intelligence
The textbook argues that social media monitoring is not enough. Brands need social media intelligence.
→
This means using social media data to generate meaningful insights for decision-making.
The chapter gives a five-step process.
Step 1: Measure what matters
Do not only measure awareness and reach. Focus on actions that fit strategic goals.
Example:
Did the campaign start a discussion?
Did it generate interest?
Did it create delight?
Did it activate consumers?
Step 2: Cast a wide net
Gather data from many online sources, not just one platform.
Examples:
social media posts,
blogs,
reviews,
forums,
brand pages,
comments.
This avoids selective listening.
Step 3: Analyse the text
Use text analysis tools such as:
word count: counts frequent words,
co-occurrence analysis: looks at words appearing near each other,
sentiment analysis: measures positive or negative tone.
Step 4: Understand biases
Online comments are biased.
Reasons include:
expectations affect experience,
experts and novices interpret differently,
social context creates bandwagon effects,
extreme opinions are more likely to be posted,
moderate consumers are under-represented,
posters are a vocal minority,
lurkers read but do not post.
This means online reviews do not perfectly represent all consumers.
Step 5: Establish links to performance
Finally, link social media data to strategic decisions and performance indicators.
Exam sentence:
Social media intelligence means moving beyond counting mentions to analysing online conversations, understanding biases and linking insights to strategic and performance outcomes.
14. Sales promotions effectiveness
Sales promotions can be pre-tested, but most evaluation focuses on behaviour.
Sales promotions are usually designed to:
stimulate trial,
increase sales,
increase purchase quantity,
attract new customers,
encourage repeat purchase,
increase short-term revenue.
How to measure sales promotion effectiveness
The textbook suggests comparing:
Sales and gross margins before, during and after the promotion.
Average order size during promotion versus non-promotion periods.
Total sales of all items during promotion versus non-promotion periods.
Results of different promotions against each other.
Added gross margin versus incremental promotion cost.
The key question is:
Did the promotion create real extra sales, or did it just move future sales forward?
Exam sentence:
Sales promotion effectiveness should be measured by comparing sales, margins and order size before, during and after the promotion, while checking whether the promotion created real extra sales or merely shifted future purchases forward.
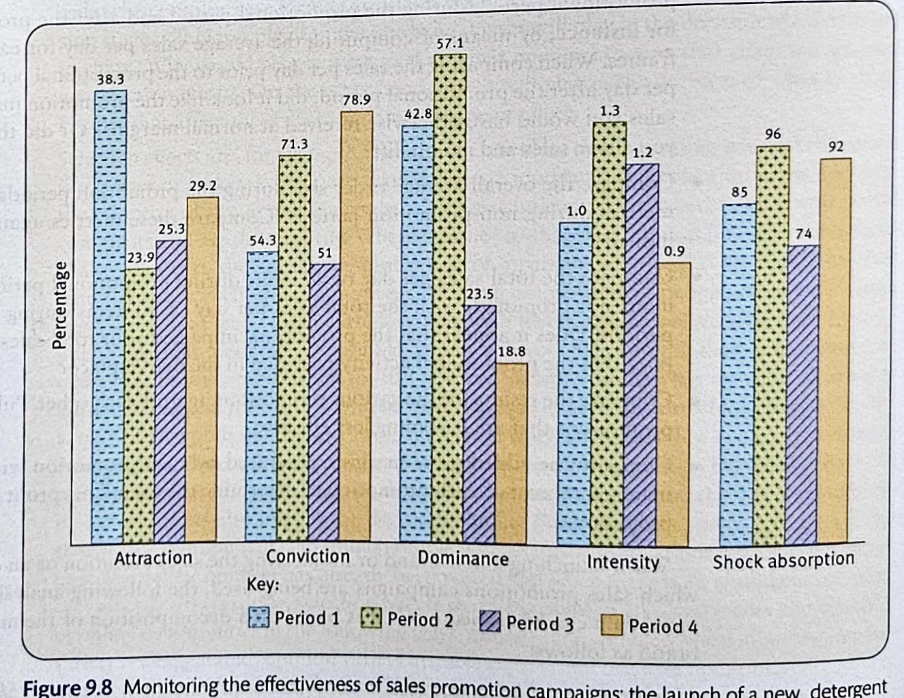
15. Sales promotion decomposition formula
The textbook gives a formula for analysing market share when sales promotions are used.
Market share = Attraction × Conviction × Domination × Intensity / Shock absorption
Attraction
Measures brand penetration.
It reflects how many product-category buyers become buyers of the brand.
Conviction
Measures loyalty or repeat buying.
It indicates how successfully the brand turns buyers into loyal customers.
Domination
Measures exclusivity of loyalty.
It shows how much loyal customers buy the brand compared with other brands in the category.
Intensity
Measures whether the brand attracts heavy users.
If intensity is greater than 1, the brand attracts more heavy users than average.
Shock absorption
Measures vulnerability to competitors’ promotions.
A higher shock absorption rate means the brand is less vulnerable because sales are based more on loyal customers.
Exam sentence:
Sales promotion effectiveness can be analysed through attraction, conviction, domination, intensity and shock absorption, which together show whether promotions create penetration, loyalty, exclusivity, heavy-user appeal and resistance to competitors.
16. Sawtooth effect of sales promotions
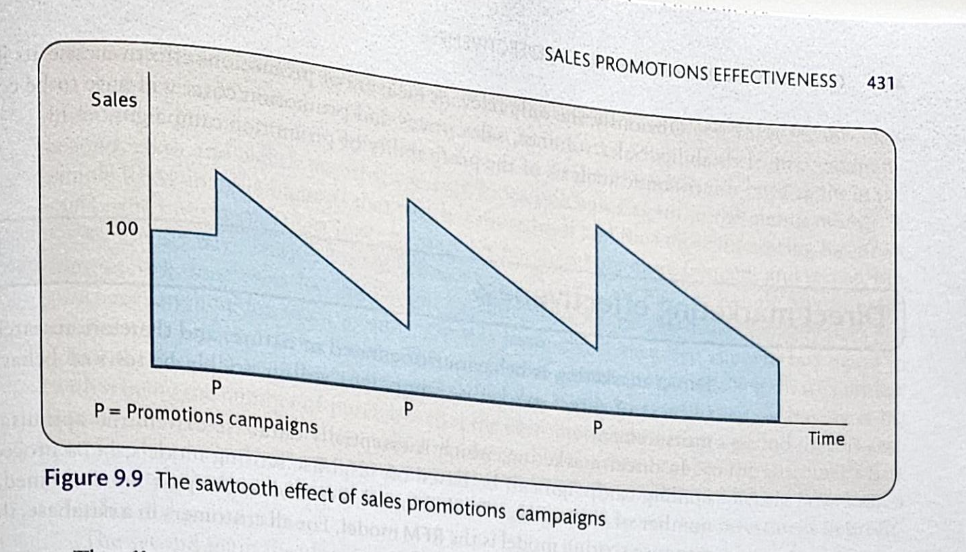
The textbook discusses the sawtooth effect.
This happens when sales rise during a promotion but fall afterwards.
Why?
Because consumers stock up during the promotion and then do not buy for a while.
This creates a post-promotion dip.
Important exam point:
A promotion is only truly successful if the extra sales during the promotion are larger than the lost sales after the promotion.
If the post-promotion dip cancels out the extra sales, the company may simply have reduced its profit margin without gaining real volume.
Exam sentence:
The sawtooth effect occurs when promotions create a sales peak followed by a post-promotion dip because consumers stockpile; effectiveness depends on whether the promotion generates net extra sales after the dip.
17. Baseline sales and promotion effects
The textbook explains that marketers should estimate baseline sales, meaning normal expected sales without promotion.
Then they compare actual sales with baseline sales.
If sales exceed baseline during the promotion, that difference may be attributed to the promotion.
However, marketers must also consider the post-promotion dip.
Exam sentence:
Baseline sales estimate normal sales without promotion; promotion effectiveness can be assessed by comparing actual sales with baseline sales and accounting for post-promotion dips.
18. Direct marketing effectiveness
Direct marketing is behaviour-oriented, so effectiveness is usually measured through behavioural response.
Examples:
response rate,
orders,
purchases,
leads,
repeat purchases,
revenue,
profit.
Direct marketing often uses customer databases, so campaigns can be optimised through response scoring models.
19. RFM model
The most important direct marketing model in this section is the RFM model.
RFM stands for:
Recency
How recently did the customer buy?
Shorter time since last purchase = more likely to respond.
Frequency
How often does the customer buy?
More frequent buyers = more likely to respond.
Monetary value
How much does the customer spend?
Higher spending customers = more valuable.
Exam sentence:
The RFM model predicts direct marketing response using recency, frequency and monetary value: customers who bought recently, buy often and spend more are usually more attractive targets.
RFM limitation
The textbook warns that RFM has weaknesses.
A customer who bought frequently in the past may not necessarily be loyal if their normal buying pattern has changed.
RFM can overvalue customers who used to buy often but are now becoming inactive.
Also, monetary value often measures revenue, not profitability.
20. Event-history modelling
Event-history modelling improves on RFM by considering the customer’s normal purchase timing.
Example:
Customer A buys every 2 months but has not bought for 4 months → worrying.
Customer B buys every 7 months and has not bought for 4 months → less worrying.
So event-history modelling predicts whether a customer is likely to keep buying based on their individual purchase pattern.
The textbook gives the simple formula:
Probability customer keeps buying = n / t
Where:
n = number of purchases during the period,
t = fraction of the period between the first and last purchase.
Exam sentence:
Event-history modelling improves on simple RFM by considering each customer’s normal purchase cycle, helping predict when buying activity is likely to drop off.
21. Public relations effectiveness
PR effectiveness should be measured against clear PR objectives.
The textbook says sales and market share are usually not the best PR measures, because PR mainly aims to affect:
awareness,
knowledge,
opinion,
goodwill,
image,
attitudes,
relationships.
The chapter distinguishes three PR performance indicators.
Input indicators
These measure PR effort.
Examples:
number of press releases,
number of interviews,
number of meetings,
number of brochures sent,
number of online posts.
Problem: They measure activity, not real effect.
Output indicators
These measure media coverage.
Examples:
press space,
TV time,
number of mentions,
length of stories,
tone of coverage,
readership,
viewership,
opportunity to see,
headline news value.
Problem: They show visibility but not whether attitudes changed.
Achievement indicators
These measure whether PR objectives were achieved.
Examples:
target audience reached,
awareness change,
knowledge change,
attitude change,
image change,
goodwill change,
behaviour change.
Exam sentence:
PR effectiveness can be measured through input, output and achievement indicators, but achievement indicators are strongest because they measure whether the PR objective was actually reached.
22. Sponsorship effectiveness
Sponsorship is partly similar to advertising because it often aims to build awareness and brand image among target groups.
The textbook distinguishes four types of sponsorship effectiveness measures.
1. Exposure measures
These measure how many people were exposed to the sponsor.
Exposure can come from:
event attendance,
media coverage,
TV coverage,
radio mentions,
online mentions,
press coverage.
Metrics can include reach, frequency and media value.
Limitation: Exposure does not prove persuasion.
2. Communication results
These measure effects such as:
brand awareness,
sponsor recall,
sponsor recognition,
correct sponsor attribution,
image transfer.
Correct sponsor attribution is especially important.
Example:
Consumers may remember the event but not know which brand sponsored it.
3. Sales and market share
Sometimes sponsorship effects can be measured commercially, but this is usually not the main objective.
Sales effects are harder to isolate.
4. Feedback from participating groups
This includes feedback from:
event visitors,
employees,
corporate hospitality guests,
participants.
Exam sentence:
Sponsorship effectiveness can be measured through exposure, communication effects, sales/market share and participant feedback, but correct sponsor attribution and image transfer are especially important.
23. Sponsorship strength and sponsorship fit
A key sponsorship idea is the link between sponsor and event.
The stronger the perceived fit between the sponsoring brand and the sponsored event, the stronger the sponsorship effect.
Fit can be strengthened by:
advertising the sponsorship,
integrating it into the full marketing communication plan,
using social media,
building word-of-mouth,
keeping the sponsorship active over time.
Exam sentence:
Sponsorship is more effective when consumers perceive a strong fit between sponsor and event, because this improves attribution and image transfer.
24. Exhibition and trade show effectiveness
The chapter then discusses exhibitions and trade fairs.
There are four main reasons to measure trade show results:
Justify investments and calculate ROI.
Choose the right exhibitions.
Improve activities before, during and after the show.
Encourage goal-driven behaviour.
Trade shows can have many objectives, such as:
generating leads,
building relationships,
increasing sales,
collecting market information,
strengthening image,
motivating staff,
meeting current customers,
meeting new customers.
A trade show is a large-scale exhibition where businesses in a specific industry gather to showcase their products, services, and innovations to potential buyers, partners, and industry professionals.
25. Trade show reach
Trade show reach differs from media reach.
Gross reach
Number of exhibition visitors.
Net reach
Number of stand visitors.
But the textbook stresses that visitor quality matters more than quantity.
A small number of high-quality prospects may be more valuable than many uninterested visitors.
Exam sentence:
In trade shows, gross reach is the number of exhibition visitors, while net reach is the number of stand visitors; however, effectiveness depends more on visit quality than visitor quantity.
26. Measuring ROI of trade shows
The business insight on page 436 explains that trade show ROI is difficult because sales may occur months after the first contact.
The model distinguishes between different product types with different sales cycles.
Example:
Product A: average time from contact to sale = 6 months.
Product B: average time from contact to sale = 9 months.
Product C: average time from contact to sale = 12 months.
The longer the time after the trade show, the less sales can confidently be attributed to the trade show because other marketing efforts may also influence sales.
The model also distinguishes between:
new customers,
existing customers.
For new customers, a higher percentage of sales may be attributed to the fair than for existing customers.
Exam sentence:
Trade show ROI should consider the sales cycle because sales may occur months after the event, and the percentage of sales attributed to the trade show should decline over time.
27. Measures during trade shows
The textbook lists several ways to measure trade fair effectiveness during the event.
Count distributed materials
Example: brochures, catalogues, information packs.
Useful for estimating interest.
Count passers-by and stand visitors
Measures traffic and attractiveness of the stand.
Problem: some people may visit more than once.
Count personal contacts
Especially useful for lead generation and relationship-building objectives.
Contacts can be classified as:
hot prospects,
medium prospects,
cold prospects.
Analyse visitor flows
Time-lapse video can show how visitors move around the stand.
Observe visitor behaviour
Observation can reveal what catches attention and what visitors look at.
Questionnaires for stand visitors
Can measure:
stand evaluation,
information needs,
company image,
campaign recall,
satisfaction.
Survey stand personnel
Salespeople can report their perceptions, but their answers may be subjective.
Response analysis of invitations
Checks how many invited people actually visited the stand.
Sales returns
Measures actual sales results, but only works well when sales are a main objective.
Exam sentence:
Trade show effectiveness can be assessed through visitor counts, contact quality, visitor flow, observation, questionnaires, staff feedback, invitation response and sales returns.
28. Trade show ratio measures
The textbook gives several ratio measures.
Exhibition coefficient I
Exhibition coefficient I = value of transactions generated at the fair / total fair costs
Exhibition coefficient II
Exhibition coefficient II = yearly sales of the company / yearly fair costs
Visitor price
Visitor price = trade fair costs / number of fair visitors × 1,000
Stand contact price
Stand contact price = trade fair costs / number of stand contacts
Cost per stand worker
Cost per stand worker = trade fair costs / number of stand personnel
Cost per m²
Cost per m² = trade fair costs / amount of m²
Exam sentence:
Trade show ratio analysis compares fair costs with transactions, visitors, stand contacts, personnel and stand space to judge efficiency.
29. Behaviour-based trade show evaluation
The chapter ends by saying that trade show effectiveness should not only be judged by outcomes, such as immediate sales.
It can also be evaluated through whether stand personnel performed the right behaviours.
Four behaviour-based dimensions are mentioned:
1. Information-gathering activities
Collecting information about competitors, customers, industry trends and new products.
2. Image-building activities
Building corporate image and reputation.
3. Motivation activities
Motivating employees and customers.
4. Relationship-building activities
Strengthening relationships with existing and new customers.
Exam sentence:
Trade show performance can be evaluated through behaviour-based measures, such as information gathering, image building, motivation and relationship building, not only through immediate sales.
30. Full Chapter 9 final summary
Chapter 9 explains how campaign effectiveness can be measured across different marketing communication tools. It begins with pre-testing, where ads are tested before launch to improve clarity, brand linkage, message understanding and expected effects. It then covers post-testing, which measures exposure, recall, recognition, attribution and behavioural response after an ad appears in media. Campaign evaluation research goes further by assessing whether the whole campaign achieved objectives such as awareness, image, attitude, activation, purchase intention, sales, loyalty and market share.
The final section extends measurement to other communication tools. Social media campaigns can be measured through activity, interaction and performance metrics, but marketers must avoid vanity metrics and choose KPIs that match objectives. Online advertising can be tracked through impressions, CTR, conversion rate, abandonment, retention, video metrics and email metrics, but attribution, cookies and platform differences create measurement problems. Sales promotions are evaluated through changes in sales, margins, baseline sales and post-promotion dips. Direct marketing uses behavioural models such as RFM and event-history modelling. PR is measured through input, output and achievement indicators. Sponsorship is measured through exposure, attribution, image transfer and participant feedback. Finally, exhibitions and trade shows are evaluated through ROI, visitor quality, contacts, ratios and behaviour-based measures.
Key formulas to remember
Concept | Formula | Meaning |
|---|---|---|
CTR | Clicks / impressions × 100 | Percentage of impressions generating clicks |
Conversion rate | Conversions / visitors × 100 | Percentage of visitors who complete desired action |
Completion rate | Completed views / exposed viewers × 100 | Percentage who watch full video |
Skip rate | Skipped views / exposed viewers × 100 | Percentage who skip video |
Market share decomposition | Attraction × Conviction × Domination × Intensity / Shock absorption | Diagnoses sales promotion effectiveness |
Event-history probability | n / t | Probability customer keeps buying |
Exhibition coefficient I | Transactions generated at fair / total fair costs | Trade show transaction efficiency |
Exhibition coefficient II | Yearly company sales / yearly fair costs | Fair costs relative to yearly sales |
Visitor price | Trade fair costs / fair visitors × 1,000 | Cost per 1,000 fair visitors |
Stand contact price | Trade fair costs / stand contacts | Cost per contact at stand |
Cost per stand worker | Trade fair costs / stand personnel | Cost per worker |
Cost per m² | Trade fair costs / m² | Cost per square metre |
Most important exam takeaways from pages 422–438
Social media effectiveness depends on the objective.
Do not use the same metrics for every campaign.Social media metrics can be activity, interaction or performance metrics.
COBRA distinguishes consumption, contribution and creation.
Conversation, applause, amplification and economic value measure different social media outcomes.
Online metrics include impressions, CTR, VTR, viewability, unique visitors, conversion, abandonment, retention and attrition.
KPIs must not become vanity metrics.
Likes and impressions are only useful if they match the objective.Attribution is difficult.
First-click, last-click and data-driven attribution assign credit differently.Cookies and tracking are increasingly limited.
Micro-conversions help identify friction in the customer journey.
Social media intelligence requires analysing text, understanding biases and linking insights to performance.
Sales promotions should be evaluated through real incremental sales and margins, not only sales peaks.
Sawtooth effect means sales rise during promotion and drop after promotion.
RFM measures recency, frequency and monetary value.
PR effectiveness uses input, output and achievement indicators.
Sponsorship effectiveness depends heavily on correct attribution and sponsor-event fit.
Trade shows should be evaluated through ROI, visitor quality, contact quality, behavioural measures and cost ratios.
Mini exam paragraph
Campaign effectiveness measurement depends on the communication tool and objective. Social media campaigns can be evaluated through activity metrics, interaction metrics and performance metrics, but KPIs must match the goal; otherwise likes or impressions become vanity metrics. Online advertising can be tracked through impressions, CTR, conversion rate, viewability, abandonment, retention and email/video metrics, but attribution problems, cookie restrictions and platform differences make measurement imperfect. Sales promotions should be assessed by comparing sales and margins before, during and after the promotion and by checking whether sales increases are followed by a post-promotion dip. Direct marketing often uses RFM, based on recency, frequency and monetary value. PR effectiveness is measured through input, output and achievement indicators, while sponsorship effectiveness depends on exposure, sponsor attribution and image transfer. Trade shows are evaluated through ROI, visitor quality, contact quality, behavioural objectives and cost ratios.