[L15] Wind energy
1/31
There's no tags or description
Looks like no tags are added yet.
Name | Mastery | Learn | Test | Matching | Spaced | Call with Kai |
|---|
No analytics yet
Send a link to your students to track their progress
32 Terms
Electricity from wind history
very old (1890s)
installed capacity is growing rapidly
Modern wind turbines
convert kinetic energy of wind
power proportional to swept area and cube of wind speed
wind speed is site specific
air is a low density medium and large swept areas are required for large power conversion
fraction of wind power that may be converted into mechanical work has a theoretical maximum of 0.593 (Betz limit)
power coefficient varies with the tip speed ratio (rotor tip speed to free wind speed)
power coefficient often goes to theoretical maximum, and any increase in power must go with increase in swept area
Installed capacity of grid-connected wind turbines
exponentially increasing since 2001 (onshore + offshore)
1200 today GW
Perceived problems
Cost
→ but is estimated to continue decreasing
→ partially thanks to auctions / competition
Planning permission: public opinion (noise, visibility, environmental damage)
→ in reality majority is in favor
Availability
→ combination of wind & solar capacity gives a stable capacity factor (0.15) all year round
Component transport constraint on land (blades)
true issue, components are huge in size
Wind turbine size
expansion in number of wind turbines but also in size (larger area = more energy)
higher turbines → cleaner wind, higher velocities
Wind energy penetration
= Total amount of wind energy produced (GWh) / Total annual electricity demand (GWh)
enables to see how useful wind power is, useful for investors
Wind power capacity penetration
Installed wind power capacity (GW) / Peak load (GW)
how much wind power can contribute to producing electricity during peak load
enables to see how useful wind power is, useful for investors
Capacity credit of wind
= capacity of conventional plants displaced by wind power whilst maintaining the same degree of system reliability
enables to see how useful wind power is, useful for investors
Installed capacity & capacity factor
based on ‘nameplate capacity’ or ‘rated capacity’
‘rated capacity’ = maximum power that can be continuously delivered
actual delivered energy < rated capacity
Capacity factor = (actual MWh/a)/(rated capacity*24×365) ~ 20-40%
23.5% for UK farms → 2.5% penetration
29.8% in 2011 → 4.3% penetration
→ progress in UK
Is wind resource a limitation?
8 of 100×100km wind farm = all of EU’s electricity demand
→ resource is not a limitation
UK technical potential ~ 610 GW (wind farm of 20000km2 = size of Wales)
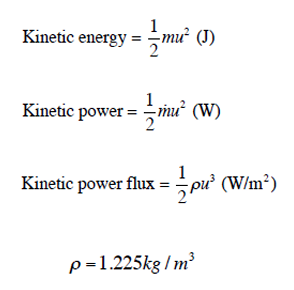
Energy content of the wind
turbines convert the kinetic energy of the wind
→ power flux increases with wind speed
Wind energy & integration
integration to EU by exporting to countries w/ lower wind speeds
issues w/ wind farms in North sea (issues w/ over clustering of farms → conflicts)
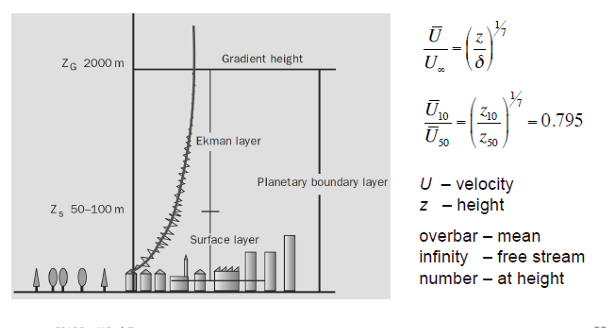
Wind speed measurements
Anemometer
gives speed at specific (usually at 10m height)
must extrapolate w/ theoretical calculations
For accurate measurements:
number & distribution of anemometer masts depend on size/topography
earth has boundary layer (wind shear profile)
boundary layer thickness of several hundred meters
ideally measurements taken at hub height >100m
recommended minimum measurement height >=75% hub height
Wind speed statistics
Annual mean wind speed is not usually a good indicator of the likely output of a farm
15m/s mean → wind could blow constantly or at 0m/s for 6 months and 30m/s for other
Need to analyse wind data further
statistical approach
speed variation follows Weibull distribution
Data recorded at hourly or 30 min intervals:
mean wind speed
max 3 sec gust speed
standard deviation
mean wind direction
mean temperature
1 years worth of data minimum
Challenges of wind power
Wind does not always blow
wind speed varies w/ time of day, weather, time of year
no phase relationship between variations in available wind power & variations in demand → wind-power is non-dispatchable
flexible generating capacity is necessary to balance supply variations → pumped storage hydro good balancing solution = large storage capacity
Dispatchable power
can be turned on and off by grid operators to match demand
Too much turbulence
breakage (50m/s gust on 100m diameter rotor)
Wind turbine types linked to drag & lift
oldest devices use sails spread normal to wind
utilise drag = force in direction of the relative wind
sail at small oblique angle to relative wind
more efficient → utilise lift = force normal to the direction of relative wind
Relative wind
device experiencing wind force F extracts power P=Fv only if device moves with the velocity v in the direction of that force
wind hits blades, is deflected sideways through lift and moves in the same direction
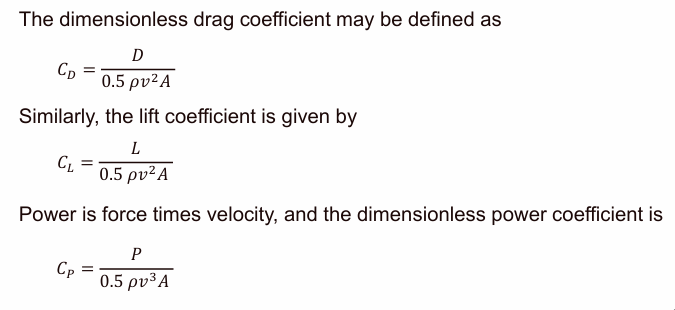
Lift & drag coefficients
drag D & lift L on a body
CD=D/(0.5rho*v2A)
CL=L/(0.5rho*v2A)
CP=P/(0.5rho*v3A)
v: velocity relative to the body
rho: air density
A: plan-form area
P=F*v
Lift to drag ratio as a function of angle incidence
moderate angle → sharp ratio increase as lift increases quickly
~5-10 degrees = optimate angle → strong lift, relatively low drag
> 15 degrees = stalled region
Velocity triangles
relative wind = incoming wind + own rotational motion
free-stream wind velocity
wind blowing towards the turbine
blade tangential velocity
due to rotation, faster near side, sideways direction
relative wind velocity
vector sum of two above velocities → what blade actually undergoes
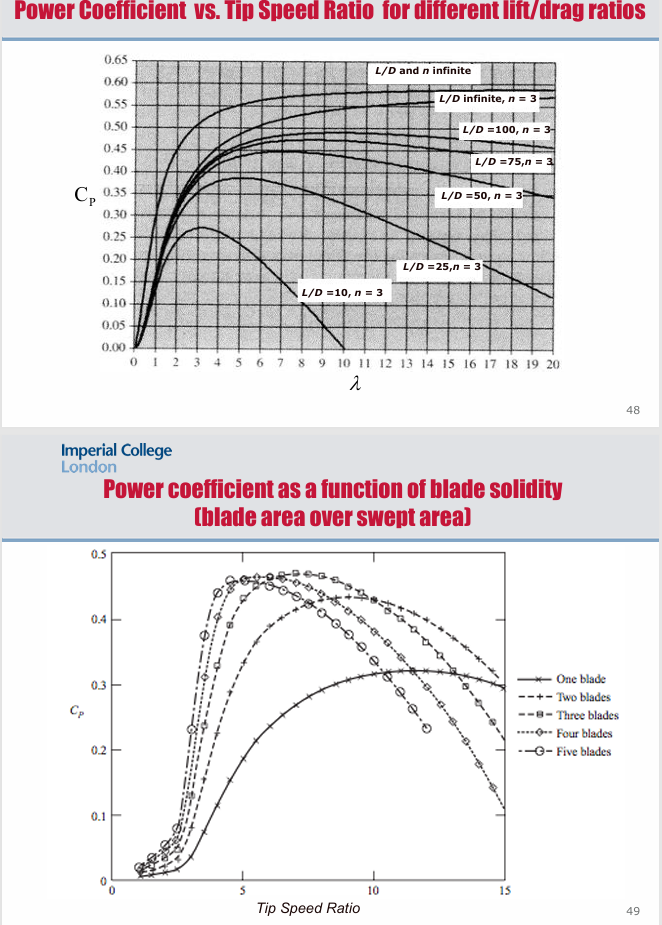
Power generated by wind turbine
Power coefficient CP
Depends on
ratio of rotor speed to wind speed
= Tip Speed Ratio (TSR)
Reynolds number Re
→ both functions of wind & velocity
→ power will increase w/ increasing wind speed between square & cube of wind velocity
increase in tip speed ratio = increase in max power coefficient
increase in blades = increase in power coefficient
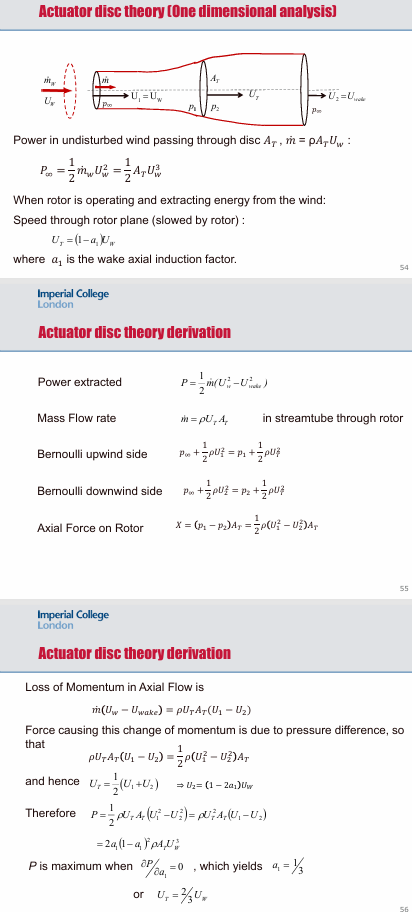
Betz aerodynamic analysis of wind rotor power
1-D dimensional momentum & energy balance
Actuator disc theory
Maximum power = 8/27*rho*Uw3Ar
Power coefficient = P/P∞
CPmax=0.5926 → Betz limit
3 bladed upwind HAWTs
Vertical axis & horizontal axis cross-flow machines
inherently unsteady = fatigue machines
Horizontal Axis Wind Turbine
dominate: 95%
experience steady forces in uniform wind
slightly more efficient than VAWTs → high TSR which increases efficiency
also means more noise
1 blade = higher efficiency (less drag from other blades) → but higher TSR to get same power → noise
1-2 blade → mechanical problems w/ movement following wind (changing inertia of rotor) → 3-blade is best compromise
Upwind rotors (blades facing wind in front of tower) avoid tower wake-blade interaction = wind hits blades before the tower (tower causes turbulence)
VAWTs resurgence
no yaw system needed
better in turbulent environments
lower centre of gravity (maintenance at ground level)
allow closer spacing → could exceed HAWT power densities
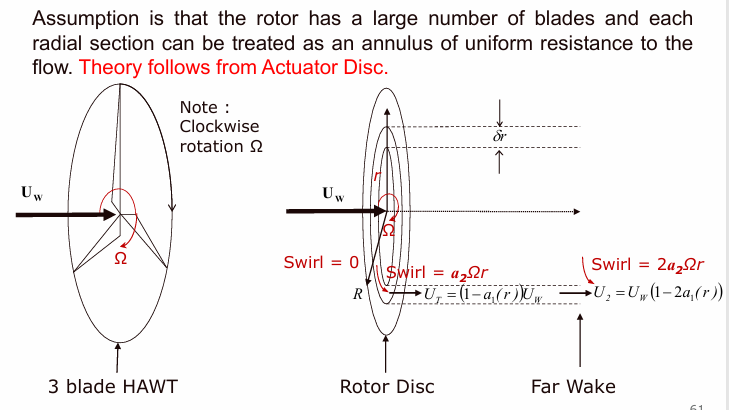
Blade element momentum theory
wind slows & swirls as it passes through the rotor → wake
Offshore wind energy types & locations
high resources north of Europe
Types:
fixed into sea bed ~ onshore
floating platform design (semi submersible)
spar-buoy
Connected to bed with mooring lines
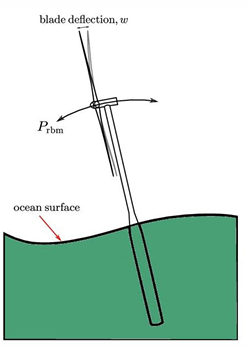
Floating turbine dynamic motion
blade deflection from wind + waves = constantly moving, dynamically loaded system
Offshore wind technology challenges
subsea cables
grid connection / integration
offshore access
offshore logistics installation
turbine foundations
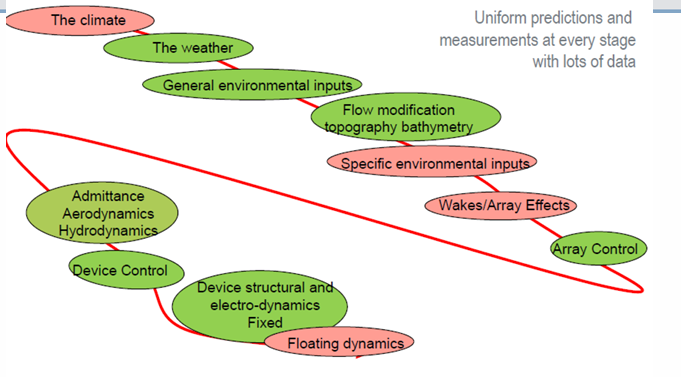
need uniform predictions & measurements at every stage w/ data
Problems for wind energy industry
scaling up: increasing flexibility, gravitational loads, fatigue, control
wake effects in wind farms
offshore deployment (maintenance, fixed or floating foundations, wave loading etc)
public perception: visibility, noise, availability/reliability
sustainability: what to do with massive blade at the end of life cycle
Wind energy development
Onshore (aerospace & commercial) → offshore (fixed & floating) → multi-rotor…
Increase in size & complexity