all quantitative
1/47
There's no tags or description
Looks like no tags are added yet.
Name | Mastery | Learn | Test | Matching | Spaced | Call with Kai |
|---|
No analytics yet
Send a link to your students to track their progress
48 Terms
what is a correlational design
Testing associations of X and Y using a single group of participants (based on observations of what is going on - this naturally occurs)
regression allows for predicitions to be made
how do we prove causation instead of just correlation
you need to manipulate variables to test for causation
what is covariance
how much the variables vary in relation to one another
what is variance
the average amount the data varies around the mean
what is the third variable problem
in correlation you can’t assume causality as there is likely a third variable effecting the outcome that isnt being measured
what is spurious correlations
there is no obvious link between variables but yet a strong correlation is present
e.g. naming your child olivia and how many potatoes grew in that year
What is pearsons r
standard correlation coefficient
continous and parametric
in correlation DOF is N-2
what is R vs R squared
R = correlation coefficient = -1 to 1
R2 = how much the variance in one variable is explained by the variance in the other variable
ranges from 0-1 (0 = there is no explanatory power, 1 is a perfect fit)
what are the non parametric tests
Spearmans Rho and Kendalls tau for correlation
we don’t assume the data is normally distriubuted
how do correlational tests work for non parametric testing
principle of ranking the data - e.g.the lowest score = 1
a similar number of highs and lows between groups suggests dependent variable doesnt differ between groups
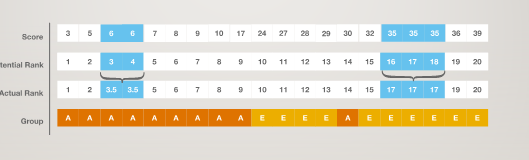
What is Spearmans Rho
pearsons correlation test on ranked ordinal data (does not use raw data)
stronger relationship than Kendals
less sensitive to outliers than Pearsons
E.g. does a high score on X correlate with a high score on Y
What is Kendal’s tau
better than Spearmans for small sample
tied ranks e.g. is there agrrements between observation
E.g. does one judges scores for contestants correlate with the other judges scores
when in PHI used
categorical → correlation between two categorical variables based on chi squared
the chi squared tells us if there is a relationship then look for PHI for the correlation coefficient
ranges from -1 to 1
when both variables are binary (yes/no)
when is point biserial correlational
one categorical (binary) and one continious
looks the same as pearsons but sign doesnt tell us the direction
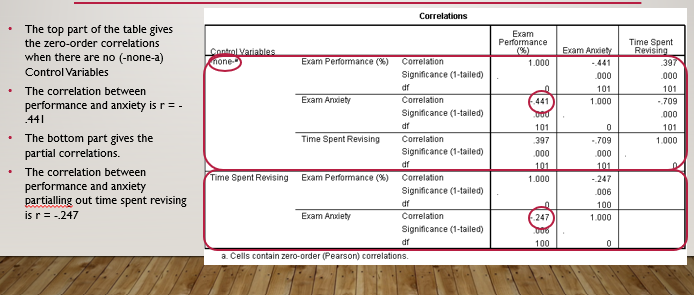
What is partial correlation
Measures the relationship but adjusting for the effect of the third variable (on both variables)
on SPSS the bottom R value gives you the score when controlling for a third variable (e.g. time spent revising)
What is semi-partial correlation
Only applies to regression, remove the additional variance in one of our predictor variables
what is the difference between correlational research and experimental research
correlational = we observe naturally what is going on
experimental = we manipulate variables to test something
What is regression
we make a model to predict the DV using the IV
What is the linear model of regression
Y = b1X + B0
slope (gradient) = B1 → direction of the relationship
Intercept = B0
how do you draw a line of best fit through regression slope
each point will not sit perfectly on the line - this is the residual error
some points are above some are below - these would cancel
so we sqaure them then add → known as SSR (residual sum of squares)
We want a model with this value as low as possible
What is SST, SSR and SSM
SST (total sum of squares) = all the variation in your data, how much it is spread throughout the mean
SSR(residual/error) = variation your model fails to explain
SSM (model) = variation your model does explain → we want this number to be high
SST = SSM + SSR
What is R squared
SSM/SST → how good your model is overall at explaining the variation
what is the F statistic
is the model actually better than just guessing the mean
large F which is sig. model explains more than no model
ratio of how much mean variance can be explained by how much mean error
What are the assumptions of regression
independence
continous dependent variable / continous or categorical independent variable
sample size
Liberal - 15 participants per predictor (stevens)
Conservative = N = 50 + 8m (ivs) (green)
Linearity
Outliers
Multicollinearity
What is a univariate outlier
only present in one variable - one participant varies from the rest → can be seen in box plot/ stem and leaf diagram
what is a multivariant outlier
result from the combinaion of two or more variables
e.g. they are in the same range as the others but their pattern varies
how to find out a multivariant outlier
standerdised residuals, if it is +3 or -3 in the ANOVA spreadsheet on SPSS
Cooks distance - how each individual influences the overall fit of the model → if it is greater than 1 we don’t want that
what is multicollinearity (VIF)
-exists if predictors are highly correleated
VIF - indicates a strong linear relationship → 0.8 and above but we want this less than 10
what is multiple regression
two or more predictor variables and one outcome variable (DV)
what are the two hypothesis driven ways to enter data into SPSS
Forced Entry (enter) - all the variables are entered at the same time → researcher does not decide the order
Hierarchical - predictors are entered based on previous research are entered first then we add the others
good for testing a theory → bad becuase it relies on pre competence of research and researcher
What are the two data driven methods of entry in SPSS
stepwise
we want to avoid this in psychology → only used in exploration research as SPSS will intepret any size difference as importanr
Forward
Backward
what does standerdised beta allow for
comparisions because they are both standard deviations
What is a population?
A population is the collection of units to which we want to generalise a set of findings or a statistical model.
What is a sample?
A sample is a smaller but hopefully more representative collection of units from a population used to determine truths about that population.
What is central tendency?
Central tendency is an indication of the typical scores in a sample and is an estimate of the middle point in the scores; examples include the mean, mode, and median.
What is sampling error and why does it occur?
Sampling error occurs because we are not testing all members of the target population, meaning we are likely to overestimate or underestimate the mean.
How does sample size affect sampling error?
The larger the sample, the more likely we are to measure the extremes of the values, which makes the sample mean more likely to be a good estimate of the population mean.
What is sample error?
Sample error is the difference between the population statistics and the sample statistics.
What is dispersion?
how much variation in a dataset which indicates how much variation there is in the sample.
range, sum of squared error, variance and standard deviations
What is the sum of squared errors?
adding the total squared deviations from the mean to eliminate the issue of positive and negative deviations cancelling each other out.
How is variance calculated from the sum of squared errors?
Variance is calculated by dividing the sum of squared errors by the number of scores to account for the actual size of the sample.
What is the standard deviation?
The standard deviation is the square root of the variance, returning the measure to the original units.
how much the data varies around the mean.
What is the standard error of the mean?
The standard error of the mean indicates how representative the sample is of the population.
What is a sampling distribution?
A sampling distribution is a hypothetical distribution created by selecting an infinite number of samples from a population, calculating a statistic for each sample, and plotting them as a histogram.
Why is a sampling distribution considered hypothetical?
A sampling distribution is hypothetical because we do not have access to the entire population and therefore cannot observe all possible samples.
How does sample size affect a sampling distribution?
Larger samples produce a smaller sampling error within the sampling distribution.
What is standard error?
Standard error refers to the standard deviation of a sampling distribution, specifically the standard deviation of all sample means.
What does standard error tell us about the sample mean?
Standard error tells us how good the sample mean is as a representation of the population mean.