Module 6: Confidence Intervals and Hypothesis Testing
1/19
There's no tags or description
Looks like no tags are added yet.
Name | Mastery | Learn | Test | Matching | Spaced | Call with Kai |
|---|
No analytics yet
Send a link to your students to track their progress
20 Terms
Confidence Interval Definition
a range of values calculated from a sample that is used to estimate where the true population parameter is likely to be.
Point estimate
A single best “guess” (the sample mean/average)
you literally built the confidence interval around it
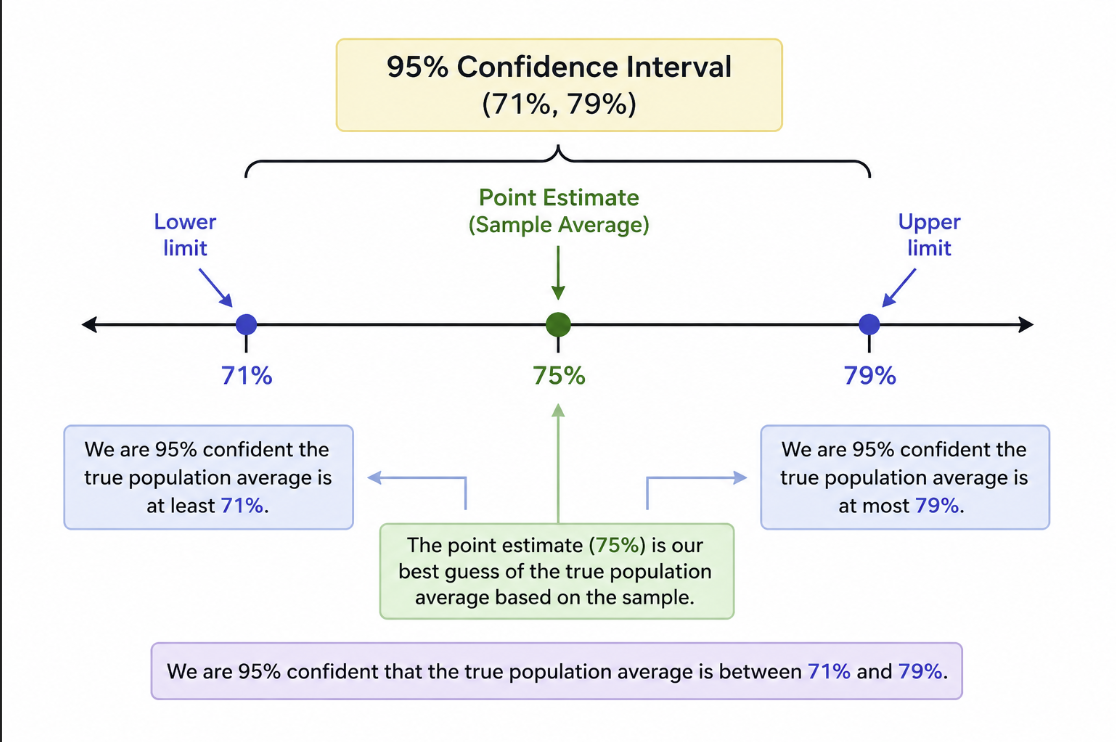
Confidence level
The “long-run” success rate of the interval containing the parameter
is a percentage (e.g. 95%)
tells us that if we sample/ repeat the process many, many times, 95% of the intervals will contain the true population parameters
Margin of error
The “plus or minus” that follows the point estimate
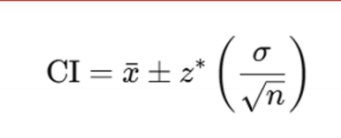
Confidence Interval Formula
Confidence Interval = Point of Estimate (plus or minus) Margin of Error
Confidence Interval Formula for a Sample Leam
z = critical value from the z-distribution
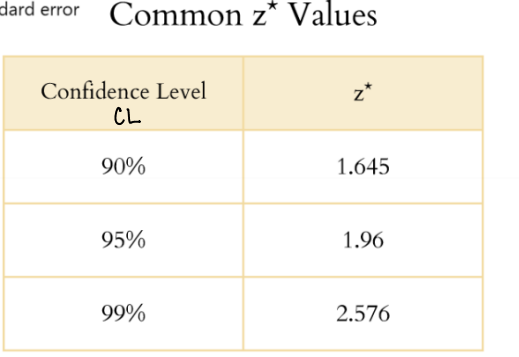
What are common z-values
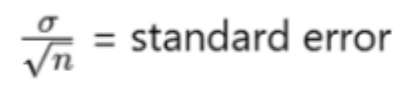
Standard Deviation of Samples / STANDARD ERROR FORMULA
Where is the confidence level usually located under a normal distribution graph
Mainly middle part of graph, the two sides are basically (100% - confidence level) / 2
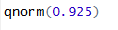
RStudio Section to Find Z-Value
whenever we use qnorm, we are finding whatever is in that z value, DOWNWARDS (to the left of the graph)
In what case do we use the t-value/distribution
when the population SD is unknown
when sample size is small (x < 30) or large (x > or equal to 30)
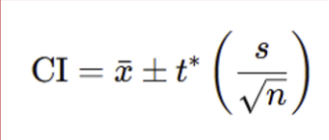
T-value/distribution formula for confidence interval
How to find t value (using R)
find df (degrees of freedom: sample size - 1)
find one of the areas of the normal distribution that the confidence level hasn’t touched
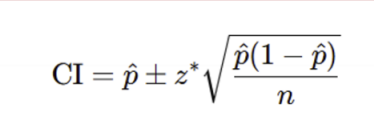
Confidence Interval Formula for a Proportion?
Conditions before using the formula for Confidence Interval for Proportions
sample must be random
n x p is (larger than or equal to 5)
OR n x q (which is 1-p) is (larger than or equal to 5)
Formula for determing how many people (or observations) you need in your sample before actually collecting data
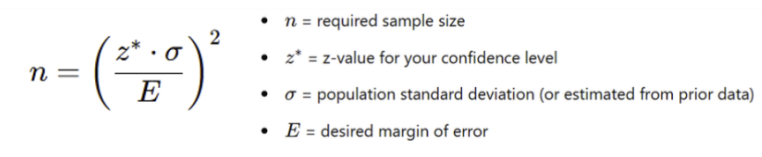
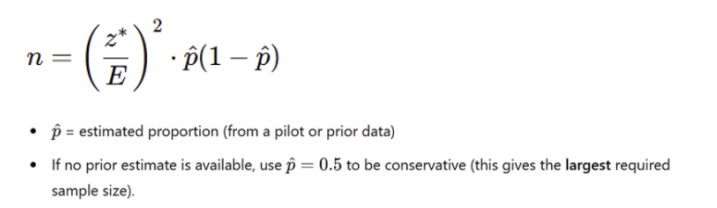
Formula for determing sample size for a proportion (alspo proportion rule - missing or given, whaddya do?)
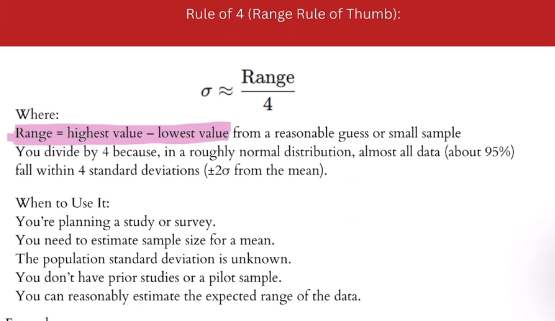
Rule of 4 (Range Rule of Thumb) to find missing SD for Sample Size formula