ECN 102 M1
1/16
There's no tags or description
Looks like no tags are added yet.
Name | Mastery | Learn | Test | Matching | Spaced | Call with Kai |
|---|
No analytics yet
Send a link to your students to track their progress
17 Terms
Explain Cross-Section Data
Data taken on different individuals at one time
Explain Time-series Data
Data taken on the same quantity at different points in time
Explain Panel Data/ Longitudinal Data
Data taken on the same population at different points in time
Explain Repeated Cross Section Data
Data taken on different populations at different points in time
What is involved in Central Tendency?
Mean, Median
What is involved in dispersion?
Standard Deviation, Variance, Kurtosis
What is involved in Symmetry?
Skewness
What quartile does the median lie at? Q1 and Q3?
Median: 50%
Q1: 25%
Q2: 75%
In N(0,1) what does 0 and 1 represent?
0 = mean
1 = standard deviation
What percent is with 1sd of mean, 2sd, and 3sd?
1sd = 68%
2sd = 95%
3sd = 99.7%
What is the coefficient of variation formula?
sample s.d. /sample mean
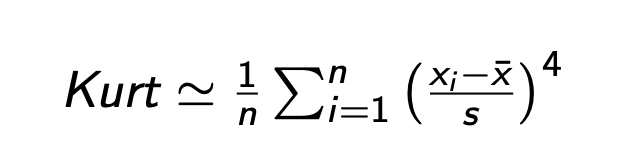
What is the kurtosis formula?
What is the Skew Formula?
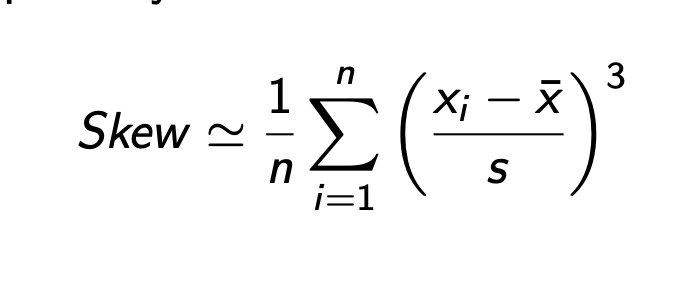
When is data right skewed?
skew>0
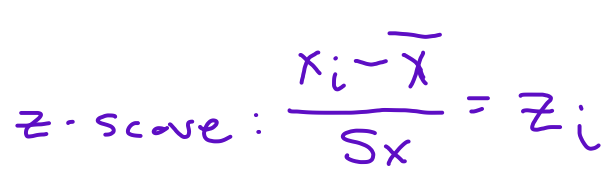
What is the z-score formula?
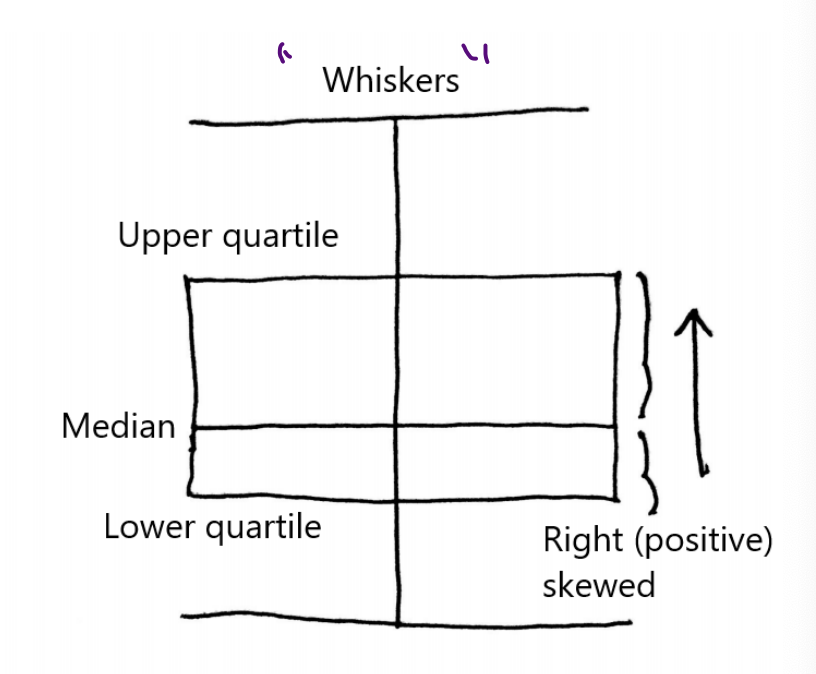
Draw and label a right skewed box plot.
What is lnx used to do?
To make skewed data more symmetric