business analytics quiz 2
1/23
There's no tags or description
Looks like no tags are added yet.
Name | Mastery | Learn | Test | Matching | Spaced | Call with Kai |
|---|
No analytics yet
Send a link to your students to track their progress
24 Terms
Standard deviation
square root of variance
square root of average squared deviations from the mean
how to increase r²
Use more info
Include multiple independent variables
Still only ONE DEPENDENT VARIABLE
So basically, multiple regression models
multiple regression model

time series
a data set where the data were obtained at regular time intervals
ex of time series data: monthly unemployment figures, hourly visits to a website, quarterly sales figures
— these kinds of techniques also known as TIME SERIES ANALYSIS
Casual or explanatory forecasting
set of quantitative techniques
these models usually rely on some kind of regression model to predict a variable of interest based on other variables that are assumed to cause or at least affect it
STATIONARY time series
time series that have a constant mean and a constant amount of random variation around that mean
Key takeaways: MULTIPLE REGRESSION
r² almost always increases
r² never decreases
slopes change depending on model (independent variables are not truly independent, slopes depend on what else is in the model)
interpret in context of full model (always say “in this model”)
when do you suspect multicollinearity ?
when slopes dont make sense
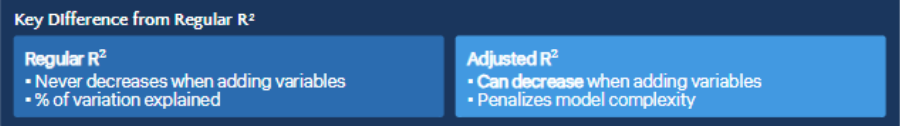
regular r² vs adjusted r²
adjusted r² is a skeptical judge —penalty for using too many variables
how to use adjusted r²
if adj r² inc → the new variable added real value
if adj r² dec → the new variable was just noise
if adj r² stays flat → the variable is redundant
how to determine number of dummy variables
= number of groups - 1
reference group
where both dummies = 0
curve fitting: log transformation
replace x with ln(x)
interaction term =
product of two variables
ex: gender dummy * years