HSCI 310 Final
1/83
Earn XP
Description and Tags
units 4, 5 and 6
Name | Mastery | Learn | Test | Matching | Spaced | Call with Kai |
|---|
No analytics yet
Send a link to your students to track their progress
84 Terms
Greatest problem with QALY
different methods gives different outcome values
Why is QALY important?
Most common measure of health benefit ~ not utility
Critical appraisal is still important (UNIT 2)
issue with alternative for QALY
alternatives like CEA, WTP/CBA etc, aren’t the answer to the issues with QALY they all have their own issues
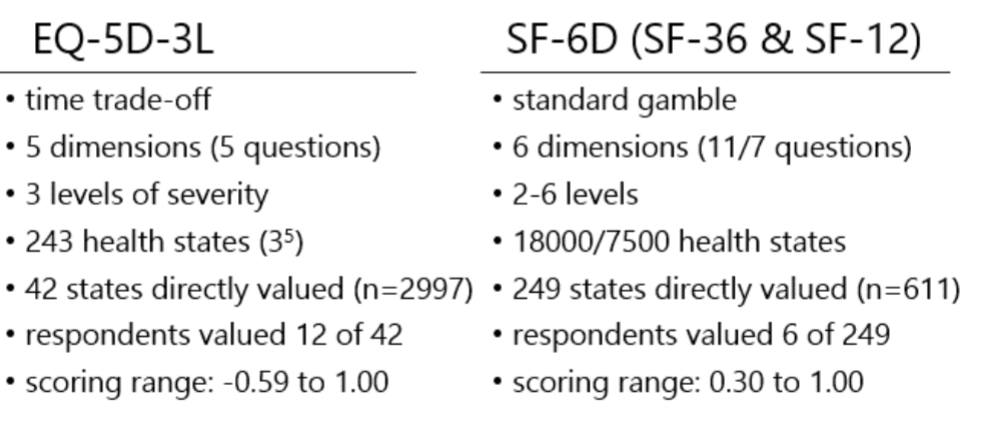
EQ-5D-3L: profile vs index
Profile = 5 dimensions of health measured separately; index = single summary score derived from the profile.
False critique of extra-welfarism
Critics say extra-welfarism (QALY) is too focused on physical health and ignores happiness. But actually, our system lets you include happiness, wellbeing, and anything else you care about. We are more flexible, not less.
deliberate focus on health may overlook broader determinants of wellbeing
Theoretical Challenges with QALYs: are values utilities?
Theoretical challenges with QALYs include debates on whether the values used as utilities accurately reflect individual preferences and health outcomes. Critics question if the QALY framework truly captures all aspects of health-related quality of life, potentially leading to skewed evaluations in health economics.
want economic health evaluation to be broader b/c want to include climate disaster, care givers, still young tho.
bored want new values
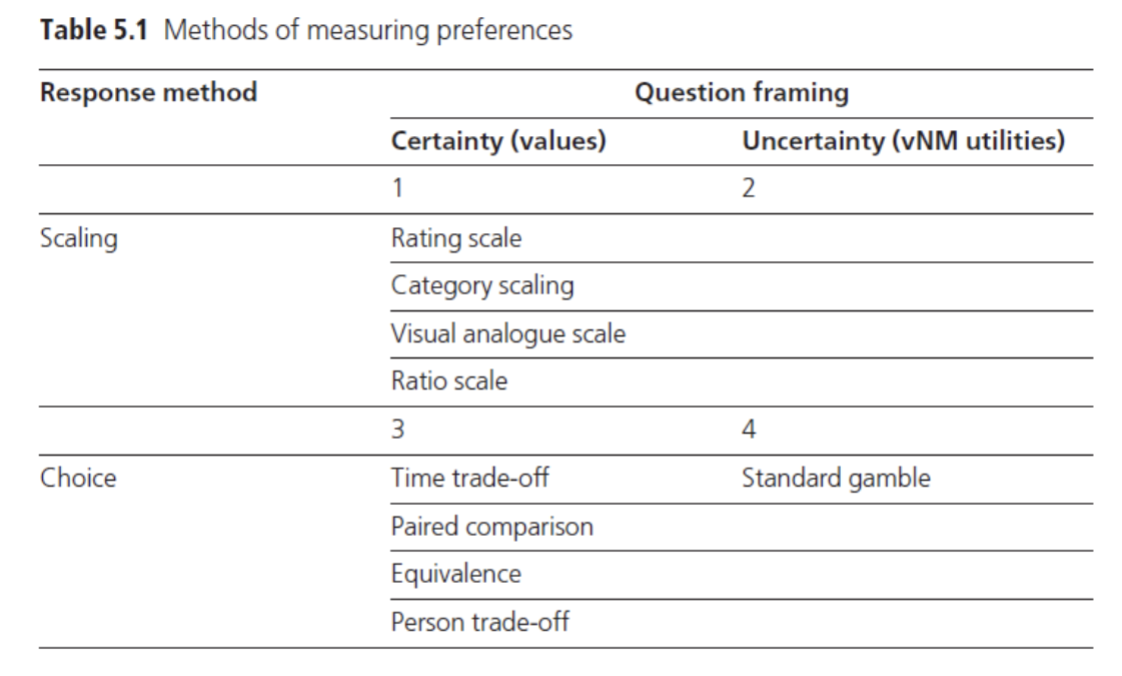
Section off theses methods based off desirable properties (SCALING VS CHOICE VS CERTAINTY/UNCERTAINTY): Rating scale, visual analogue scale, Category scaling, Time trade-off, equivalence, person trade-off, ratio scale, standard gamble, paired comparison
Is a QALY a utility?
are key concepts in assessing whether QALYs can be considered true utilities in healthcare evaluations. Utility independence implies that the value of a health state does not depend on the individual's other health states, while CPPTO (Call Probability for Person Trade-Off) examines how individuals perceive health states in comparisons. Risk neutrality reflects the assumption that decisions are made without concern for risk, further complicating the utility measurement.
need certain values to be considered utility
Methodological Challenges with QALYs
different approaches to get a QALY may lead to varying overall values
Methodological wants in Economic Evaluation
1) generic measurement of benefit
2) enable comparability
two methods to get values ~ indirect vs direct
(hope is so the same values to be produced via QALY regardless of the chosen approach)
Ex. Indirect Measurement
Is realistic method used for Classification system, valuation system for health states that utilize survey methods to assign values to quality of life.
This approach contrasts with direct measurement, which obtains values through direct patient interviews or assessments.
Indirect vs Direct measurements
Indirect just measures based on which description fits best, whereas direct (like TTO) is individual personal responses from assigned values from a sample of population
ideally results from economic evaluations that use different measures should be comparable and different instruments should not be an additional source of variation/uncertainty
Within-Method Examples
shows they share key properties of why they are differences
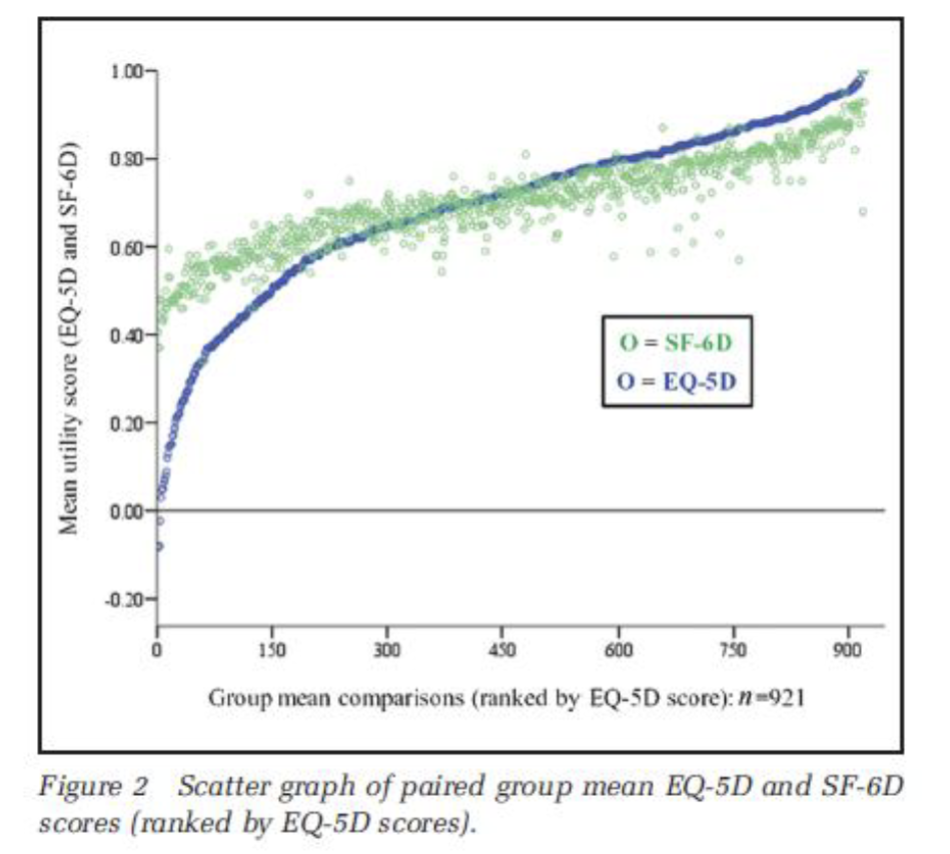
What does this show?
Shows reported mean EQ-5D vs SF-6D and the sample results aren’t the same ~ hard to compare
start (obvious difference b/c different measurements)
end/top range (still a difference even though it should end similarly)
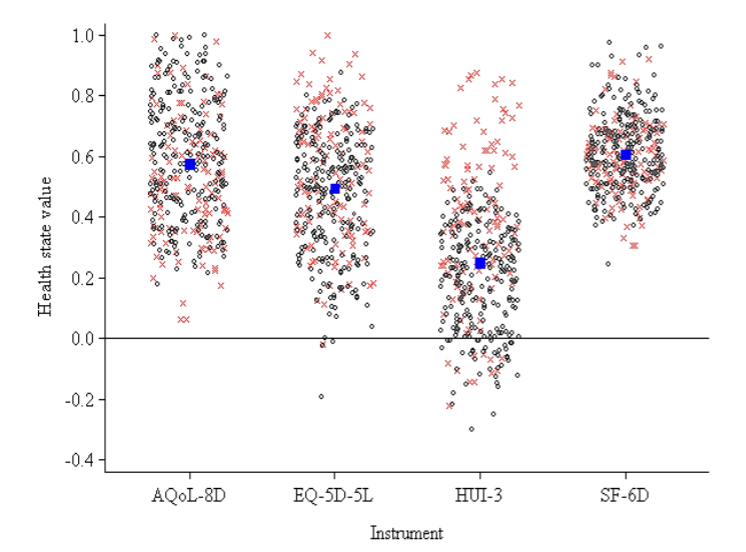
What does this show?
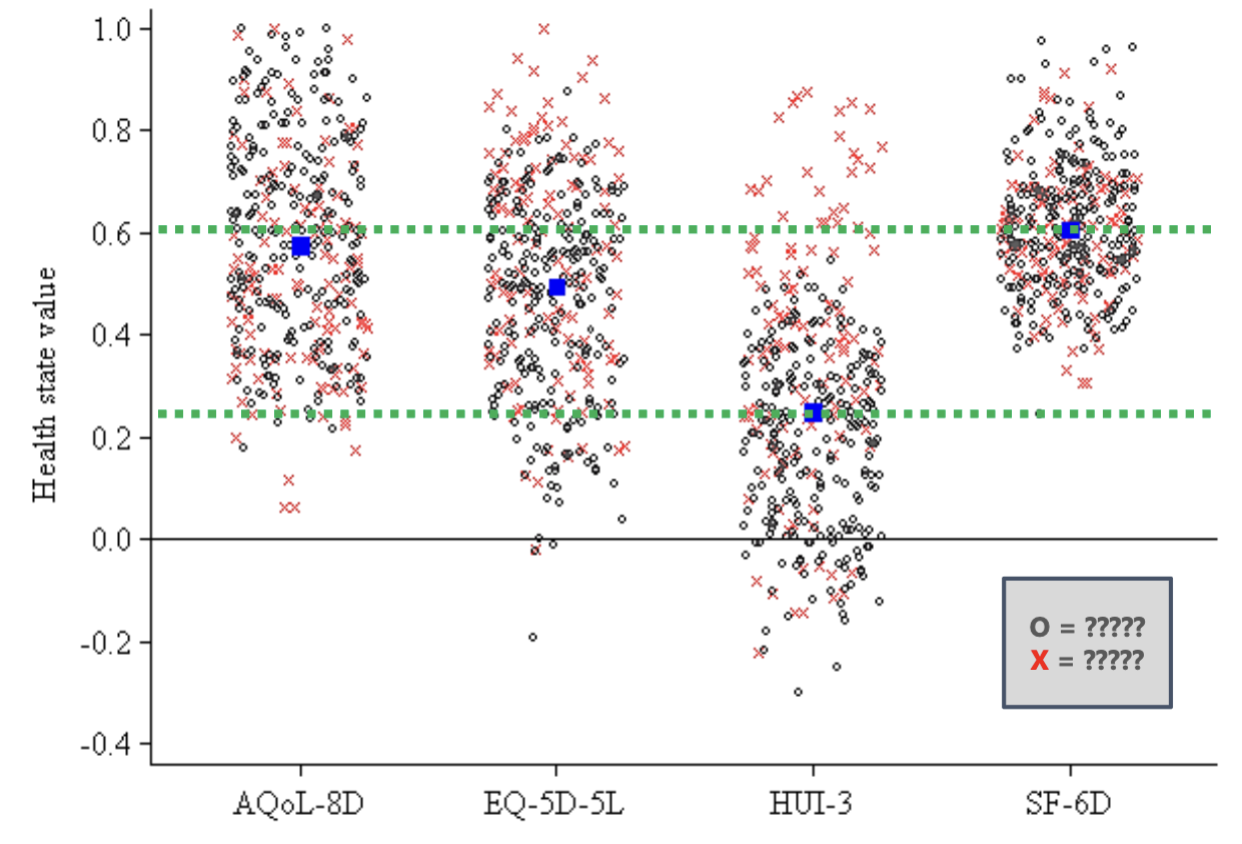
Variation at the Individual-level, four PB-HRQoL instruments
very big differences in index scores, largest between HUI-3 and EQ-5D-5L
SF mean shows how less-sensitive it is
HUI’s mean is significantly lower and more sensitive
x = mobile individual
o = individuals living with spinal cord injury
blue dot = mean
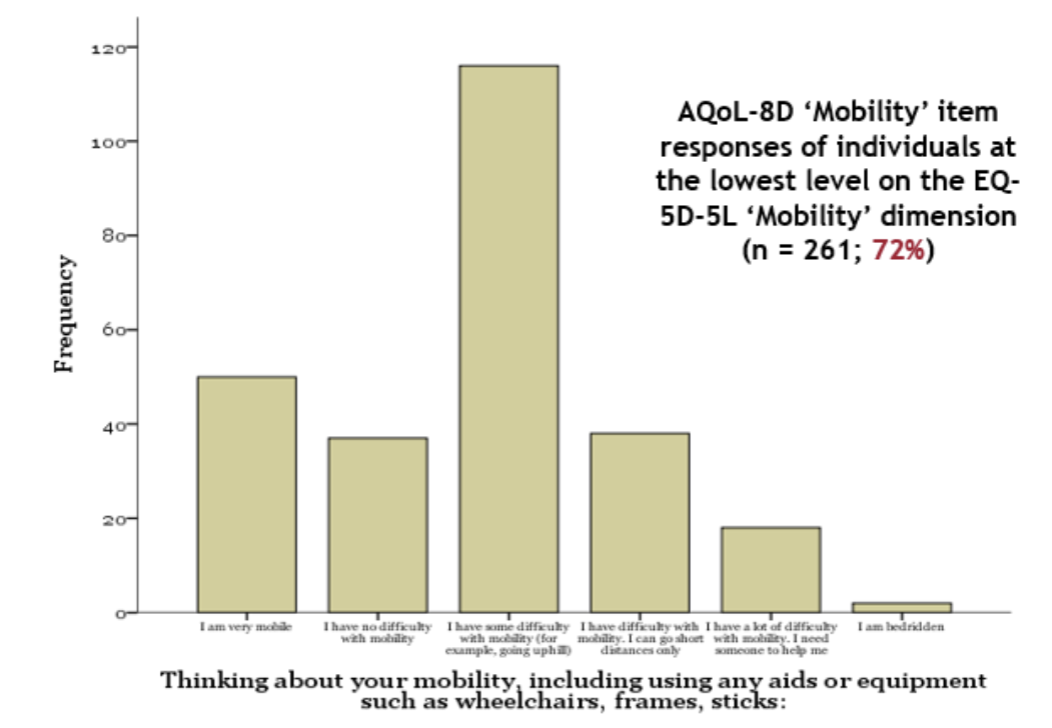
What does this show?
HOW QUESTION ASKED HAS A BIG IMPACT ON VALUE PRODUCED
(based on wording of question and dimensions)
huge separation between X and O explained by: SCREWED
EQ-5D: ‘Mobility’ dimension focuses on the word walking
HUI-3: ‘Ambulation’ dimension also focuses on the word walking
no difference between X and O explained by:
AQoL-4D: ‘Independent Living’ dimension assesses the ability to perform daily activities (no use of the term of walking hence more interpretation)
SF-36: ‘Physical Functioning’ dimension evaluates limitations in physical activities.
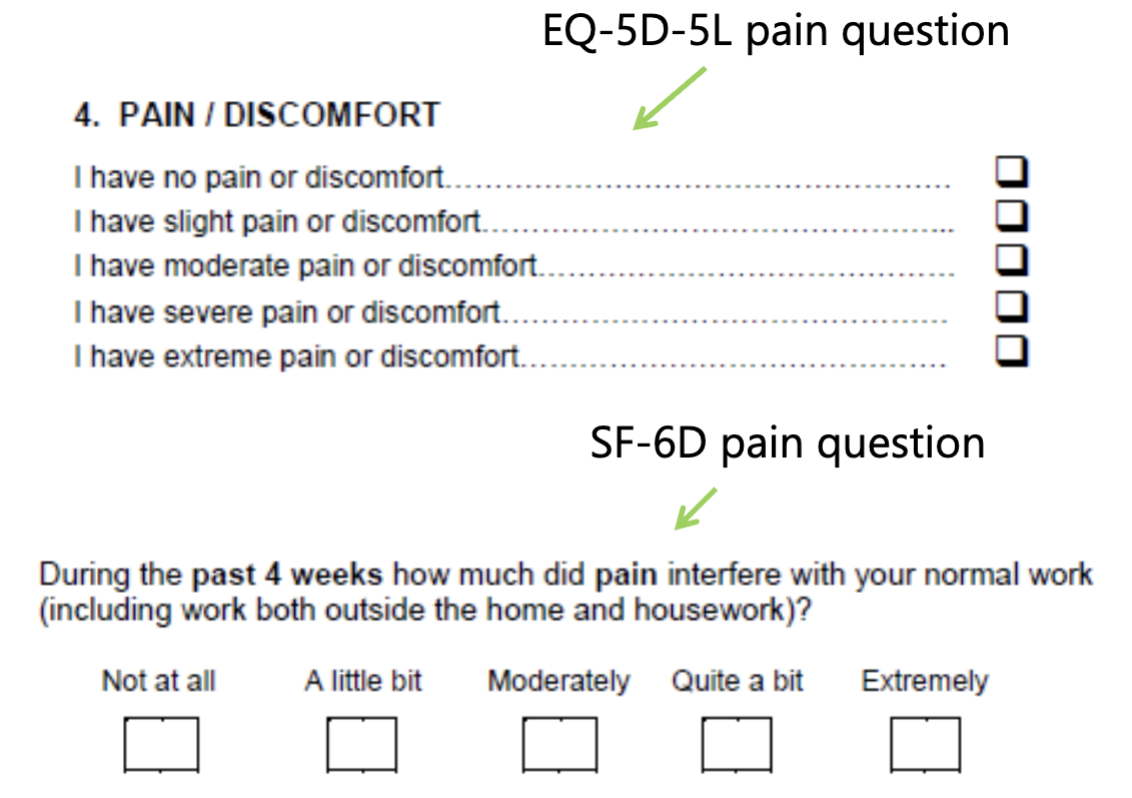
Whats the variability in phrasing for pain related questions in EQ-5D-5L vs SF-6D
No reason why you would get the same answer (ask different things)

Ethical Challenges with QALYs: Whose Values Should Count?
Ethical dilemmas surrounding Quality-Adjusted Life Years (QALYs) involve determining whose health values and preferences should be prioritized in healthcare decision-making and resource allocation.
there is no right of wrong but it will also never be answered
International guidelines say: Community
Community-dwelling individuals vs Patients?
Community:
pros: we all pay so it should be pop preference for allocation (accounted for)
cons: image theoretical (what if your in this health state), it’s not ideal b/c no experience
widely recommended
Patients:
prop: informed population, best proxy, etc
con: health experiences change valuations of what is considered bad (abled may think bad but disabled live it so it’s normalized), could be problematic
Empirical Evidence: Implications of patients health experiences
patients tend to value their health state better than non-sufferers
by patients stating their QoL is high and that the complication doesn’t effect them much, economically this might lead to underestimating the importance of certain health interventions, potentially influencing healthcare resource allocation against the needs of those who are more affected.
make less funding for treatment b/c not that bad since AQoL maxed
if no room to change and no difference in QoL then may not be deemed cost-effective
(if reported QALY is high then intervention won’t show to do much)
Social Representation
Measurement and Valuation of Health in decisions regarding healthcare resource allocation and policy-making.
preferences of the general population
preferences that are representative of the Canadian general population should be used
now we have 80+ scores globally obtained via studies but long ago we just based everything off of UK data (generalized)
Who answers surveys for social representation and do they understand?
usually obtain via panels: where they get a response but less variability (screwed)
able to select specific details out of the people in panels to weed out people such as speedsters
Who may be excluded in social representation?
Older, less educated, less healthy, report difficulties in understanding and completing the task, need longer to complete
what is a valuation creep
Possibility of valuations ‘creeping’ towards 1, a phenomenon where health-related quality of life valuations gradually approach a neutral point, often influenced by age and adaptation to disabilities or chronic conditions, rather than representing actual clinical states.
expectations often diminish with age
disabled individuals may adapt to their condition
similar for patients with chronic conditions
(not a flaw, not asking about of clinical state we are asking about QoL)
What are framing effects
Framing’ issues are important considerations in economic evaluations (esp. CBA & WTP) — Show how difficult it is to attribute indifference in studies
Example applicable to health evaluations…
e.g. open-ended (value) versus closed-ended (range) questions
limitations change peoples response
there is evidence that stated preferences can differ substantially if framed in terms of ‘probability of living’ vs. ‘probability of dying’
signicantly different answers when it shouldn’t be
Equating values to being dead
it is possible to equate to being dead when we don’t know what it’s like (despite having not much to reflect on methodologically)
Differences in the valuation of dead, a qualitative study found that people with certain religious beliefs valued dead at 1.00 rather than zero (subjective)
Would you exclude a respondent who was unwilling to consider health trade-offs?
An individual unwilling to consider health trade-offs may be excluded from studies designed to assess preferences or utilities associated with health outcomes, as their responses could lack the necessary engagement to provide valid data.
Ethical Issues: Should life-saving be the priority?
common argument, and ultimately an futile/pointless objective
a lot of research since the 1970s has focused on the measurement and valuation of QoL
Societal valuation elicited by economists have generally given a positive value to QoL
But we need to perfect studies b/c QoL does matter
“Double Jeopardy”
Where individuals with pre-existing conditions suffer a second misfortune due to their reduced capacity to benefit from life-saving treatment
argument has face validity, but what is the alternative?
“at the end of the day we simply have to stand up and be counted as to which set of principles we wish to have underpin the way the health care system works” — BASICALLY IDK NOT ECONOMISTS JOB
Different Analytic Frameworks
trial-based analyses and decision models
Requirements of EE
Clear idea of the basis of decision making
reimbursement and coverage decisions and formal use creates demand for analytics
They use trial-based to an extend but decision model is favoured
What does healthcare system need to know? Adoption or research decision?
(adoption is central to most reimbursement agencies, used for treatments and such)
EE: Summary arguments #1
Clear statement and measurement of the objective function — BUY AS MUCH HEALTH AS POSSIBLE
• A consistent perspective
• Appropriate specification of the decision problem
EE: Summary arguments #2
Appropriate time horizon — ANTI-TRIAL, MODELS ARE BETTER
• All relevant evidence
• Relevant to the decision context
• Appropriate characterization of uncertainty
(provides the backdrop for a comparison of trial-based analyses and decision models)
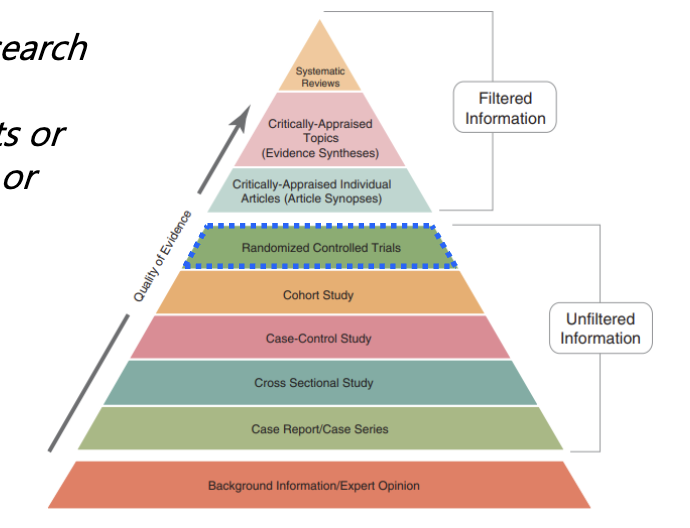
Trial-based EE: Hierarchy of (clinical) evidence
A structured framework prioritizing types of clinical evidence based on quality and reliability, often categorized from randomized controlled trials to observational studies.
critically rank medical studies by their scientific rigor, which is the first step before you can use that evidence to make decisions about whether a treatment is worth its cost
Issues with RCTs (trial)
randomization, intervention + control groups (protocols), primary outcome (same size calculations)
What makes these things so good for RCTs? selling point of trials — realistic
What about for economic evaluations? specificity
Vehicle for the EE — PIGGYBACKING
RCT: ‘Pragmatic’ and ‘explanatory’ trials
‘Pragmatic’ trials focus on real-world effectiveness in typical clinical settings, more freedom
pragmatic is better as, explanatory isn’t worth it if no one follows it (unachievable for community)
make the most pragmatic trial possible
‘Explanatory’ trials aim to assess the efficacy of an intervention under controlled conditions.
(sometimes, these things are out of your control as an analyst)
RCT: ‘Superiority’ and ‘noninferiority’ trials
‘Superiority’ trials are designed to determine if a new treatment is more effective than an existing treatment (intervention > control)
‘Noninferiority’ trials aim to show that a new treatment is not worse than a standard treatment by a specified margin (intervention is no worse than control)
done when intervention is cheaper hence more preferable even though there is no clinical benefit
also done for patient satisfaction reasons
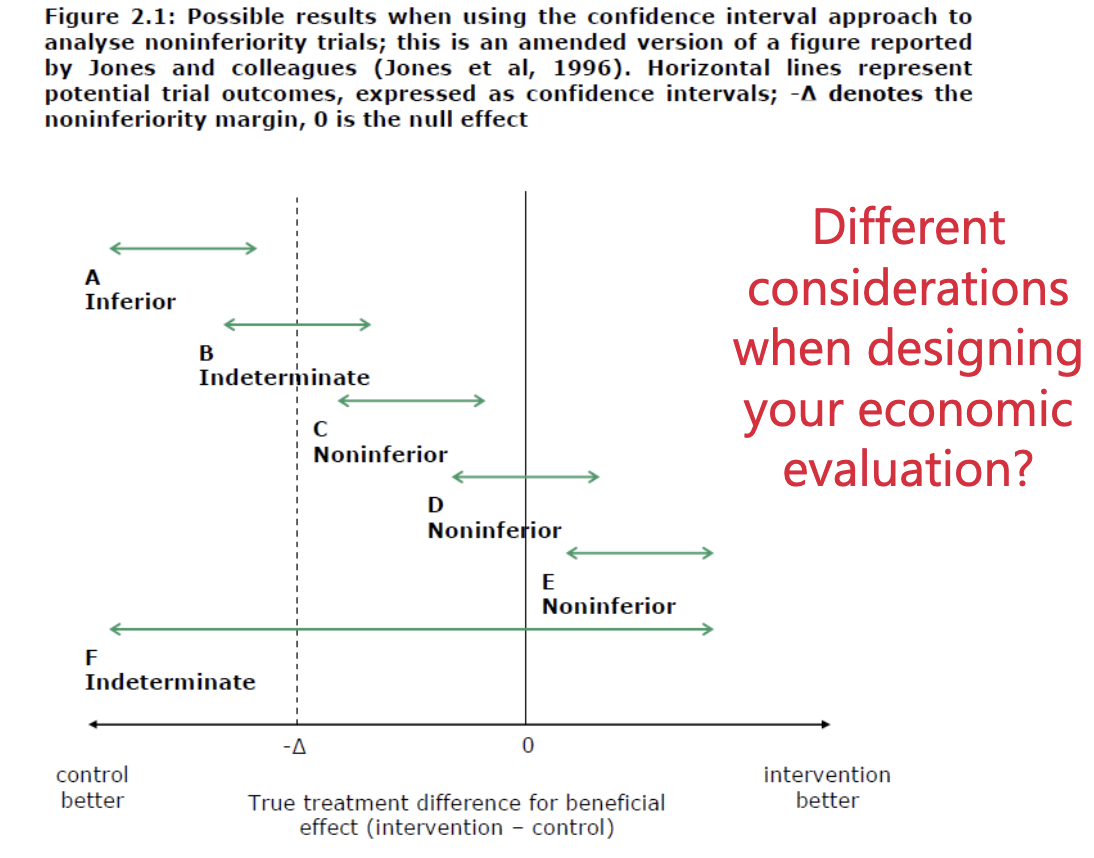
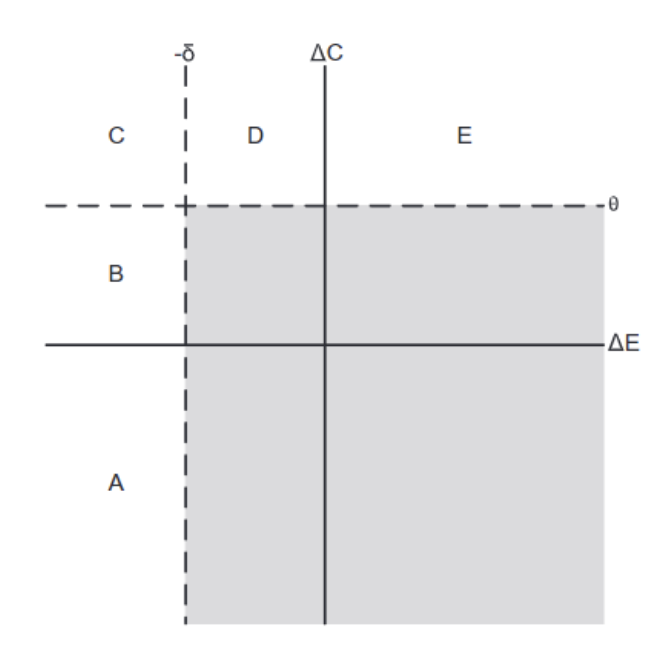
issues with equivalence trials
equivalence trials are when a new treatment and control are tested and show no significant difference in effectiveness or safety between the two treatments.
shouldn’t use as it doesn’t make sense to treat both sides the same
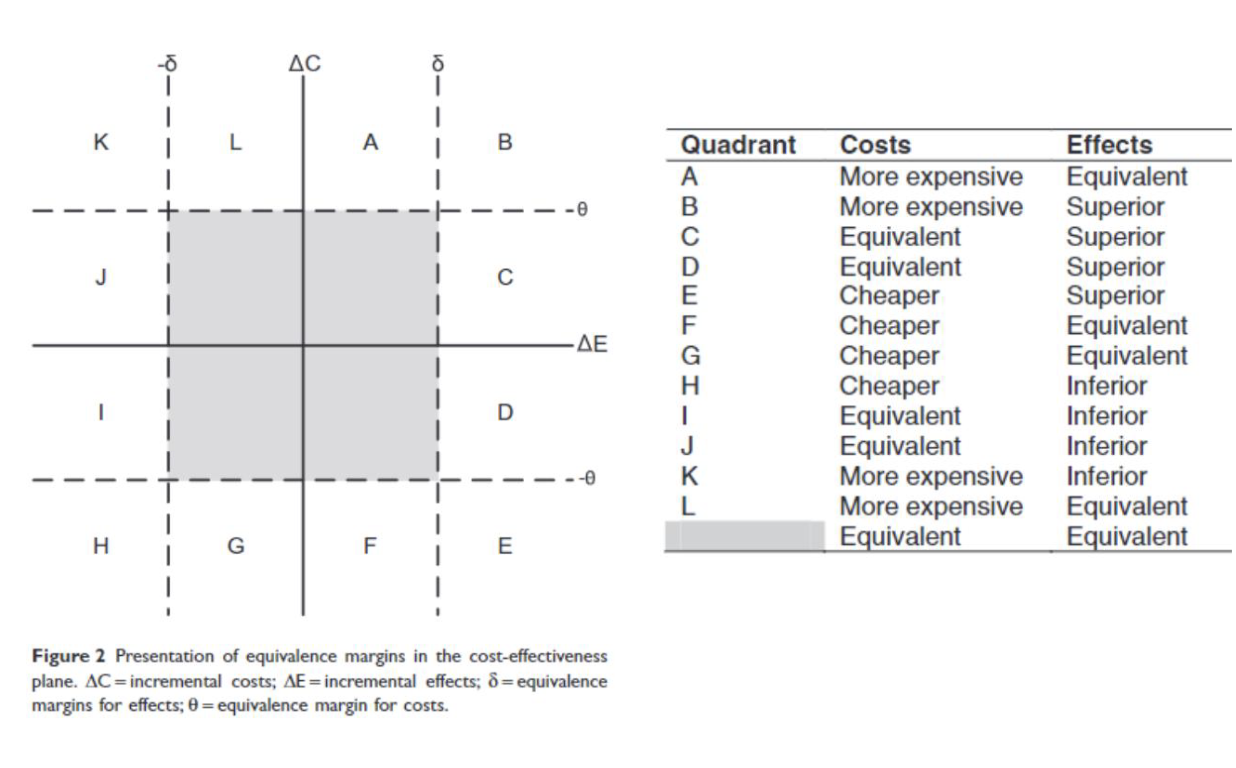
explain
middle is equivalent region between treatment effects of new and control interventions.
explain
What do I think?
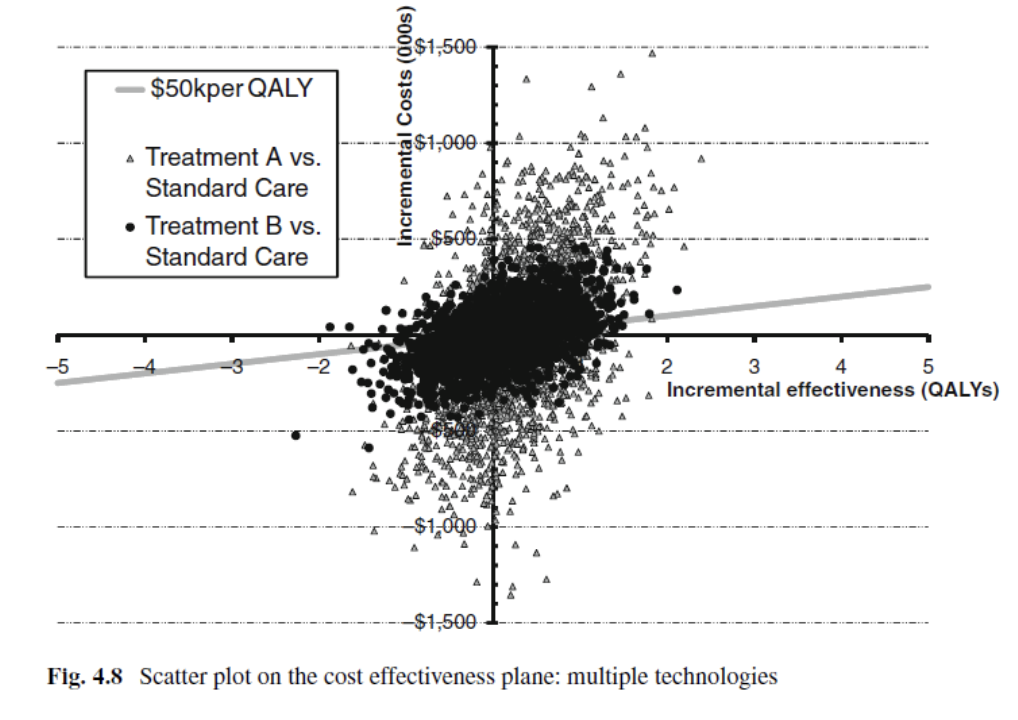
“Determining whether a cost difference or QALY difference is ‘acceptable’ is not the role of the analyst. In a trial-based economic evaluation, irrespective of the clinical findings or RCT design (superiority, noninferiority, or equivalence), an analyst should focus on estimating cost and effect differences and quantifying the likelihood that an intervention is cost-effective.”
is to clarify or describe something in detail, often making it easier for others to understand complex concepts or data points.
the big gap in the bottom right corner is useless as it ignores cost and effect differences (small differences are there)
Decision Analytic Modelling
Decision making under uncertainty using quantitative methods to compare different interventions and their outcomes.
use mathematical relationships to define a series of consequences that flow from a set of alternative options (defines pathways that could occur to individuals)
can go from simple to complex
Scenarios for decision models
simple, one-off decisions (decision trees) SIMPLE
evolving disease processes (Markov models) COMPLEX
etc
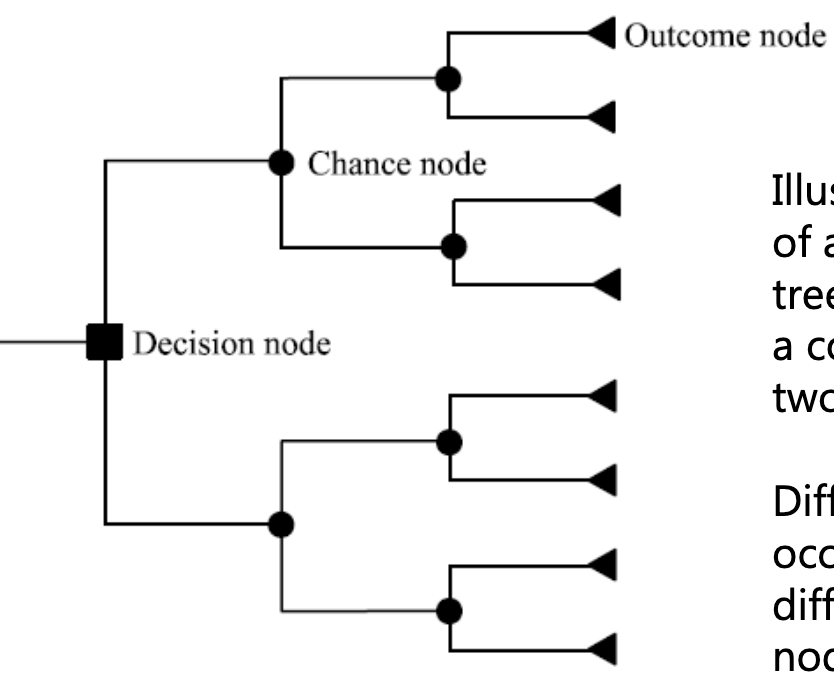
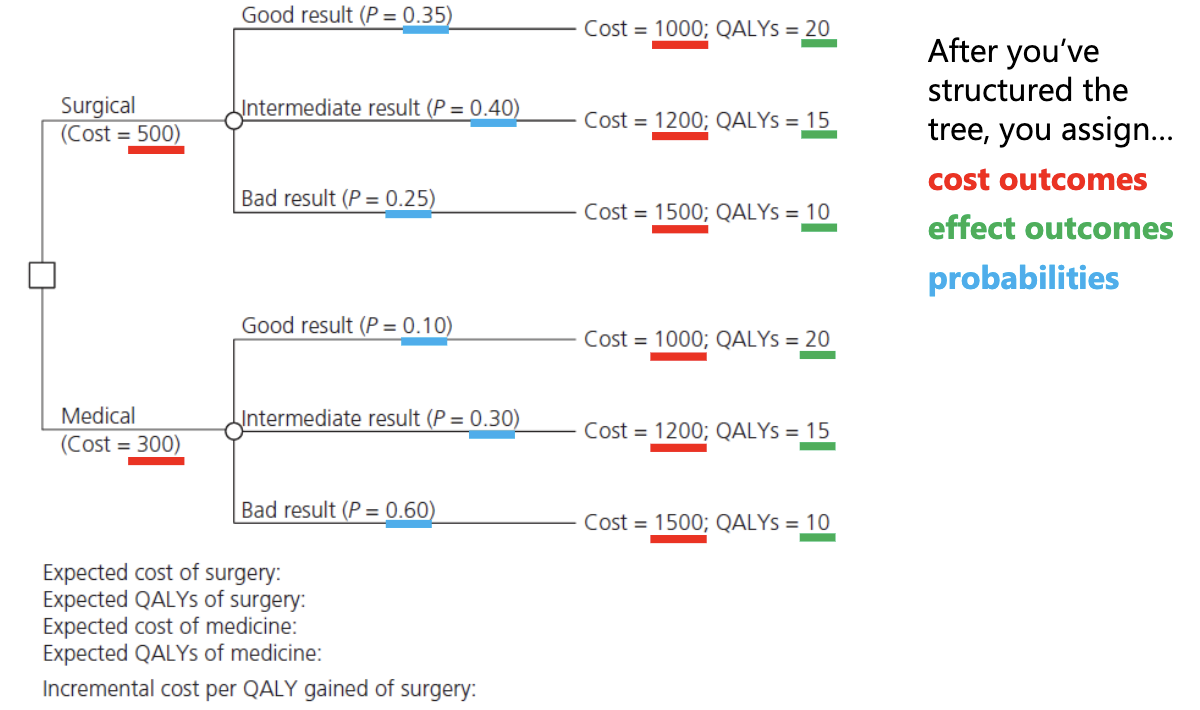
A Decision ‘Tree’ Model
Structure that represents clinical pathways and allows for the synthesis of evidence
simple example: 1) structure the tree 2) estimate probabilities 3) estimate outcomes 4) analyze the tree (incremental senstivity analysis)
what is this an example of
simple decision tree — compares two alternatives
shows different events: square = decision, circle = probability, triangle = outcome
How to analyze the tree model
Work (backwards) from the terminal nodes to the decision nodes
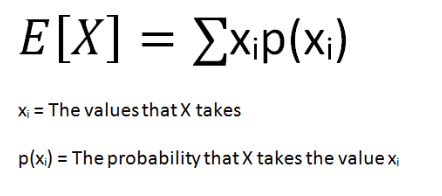
expected values for all strategies
constituent parts of the ICER
Expected’ values (costs and outcomes)
sum of products of the probability estimates for costs and outcomes
Risk Preferences (formula)
Concepts that describe decision-makers' tolerance for risk, typically quantified in utility functions that evaluate outcomes based on their likelihoods and values.
eg. Dice bidding
risk averse = outcome over a gamble with a higher or equal expected value.
risk neutral = indifference
fill out this risk preference tree for probabilities listed
[(effect x probability) + cost]
![<p>[(effect x probability) + cost]</p>](https://assets.knowt.com/user-attachments/5c26a58e-3e91-4b70-9303-c3e35282d9e5.png)
A simple Markov Model
is a mathematical model that represents transitions between states over time, where the future state depends only on the current state and not on the past states. It is often used to analyze possible outcomes in decision-making.
includes: cycle lengths, costs, outcomes, transitions probabilities, time horizon, etc
built model to reflect what could happen — PLAUSIBLE CLINICAL PATHS ONLY
(Helps decision-makers)
explain steps of building this
build model basic model so you can add more stuff later
Problems with Trial-based analysis
Trials generally have atypical patients
Inadequate follow-up period ~ always wish longer
Protocol driven costs and benefits ~ mainly costs can lead to biased results and poorly generalizable findings. Furthermore, they may not account for real-world variations that affect treatment effectiveness.
Insufficient (and/or inappropriate) comparators
Inadequate sample size ~ bigger is better
Problem with Decision Models
Complexity & ‘black box’ concerns
don’t understand model despite evidence, so won’t use b/c model is too complex
Validity of multi-source data (e.g., ITCs) ~ indirect comparisons (DEEMED ACCEPTABLE NOW)
Many concerns relate to synthesis
huge research area (ch.10)
“As soon as the primacy of using all available evidence in decision making is accepted, the analytical issues this throws up are clear.”
Model Golden Rule
models should only be as complex as it needs to be
How Uncertainty is Handled in EE
Statistical Inference
‘Classic’ statistics framework, mean estimates and 95% CIs
CIs problematic economic evaluation
ICER = ratio of two uncertain outcomes
Different ways of getting the same ratio (and equal ICERs ≠ equal ‘value’
Can do but it gets messy and difficult to interpret easily
Sensitivity (BASIC) Analysis
= varying inputs to see impact on outputs
we do this to examine how robust your findings are to variation (e.g., sampling variation generalizability, methodological uncertainty, etc.)
if it does make a effect then it should be known for others
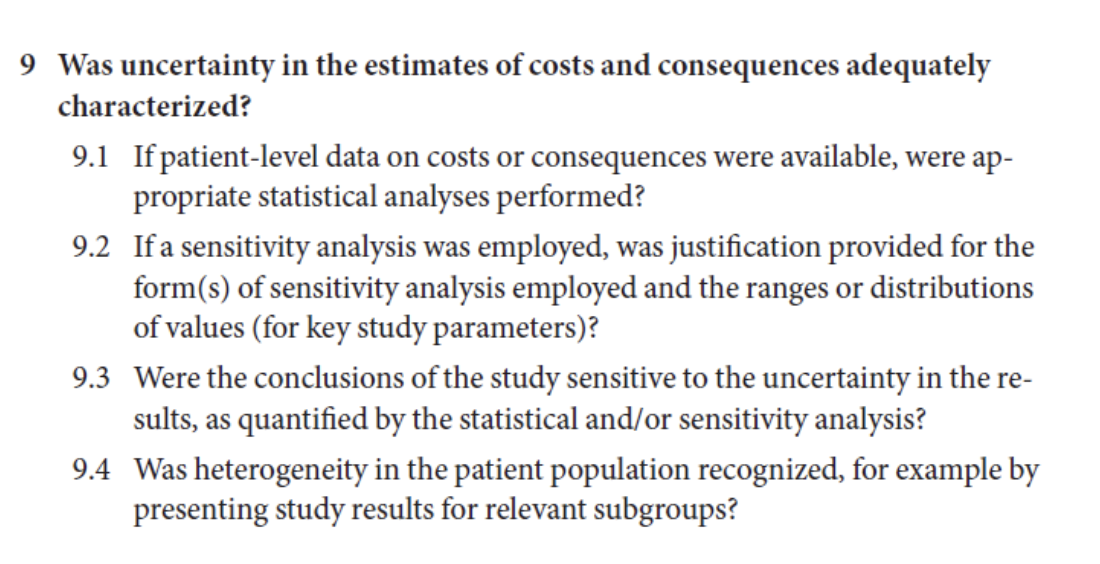
Uncertainty and Sensitivity Analysis on check list (Q 9)
Different types of Sensitivity Analysis (SA)
goes from no uncertanity to probabilistic (uncertain)
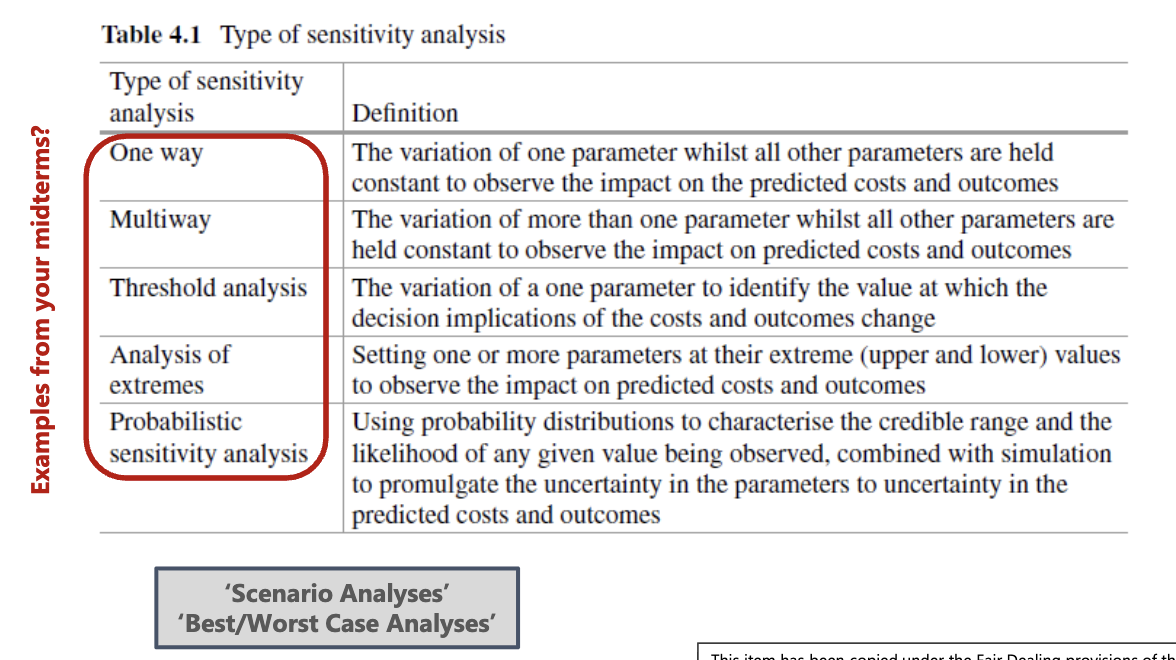
SA: Deterministic Methods pro vs cons
Pros: good to explore some variation
good at being very clear for decision makers
Cons: ceteris paribus is not realistic and may not capture complex interactions (oversimplify)
outdated
explain
about diff types of transportation, little bit of black box
put info in and it spits out results
it shows increase and decrease in parameter depending on impacts considered
SA: Probabilistic/stochastic methods
broader characterization of uncertainty
different methods in trial-based analyses and decision models (but same idea)
explain in terms of uncertainty
there is no reason the degree of uncertainty should be similar for change in costs and effects
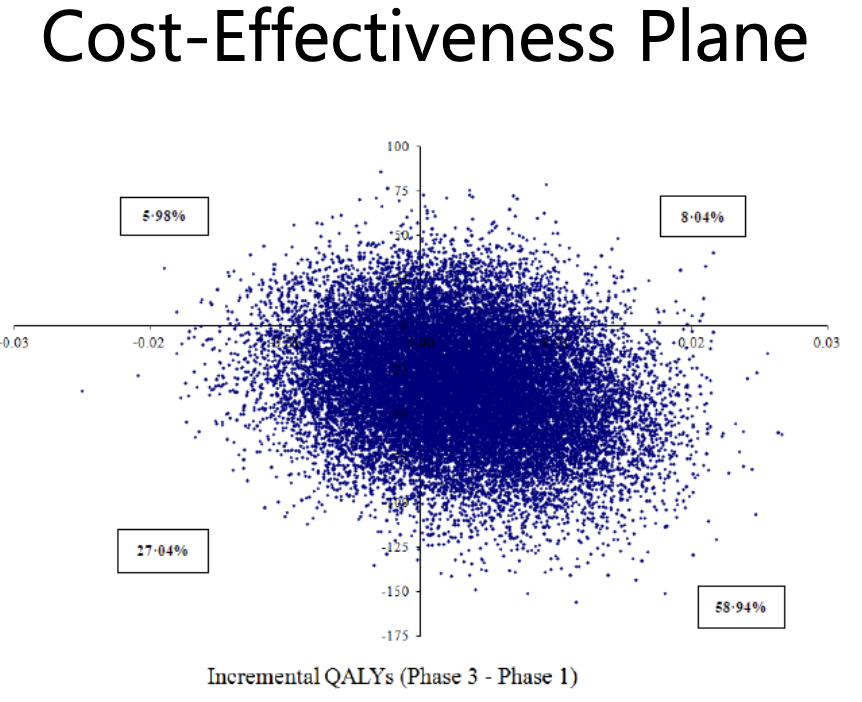
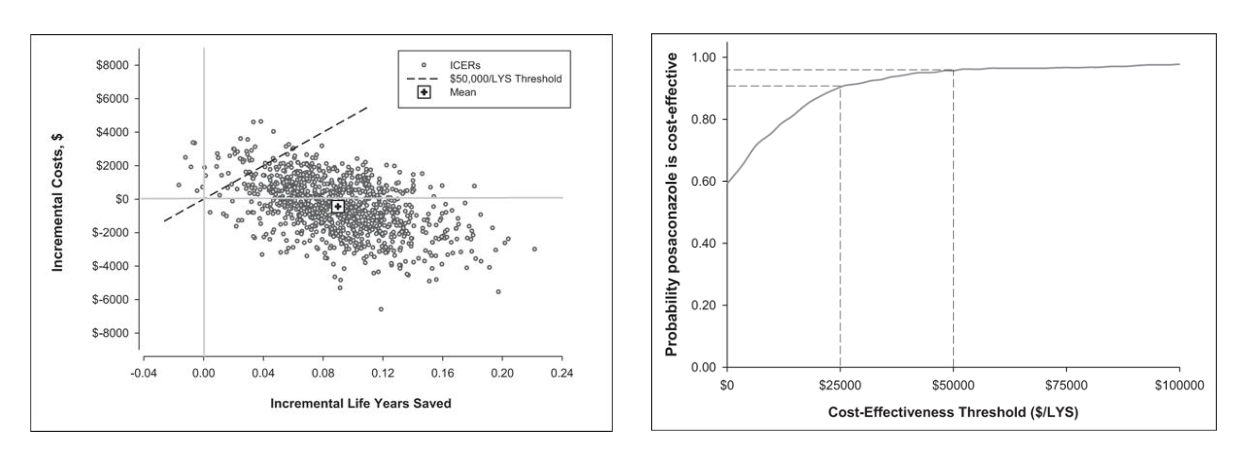
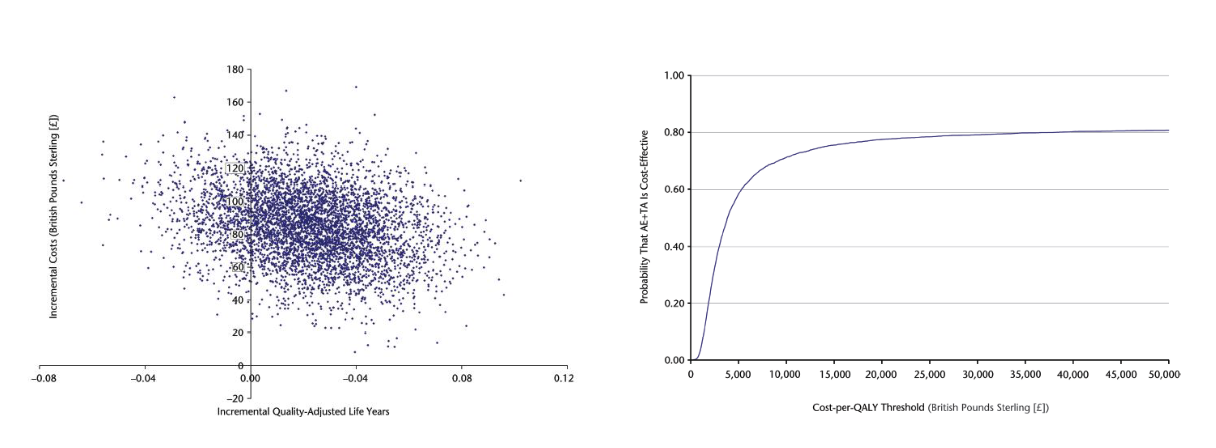
Scatter Plots and the CEP: Decision Models
distributions assigned to all parameters and distribution from which we pick from
draw values for each parameter
run’ the model thousands of time
each run gives you a new (expected) incremental cost and (expected) incremental effect
(run multiple times → scatter plot average)
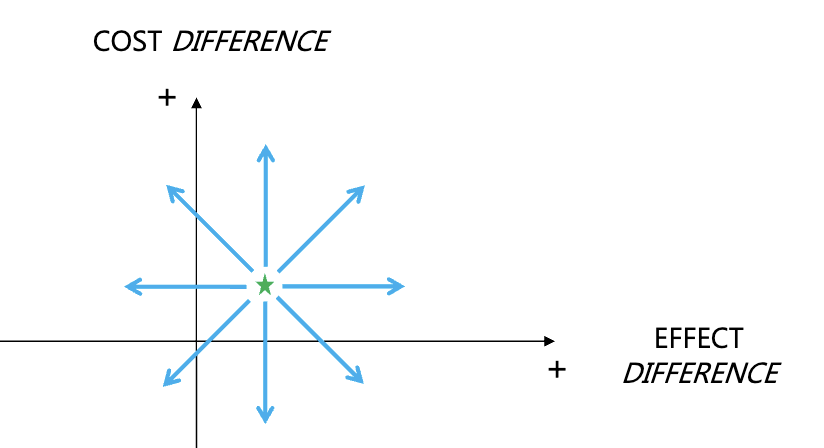
Scatter Plots and the CEP: Cost-effectiveness plane (DM)
Scatter Plots & the CEP: Trial-Based Analyses
similar objective (i.e., replication) — except now on a patient level
‘sampling with replacement’ instead of drawing from distributions
non-parametric bootstrapping
PERSON CAN GET PICKED MUTPLE TIMES
Steps: 1) create a new sample of size n 2) record the same data/run the same analyses 3) repeat this process many times (eg. 5000)
Why is Bootstrapping essential?
b/c if didn’t replace the next sample would be exactly the same as the original as its from the same pool
would just repeat if no replacement
incremental cost and effort would be the same
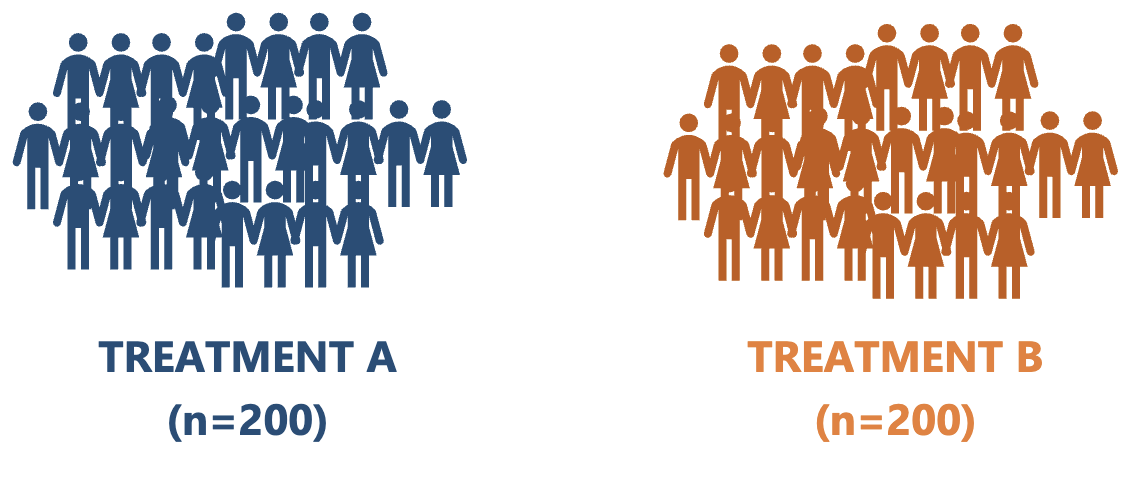
Example of Bootstrap
sample (with replacement) 200 people receiving TREATMENT A and 200 people receiving TREATMENT B
calculate the inc. costs and inc. effect
plot the result on the cost-effectiveness plane
(do this thousands of times)
What does the scatter tell you?
decision makes CEP clearly visually appealing (pretty) but it can get messy so there is some limited use
illustration of uncertainty (qualitative)
considered useful by decision makers
doesn’t quantify the uncertainty
can get messy
Quantifying Uncertainty
Need more than an illustration
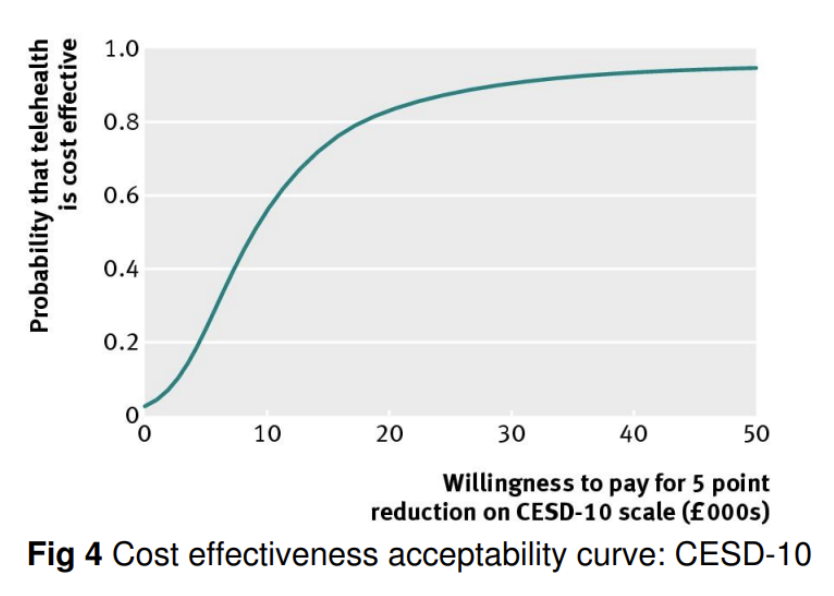
Cost-effectiveness acceptability curves
makes use of data from runs/replications
incorporates previous understanding of the cost-effectiveness threshold (λ)
what does this show
same data is used for acceptability curves
threshold is the line and it shows that anything below it is effective cost wise and informs decision makers on likelihood of cost-effectiveness. It allows for a clearer interpretation of results.
How are CEP scatters and the CEAC linked?
CEP scatters visually represent the uncertainty in cost-effectiveness, while the CEAC quantifies this uncertainty by illustrating the probability of a treatment being cost-effective at varying willingness-to-pay thresholds. Together, they provide a comprehensive view of the decision-making landscape.
What does CEP mean
Cost-effectiveness Plane
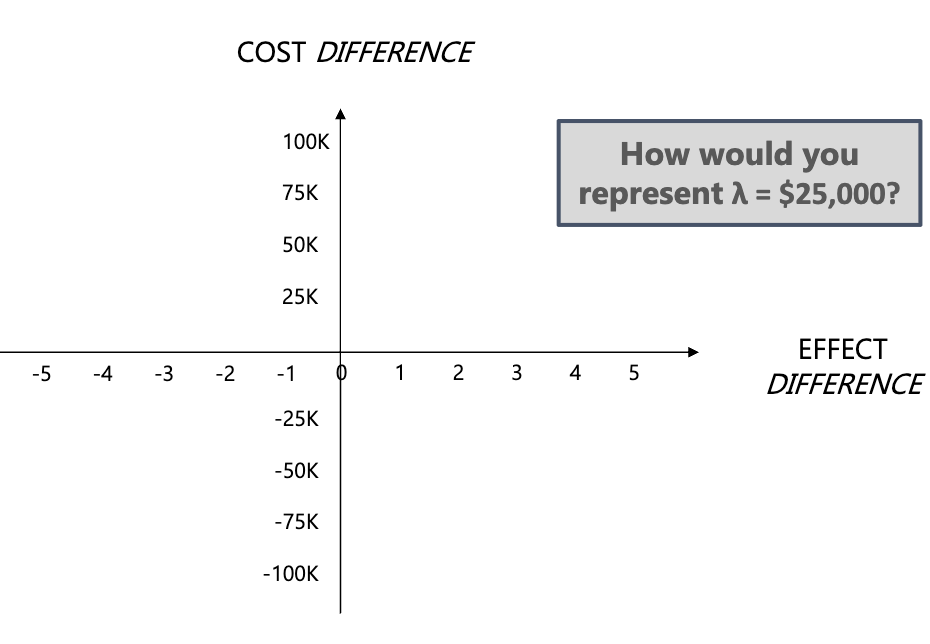
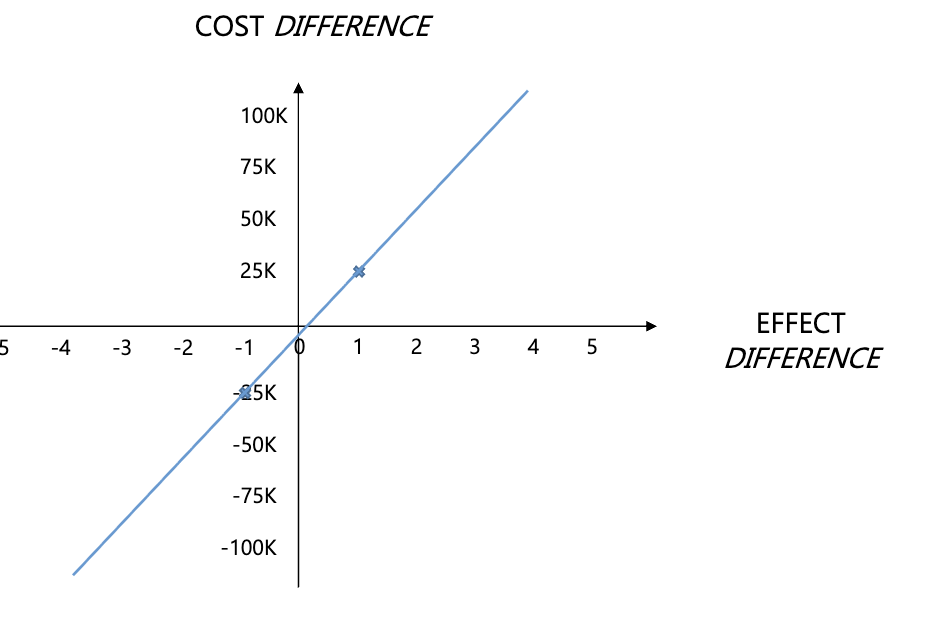
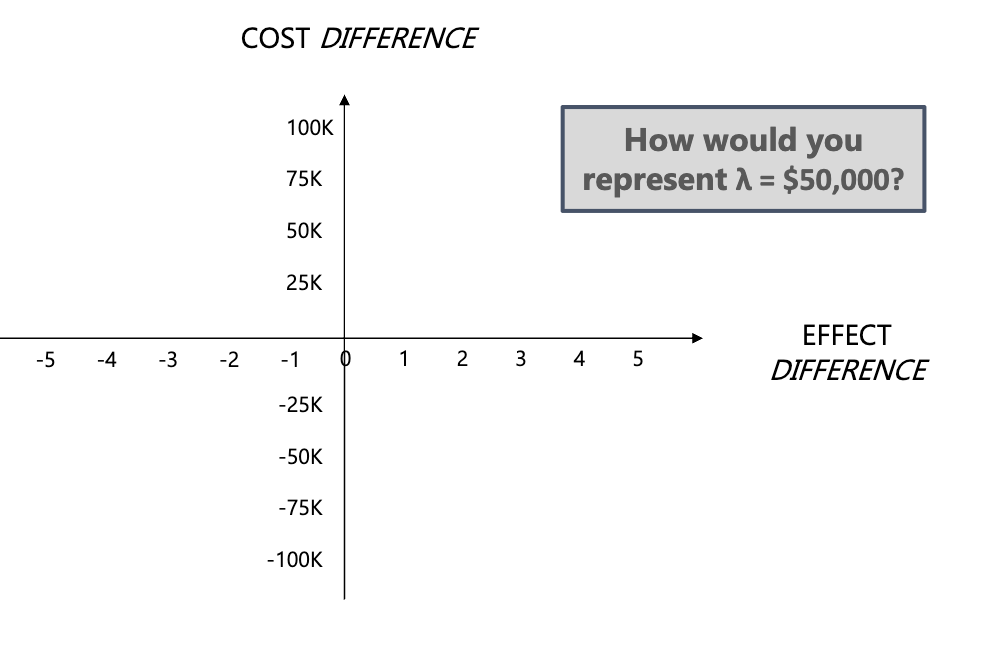
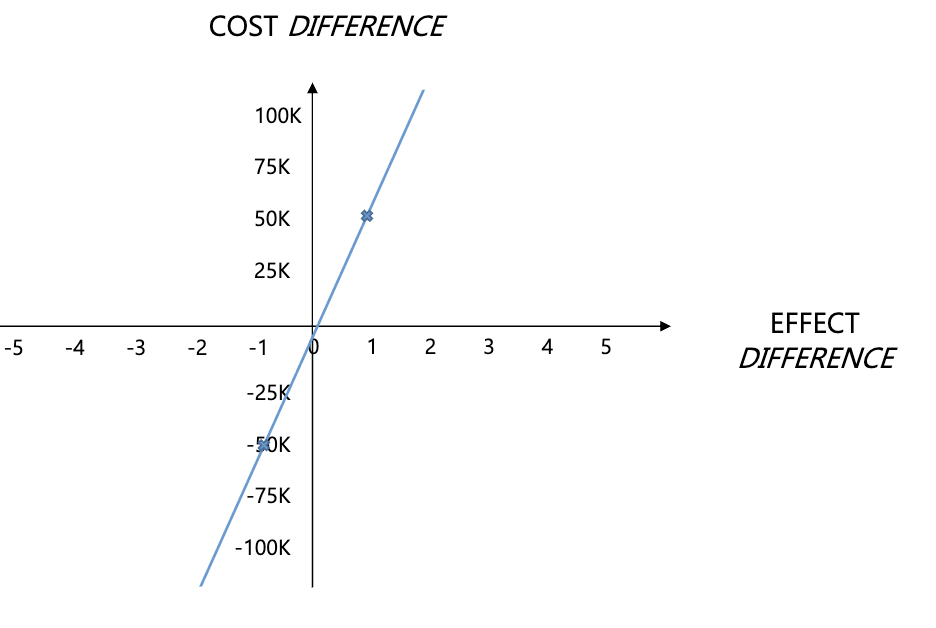
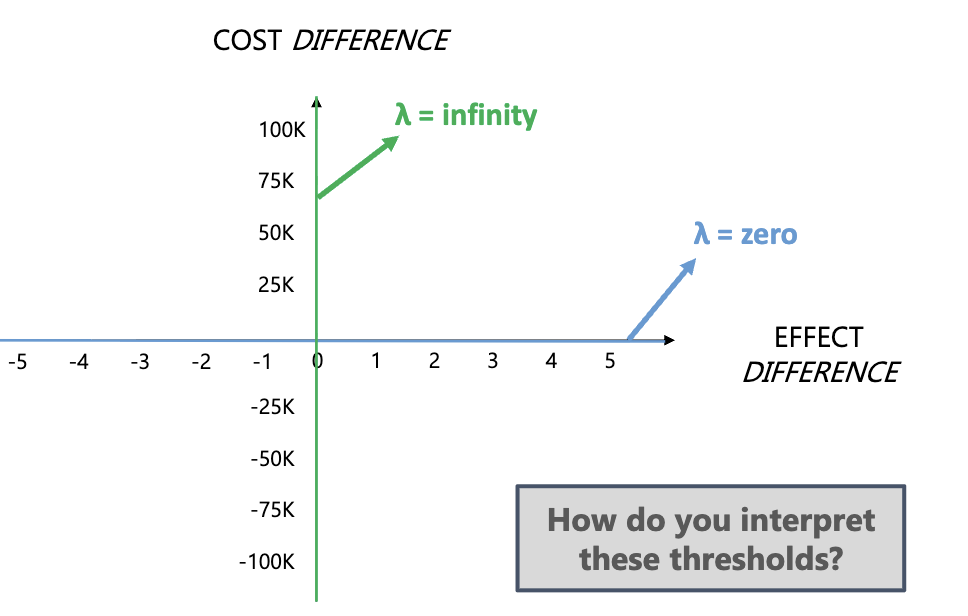
How do you represent a threshold (λ) on a CEP
A threshold on a Cost-Effectiveness Plane (CEP) is typically represented by a diagonal line, indicating where the incremental cost-effectiveness ratio (ICER) equals the willingness-to-pay threshold. Points above the line suggest treatments are not cost-effective at that threshold, while points below indicate cost-effectiveness.
answer this on CEP
How do you represent a threshold (λ) of zero or infinity on a CEP
interpret the threshold by noting that at zero, society won’t pay anything, while at infinity, society will pay anything so its always is cost-effective.
"On a Cost-Effectiveness Acceptability Curve (CEAC), a threshold (λ) of zero means society is unwilling to pay anything for health gains, so the probability of cost-effectiveness is 0%. At an infinite threshold, society values health infinitely, so the probability of cost-effectiveness is 100%—the intervention is always considered cost-effective."

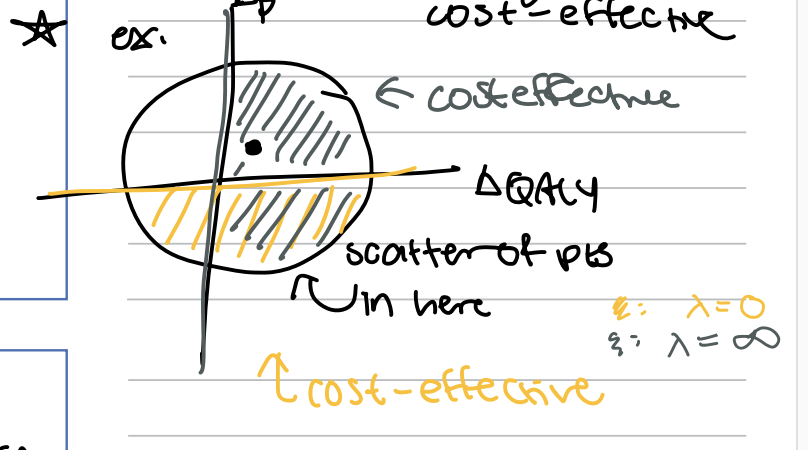
what is CEP Scatters & the CEAC
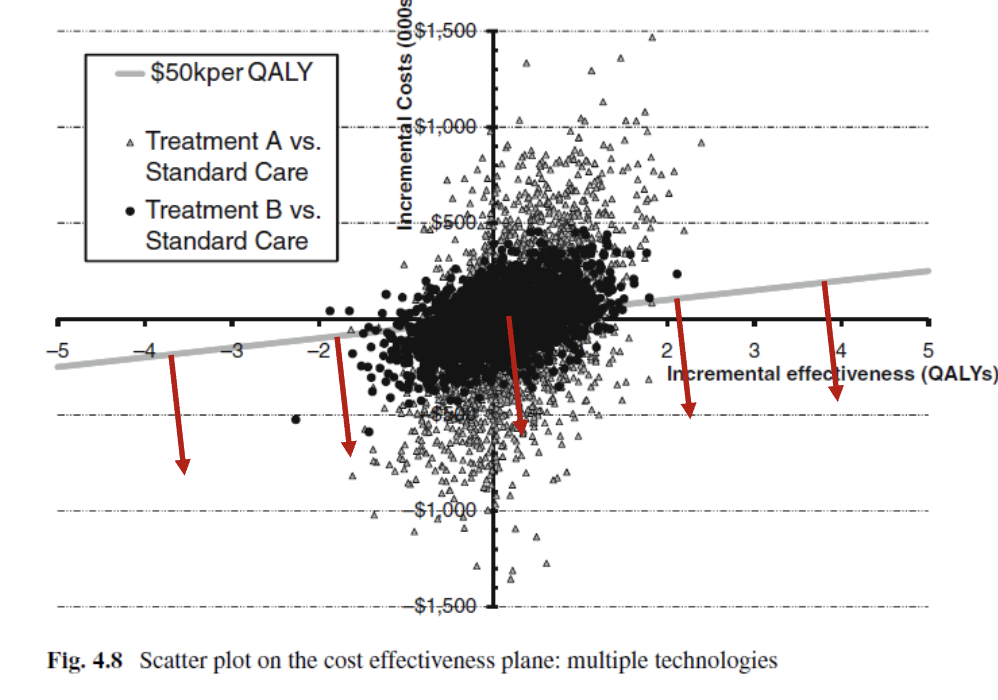
The CEAC is constructed by plotting the proportion of inc. cost and inc. effect pairs that are cost-effective for a range of values of λ
This is the proportion of points falling to the south and east of a ray through the origin with slope equal to λ
Explain
CEAC Interpretation
CEACs tell you the probability that the intervention is cost-effective, compared with the alternative, across a range of λ
In general, CEACs do not give you information about the implementation costs of an intervention (likely to be additional factors to consider)
Question About CEACs: Will a CEAC always begin (i.e., where λ = $0) at a probability of zero?
No, a CEAC will typically begin at a probability of one because at λ = $0$, all interventions aren’t cost-effective.
it does when scatter points are not in threshold region (all replications will be more expensive
Question About CEACs: Will CEACs always reach a probability of 1 (i.e., a certainty of cost-effectiveness)?
No, CEACs may not reach a probability of 1; they reflect varying levels of certainty regarding cost-effectiveness
not all in NE and SE every time
Question About CEACs: Can you figure out what the CEAC will look like if I show you the CEP?
Yes, the CEAC can be derived from the Cost-Effectiveness Plane (CEP) as it visually represents the trade-offs between costs and health effects of different interventions.
EE is Ageist Argument:
productivity (value to society)
pay more throughout life time ~ deserved more coverage now
idea that young basically pay for older population’s healthcare
HOWEVER NOT SET UP AS INDIVIDUAL TAX PAYMENTS
Older are sicker (fairness) so they should be more cared for
less time to show benefits
FALSE
(This argument viewpoint favours older individuals)
EE is not Ageist Argument:
Efficiency focuses on population not individual
costs and benefits (incremental)
QALYs equal out as young hold more long term costs so they equal out with older indivduals