organic analysis
1/46
Earn XP
Description and Tags
tests, spectroscopy, chromatography
Name | Mastery | Learn | Test | Matching | Spaced | Call with Kai |
|---|
No analytics yet
Send a link to your students to track their progress
47 Terms
What is the test for alkenes?
Add orange bromine water to the sample and shake the mixture. Bromine undergoes an addition reaction with the double bond to form a colourless bromoalkane.
Decolourisation of the orange bromine water confirms the sample is an alkene.
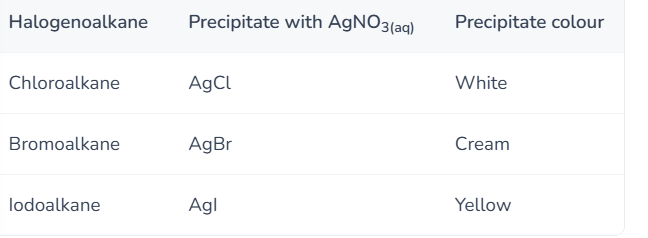
What is the test for haloalkanes?
Add aqueous silver nitrate solution and ethanol to the sample and gently warm the mixture. The halide ion is oxidised to form an insoluble silver halide precipitate.
Observe the colour of the precipitate formed and compare to the known precipitate colours of silver halides.
What is the test for primary and secondary alcohols?
Add acidified orange potassium dichromate solution to the sample. Heat gently for a few minutes. The alcohol undergoes an oxidation reaction to form carbonyl compounds.
If the orange solution turns green, a primary or secondary alcohol was present in the sample.
Tertiary alcohols cannot be oxidised by potassium dichromate so the solution remains orange.
What is the test for carbonyl compounds?
Dissolve 2,4-dinitrophenylhydrazine (2,4-DNPH) in sulfuric acid, water and methanol to prepare Brady’s reagent.
Add Brady’s reagent to the sample and shake the mixture. 2,4-DNPH reacts with carbonyls to form an orange precipitate.
Formation of an orange precipitate confirms the sample is an aldehyde or a ketone.
To identify the specific aldehyde or ketone, you can filter and purify the precipitate by recrystallisation, determine its melting point, and compare to known values.
What is the test for aldehydes?
Prepare Tollens' reagent, [Ag(NH3)2]+(aq), by mixing solutions of silver nitrate, sodium hydroxide and dilute ammonia.
Add Tollens’ reagent to the sample and gently warm the mixture. Tollens’ reagent oxidises aldehydes to carboxylic acids as Ag+ ions are reduced to silver metal.
Formation of a silver mirror inside the test tube confirms the presence of an aldehyde.
What is the test for carboxylic acids?
Add a small spatula of solid sodium carbonate to the sample. Carboxylic acids react with carbonates to form carbon dioxide gas.
Bubble any gas produced through limewater in a second test tube. The limewater will turn cloudy in the presence of carbon dioxide.
If the limewater turns cloudy, a carboxylic acid was present in the sample.
What is the test for phenol?
Add one small spatula of solid sodium hydroxide to a sample. Phenols are weakly acidic and are neutralised by bases to form colourless phenolate salts.
If the solid sodium hydroxide dissolves to form a colourless solution, the sample may be a phenol.
To confirm, add a small spatula of sodium carbonate to a separate sample. Carbonates are weaker bases than sodium hydroxide so they do not react with weak acids like phenols.
A lack of effervescence confirms the sample is a phenol.
What is chromatography used for, and what are the stationary phase and mobile phase?
Chromatography is used to separate the components of a mixture.
The stationary phase does not move.
The mobile phase moves through or over the stationary phase.
What are the stationary phase and mobile phase in TLC chromatography?
stationary phase = solid on the plate
mobile phase = solvent
How are substances separated in thin-layer chromatography?
Substances are separated by their different attractions to the stationary phase and mobile phase.
A substance with a strong attraction to the stationary phase moves more slowly.
A substance with a weaker attraction to the stationary phase moves further up the plate.
What is adsorption in thin-layer chromatography?
Adsorption is when particles stick to the surface of the solid stationary phase.
What is affinity for the stationary phase in TLC?
It means how strongly a substance is attracted to the stationary phase.
Higher affinity means moves less.
Lower affinity means moves further.
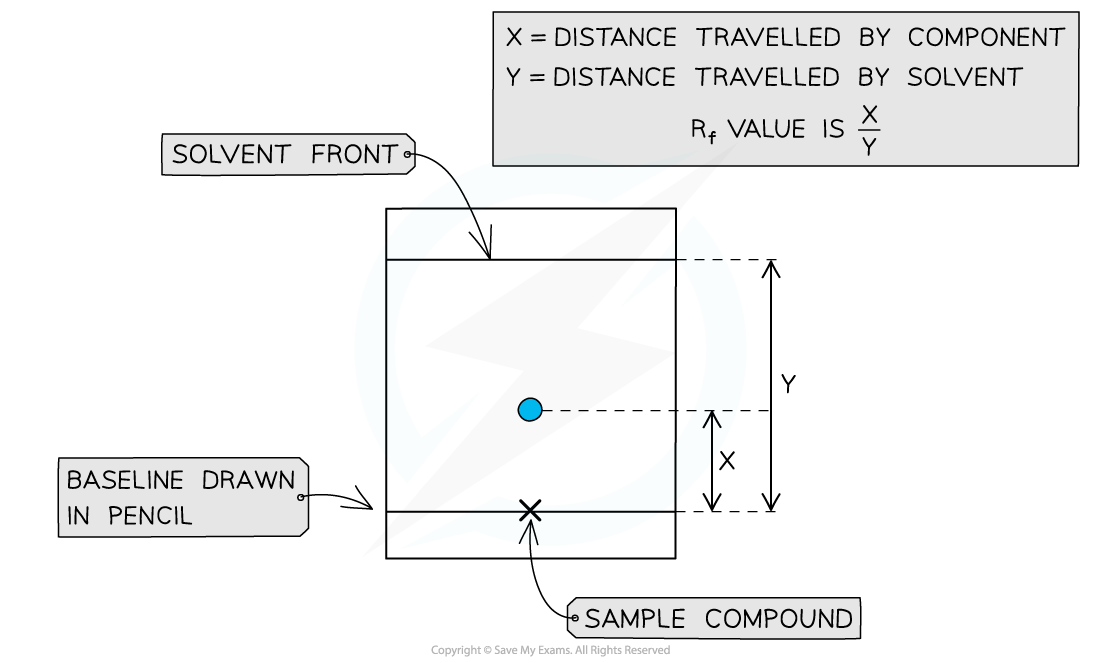
What is the Rf value and how is it calculated?
The Rf value compares how far a substance moves relative to the solvent front.
How is a substance identified using a TLC chromatogram?
Calculate its Rf value and compare it with the Rf value of a known substance (in a database) under the same conditions.
Rf values are specific to a substance but can change depending on the temperature, solvent or makeup of the TLC plate.
What do high and low Rf values show?
Low Rf means strong attraction to the stationary phase, so the substance moves less.
High Rf means weaker attraction to the stationary phase, so the substance moves further.
How can a TLC chromatogram show whether a sample is pure or a mixture?
One spot suggests a pure substance.
More than one spot suggests a mixture.
What are the key points to remember when carrying out TLC?
Draw the baseline in pencil.
Keep the solvent below the baseline.
Mark the solvent front before it evaporates.
Use the chromatogram to calculate Rf values.

Why is the baseline drawn in pencil and why must the solvent be below it?
Pencil is used because it does not dissolve in the solvent.
The solvent must be below the baseline so the sample does not dissolve straight into the solvent.
What is gas chromatography?
Gas-Liquid Chromatography (GLC) is used for analysing mixtures of :
Gases
Volatile liquids
Solids in their vapour form
How does a gas chromatograph work?
A small sample of a volatile mixture is injected into the gas chromatograph.
The mobile phase, an inert carrier gas (ie He) carries the sample through a column.
The column contains the stationary phase, a high boiling point liquid.
Different substances move through the column at different speeds depending on their interactions with the stationary phase, so they leave the column at different times.
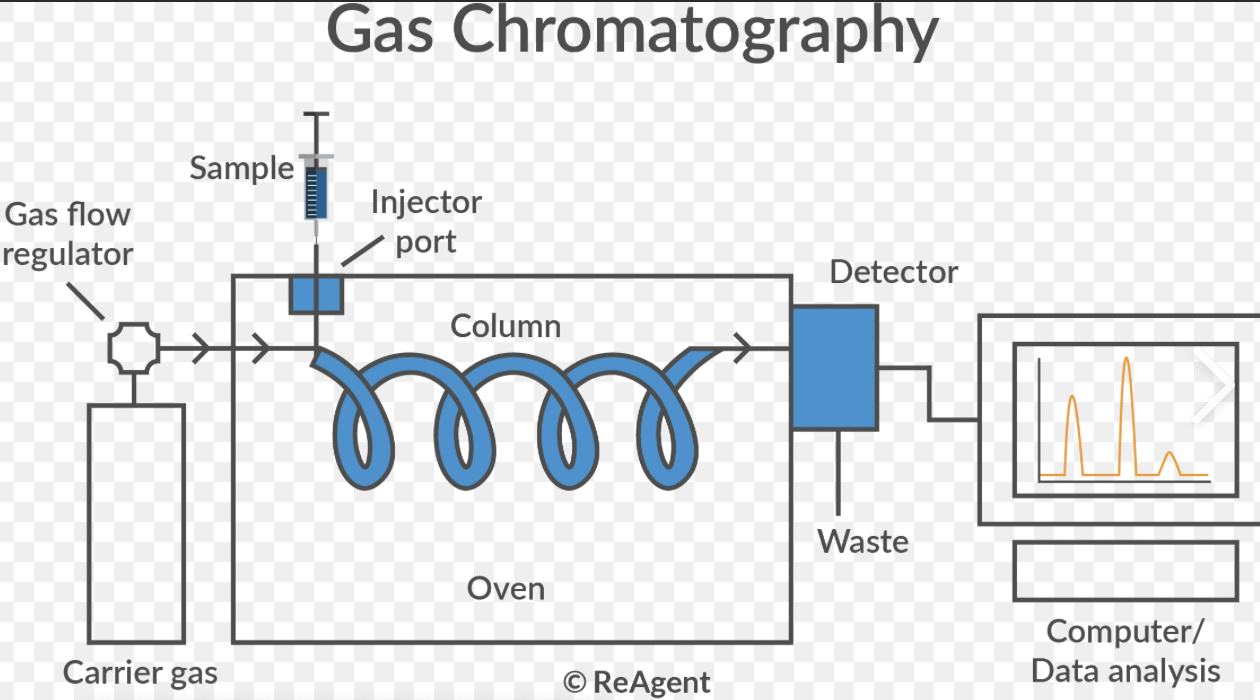
What is the stationary phase vs mobile phase in gas chromatography?
The stationary phase:
This method uses a long coiled column for the stationary phase
Normally a non-volatile liquid is the stationary phase in GLC
The mobile phase
An inert carrier gas (e.g. helium, nitrogen) moves the sample molecules through the stationary phase
What is retention time in gas chromatography?
Retention time is the time taken for a substance to pass through the column to the detector.
What factors does retention time depend on?
Solubility of the sample in the mobile phase - the more soluble the shorter the retention time will be
Temperature of the GC machine - higher temp means the substance will spend more time evaporated so it can move through the tube faster → shorter retention time
Boiling point of sample - higher boiling point means the sample is more likely to travel through the tube as a liquid → longer retention time
How are substances identified using gas chromatography?
Substances are identified by comparing their retention times with those of known substances, using a database - with the same condition etc.
What does a gas chromatogram look like?
Each peak represents a different substance.
The retention time helps identify the substance - measure from 0 to top of peak.
The peak area shows the amount of the substance present.

How are the proportions of substances in a mixture found from a gas chromatogram?
By comparing the peak areas.
Percentage of substance X = (peak area of X / total peak area) x 100.
How is a calibration curve used in gas chromatography?
Calibration curve (GC):
👉 Run the same substance at known concentrations
👉 Record their peak areas
👉 Draw a graph:
peak area (y) vs concentration (x)
👉 For the unknown:
Find its peak area
Use the graph to read off the concentration

What is one limitation of identifying substances by TLC or gas chromatography?
Different substances can sometimes have the same or very similar Rf values or retention times, so identification may not be certain from one result alone.
What is gas chromatography used for?
Analysis of urine or blood samples for drugs
Art restoration - analysis of paint/pigments
How do you determine the number of carbon environments from a carbon-13 NMR spectrum?
The number of peaks represents the different carbon environments.
Each unique carbon environment (with different bonding or surroundings) shows a separate peak.
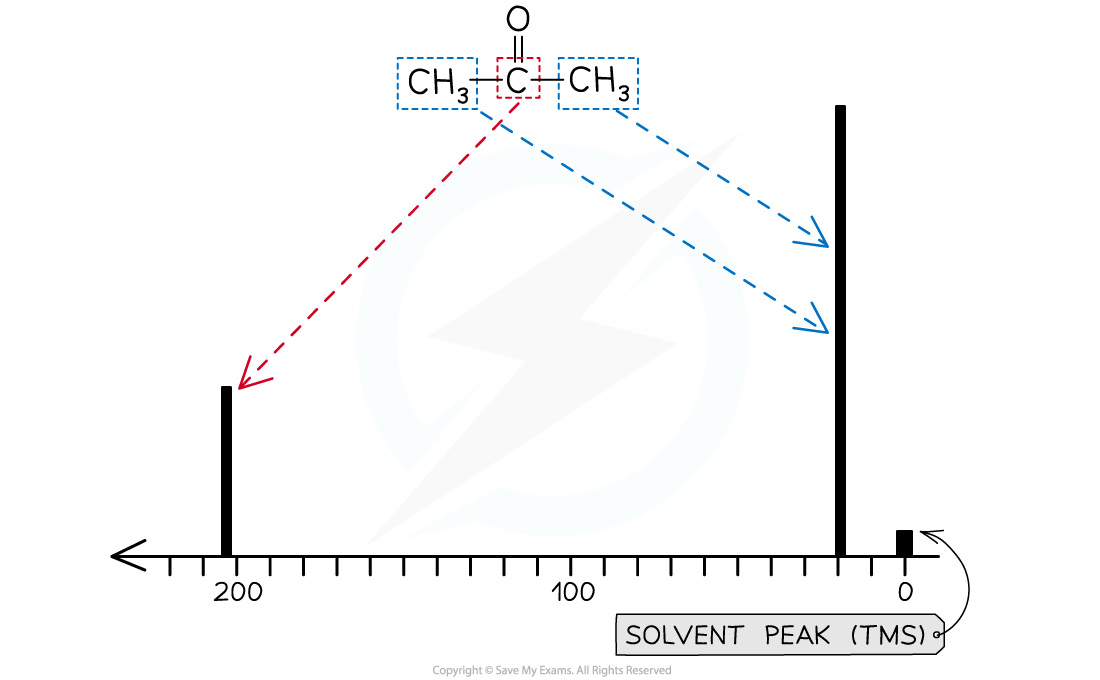
What do the chemical shifts in a carbon-13 NMR spectrum tell you?
The chemical shift indicates the type of carbon environment.
Peaks at different δ values correspond to different types of bonds (e.g., C–C, C–Cl, C–C=O).
How do you determine the number of proton environments from a proton NMR spectrum?
The number of peaks indicates the different proton environments.
Each unique proton environment gives a distinct peak.
What do chemical shifts in proton NMR spectroscopy represent?
The chemical shift tells you the type of proton environment (e.g., alkyl, alkene, aromatic).
How are integration traces used in proton NMR spectroscopy?
Integration traces show the relative number of protons in each environment.
The area under each peak corresponds to the number of protons contributing to that peak.
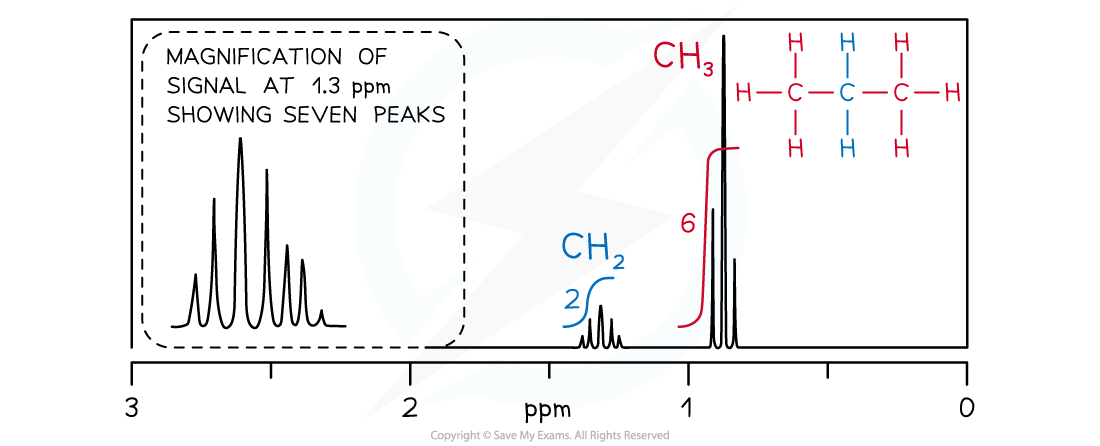
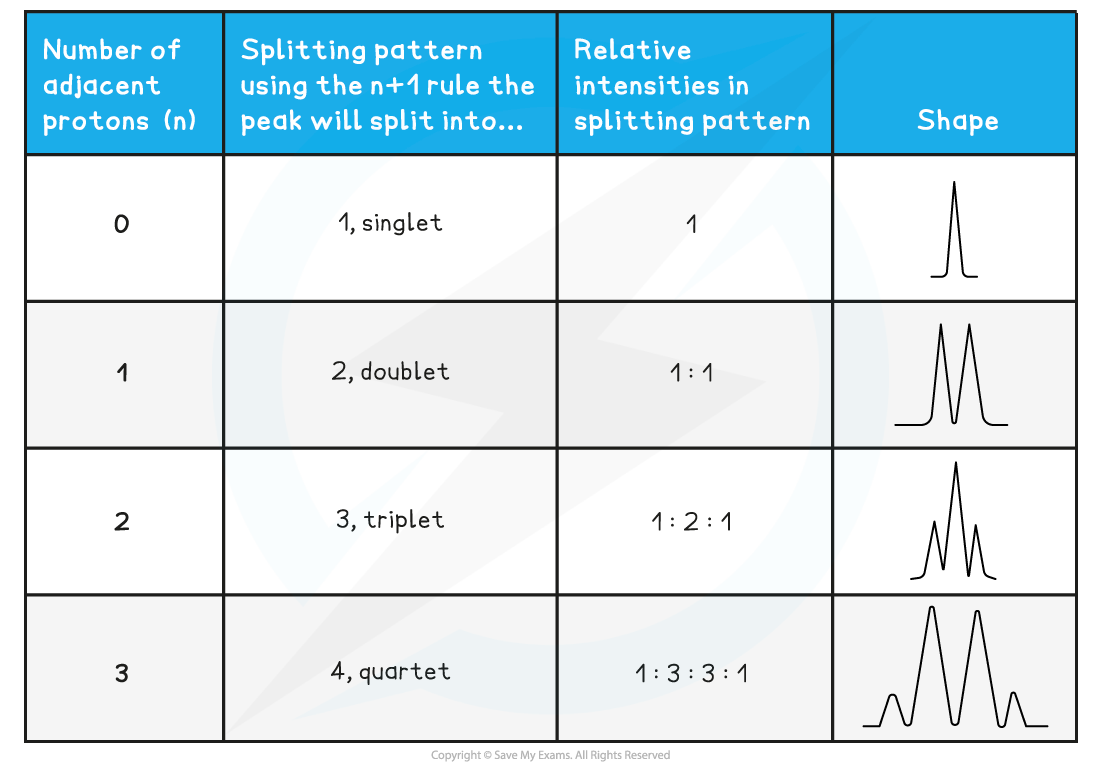
How is spin-spin coupling analysed using the n+1 rule?
For n non-equivalent protons adjacent to the observed proton, the pattern is n+1 peaks.
Singlet: No adjacent protons.
Doublet: One adjacent proton (or CH).
Triplet: Two adjacent protons (or CH₂).
Quartet: Three adjacent protons (or CH₃).
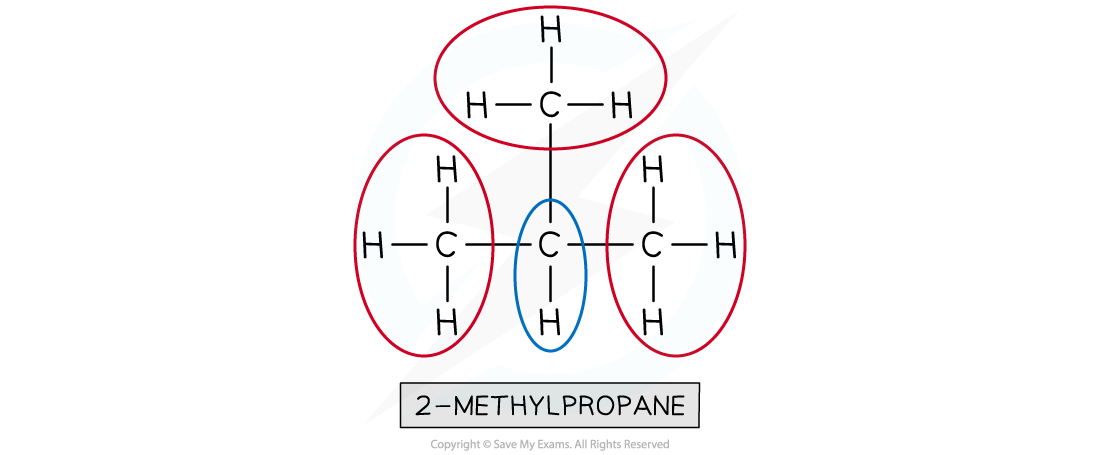
Heptet: Six adjacent protons (or 2 x CH₃)
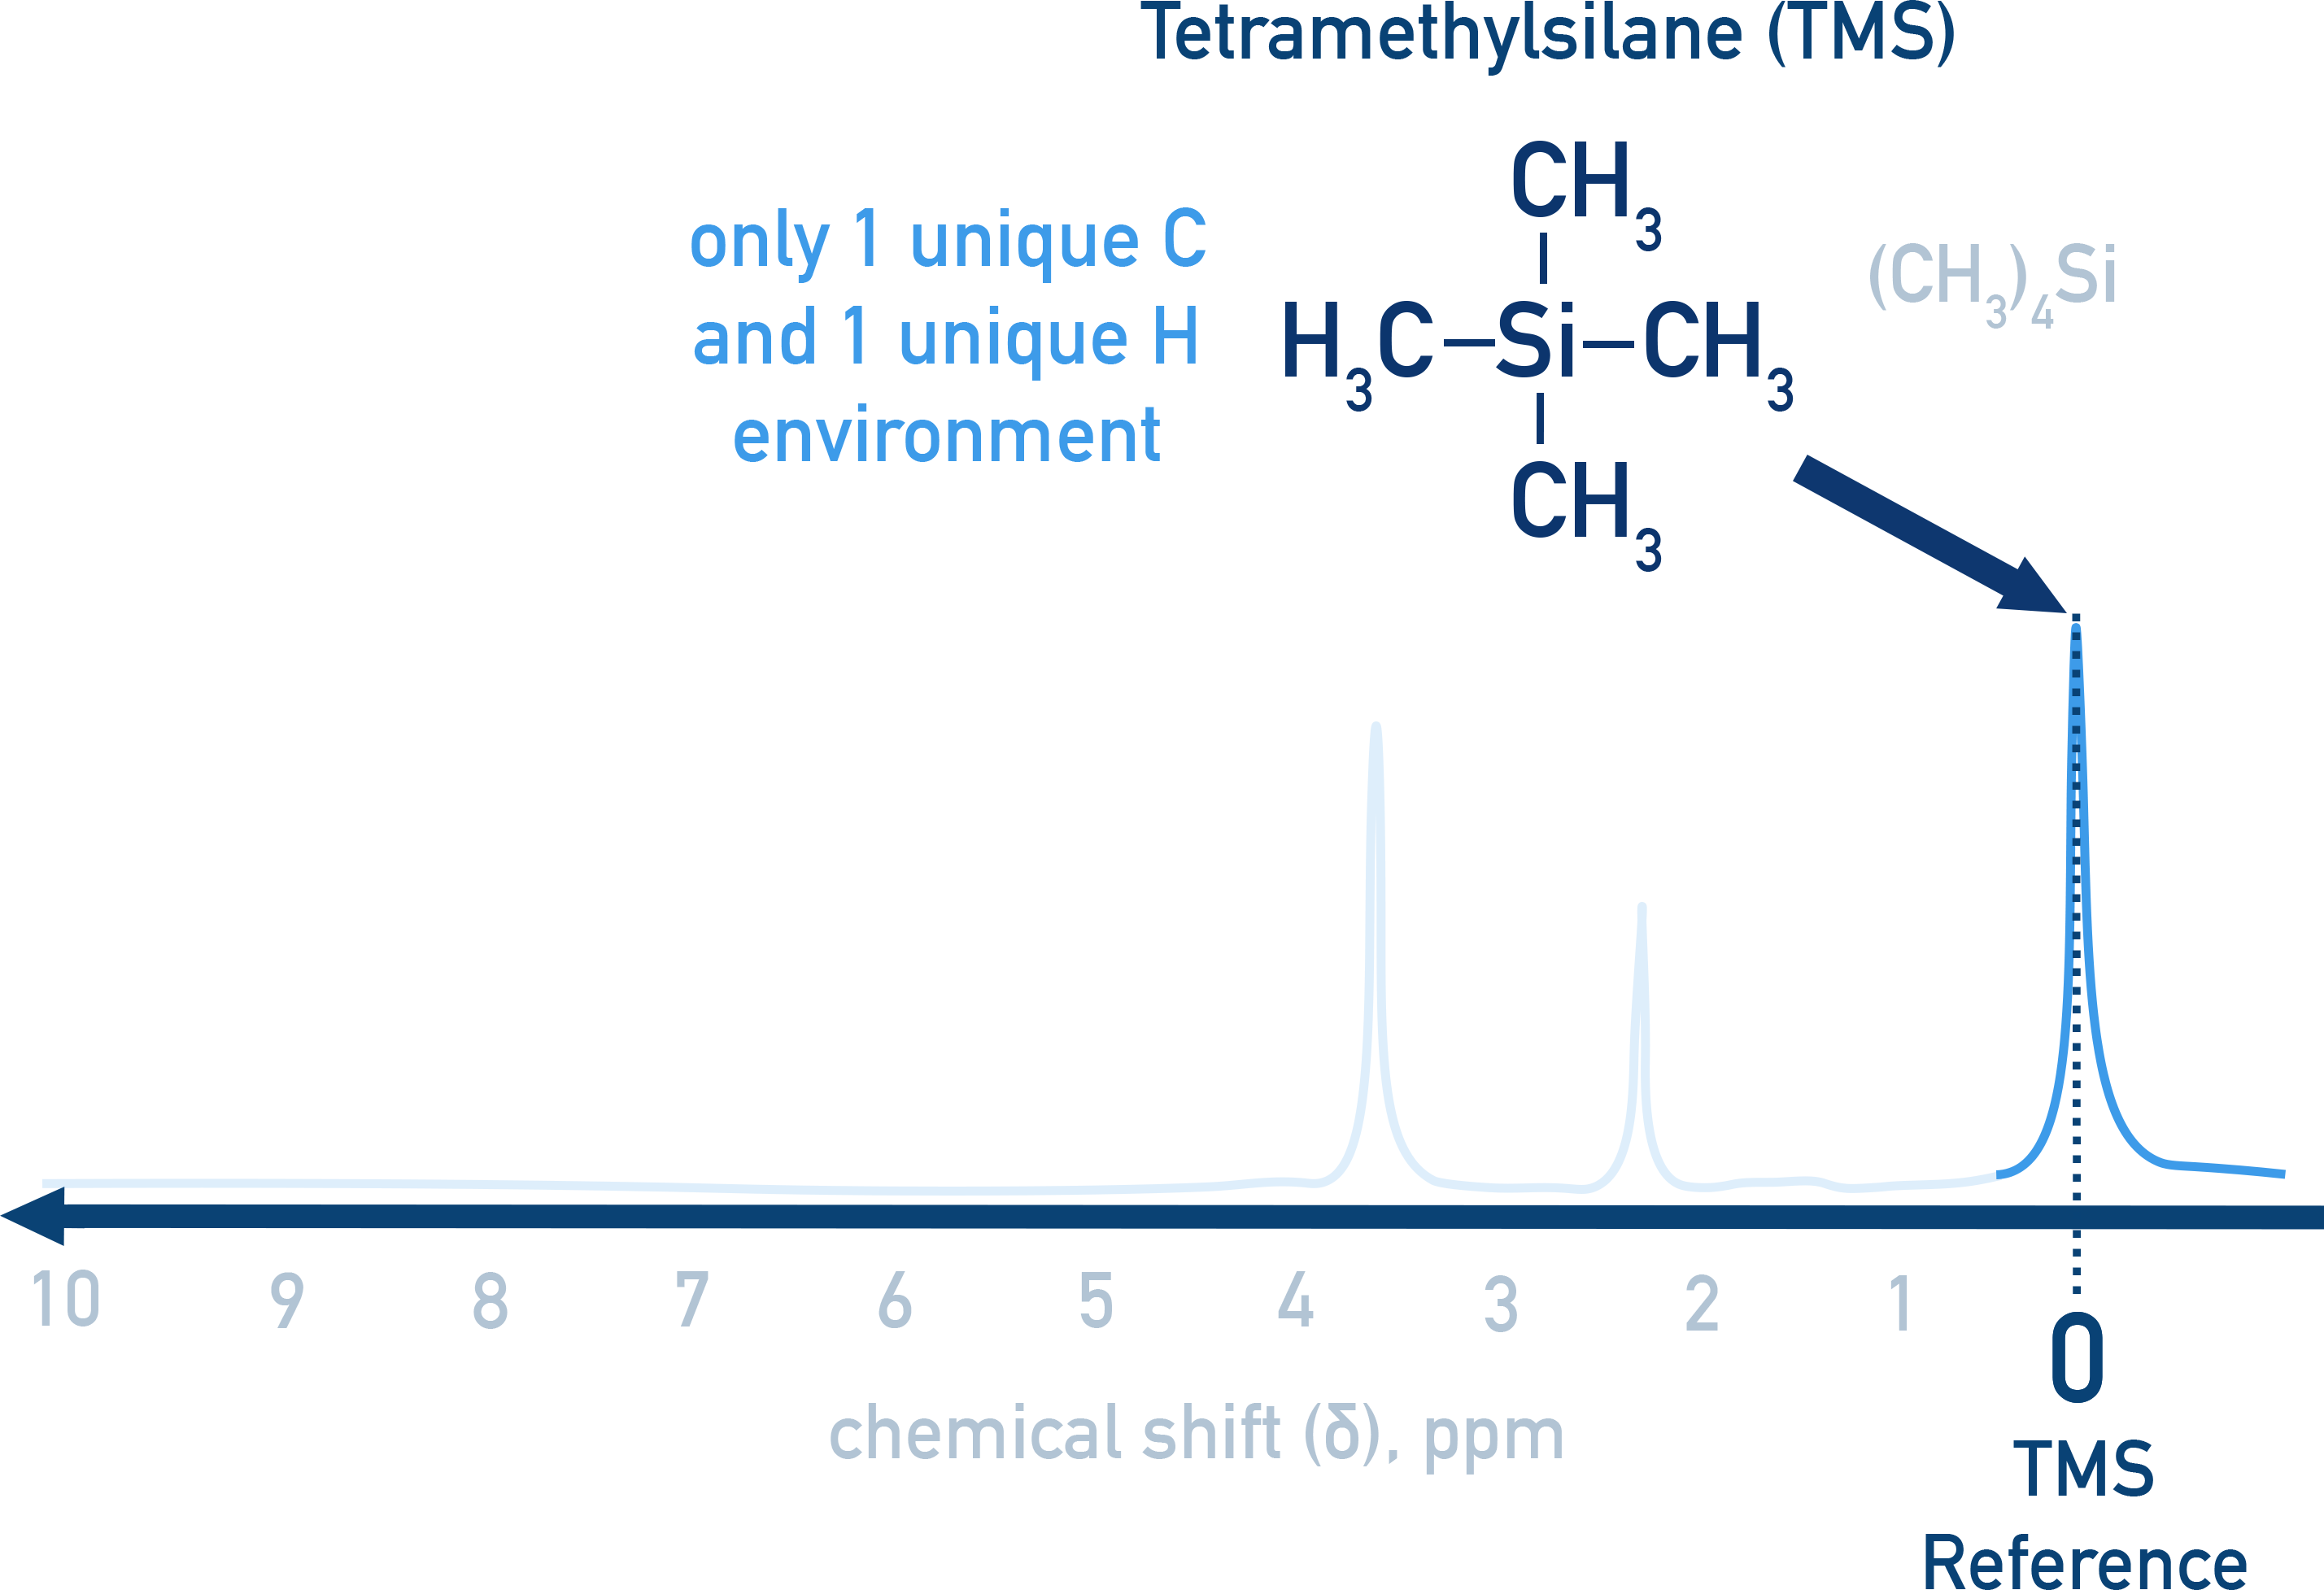
Why is tetramethylsilane (TMS) used as a reference in both NMR spectroscopies ?
TMS has no splitting and a sharp, distinct signal at 0 ppm, making it a universal reference point for chemical shifts.
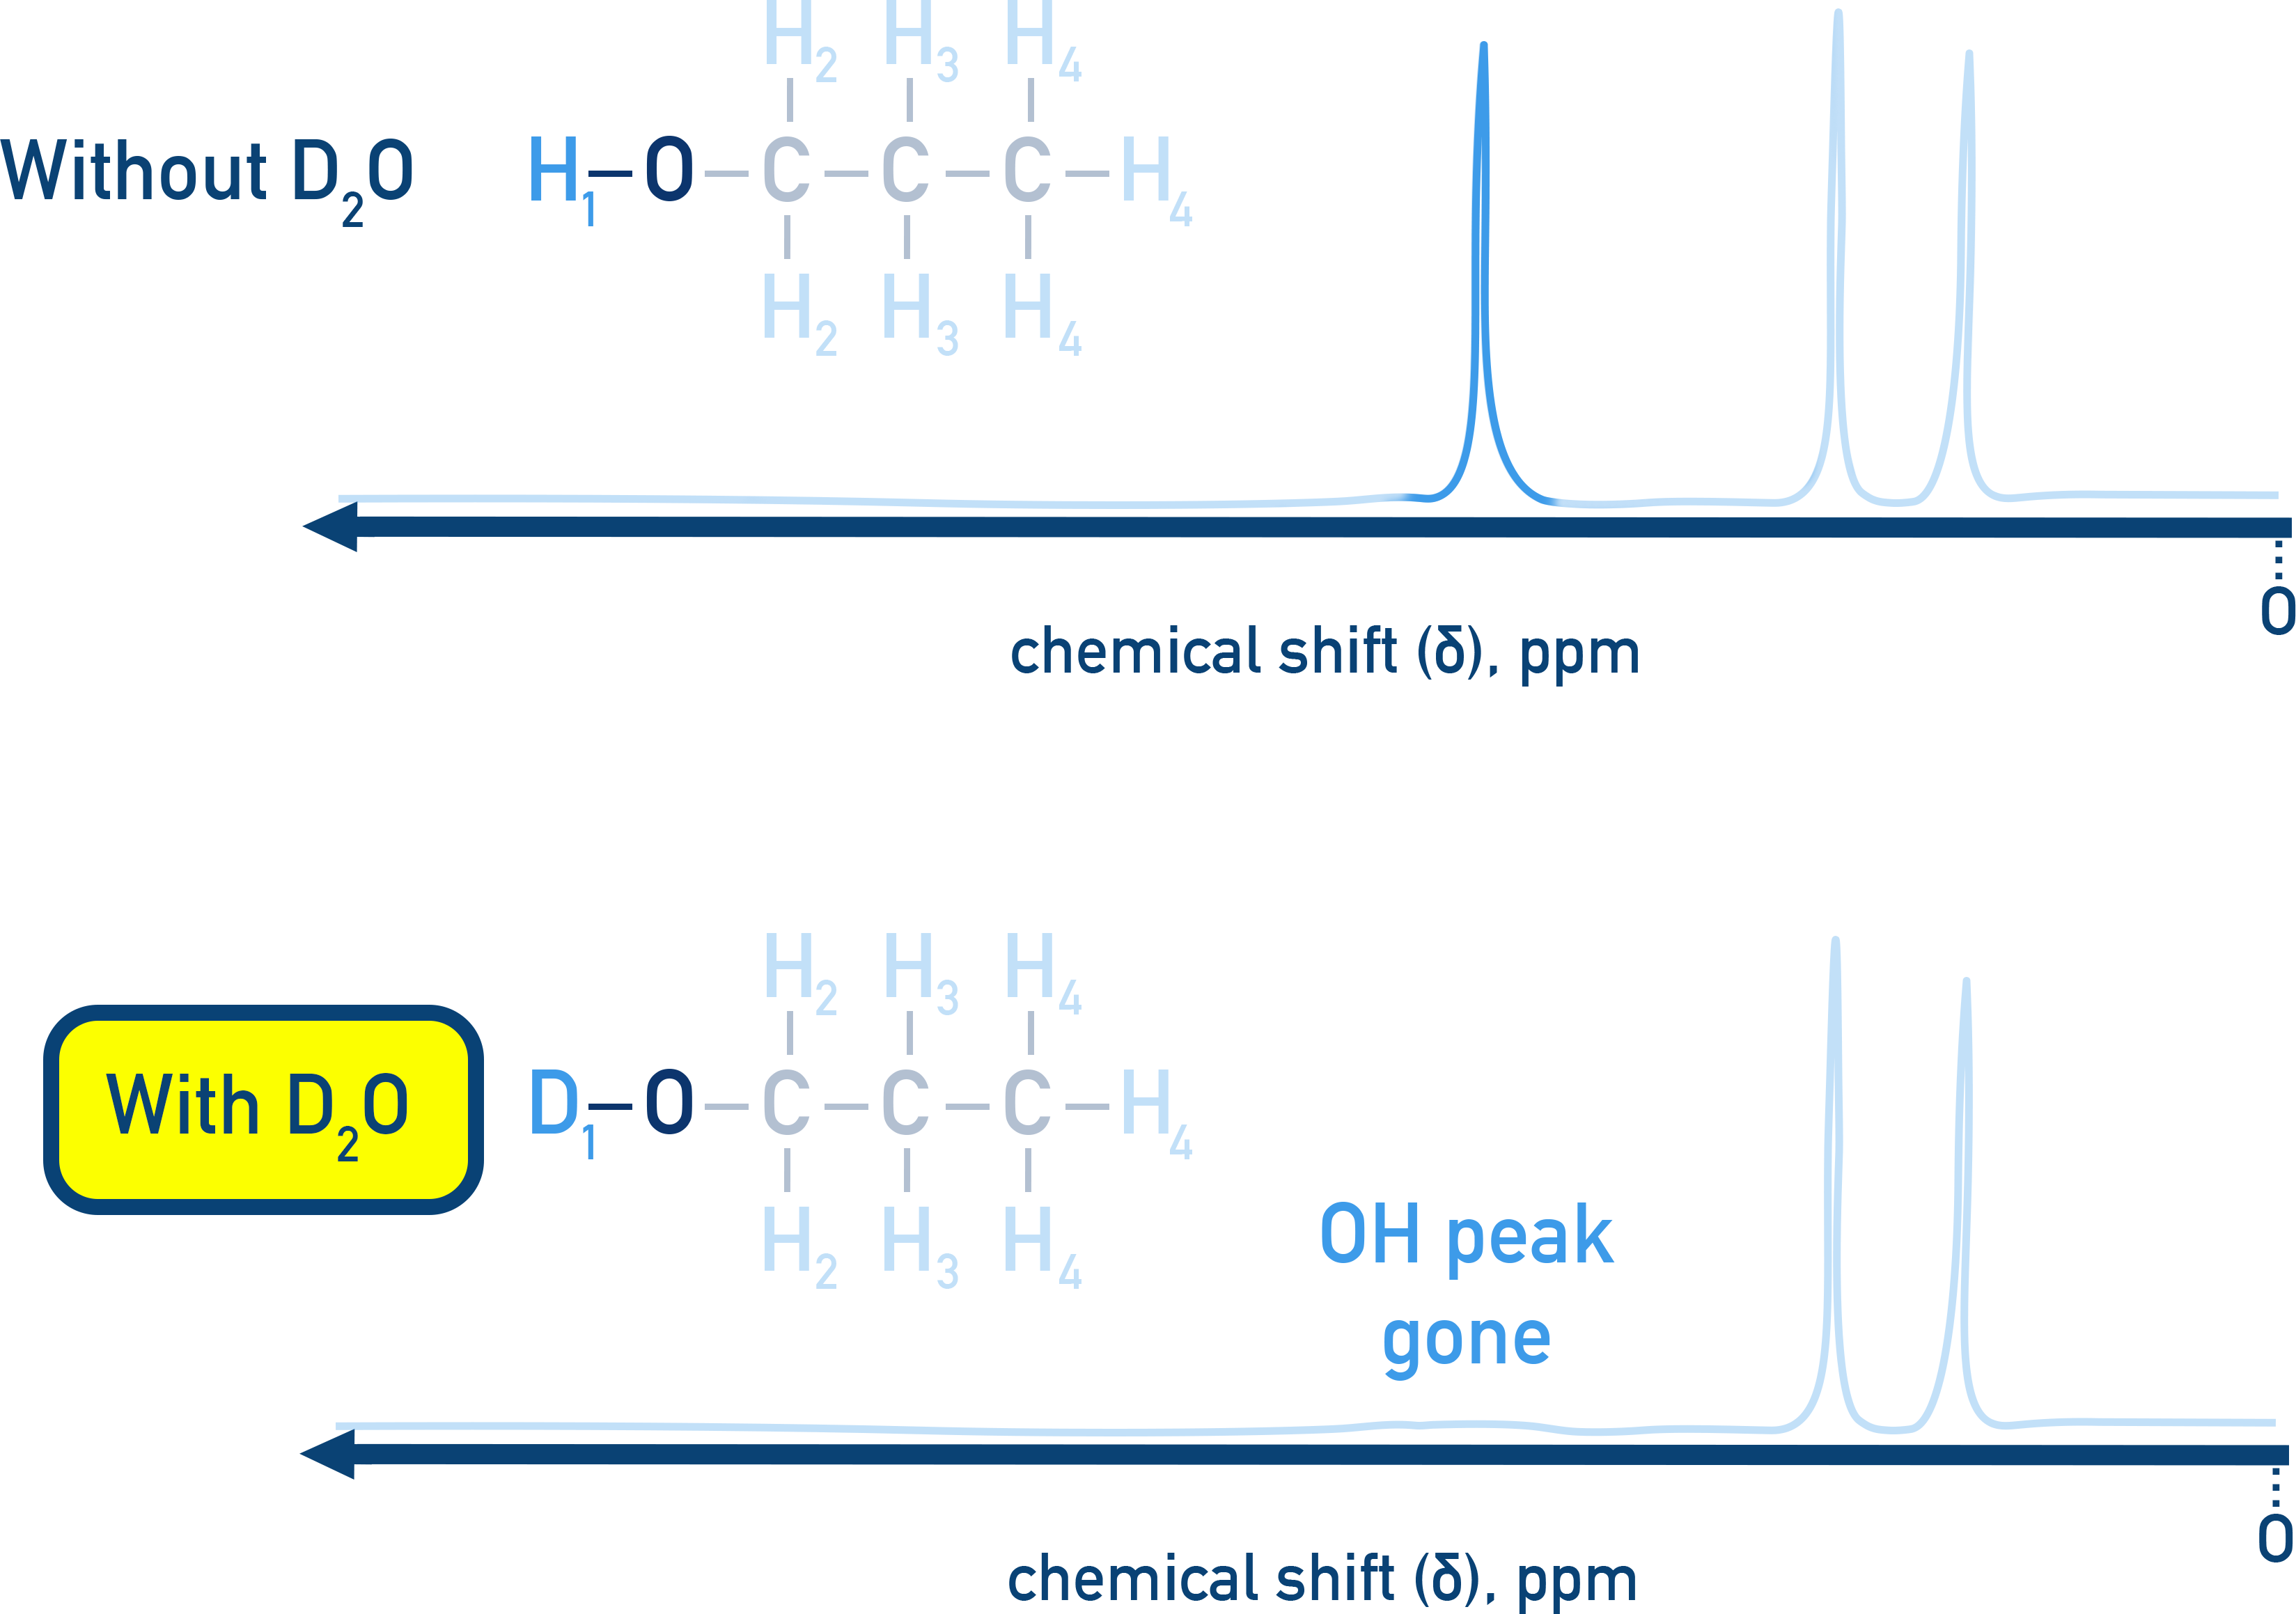
How can O-H and N-H protons be identified in proton NMR?
They show up as broad peaks of variable chemical shift with no splitting pattern, to identify them:
Run a normal H NMR spectrum.
Add D₂O, shake, and run a second spectrum.
O-H and N-H peaks disappear due to exchange with D₂O.
H replaced with D [D not detected by H NMR]
What does each of elemental analysis, mass spectra, IR spectra and NMR spectra tell us about an organic molecule?
Elemental → empirical formula
Mass → molecular mass and fragments of structure
IR → bonds present and functional groups
NMR → environments and structural formula
Why are deuterated solvents used in NMR? (+ give example)
Deuterated solvents, like CDCl₃, do not produce NMR signals because hydrogen is replaced by deuterium avoiding interference with proton NMR signals.
Common splitting patterns
Triplet and quartet → CH3CH2
Heptet and doublet → CH(CH3)2
How does mass spectrometry work?
Sample vaporised → turned into gas
Electron beam bombards molecules → forms molecular ions (M⁺)
Molecular ions may fragment into smaller ions
Ions deflected in magnetic field → separated by mass-to-charge ratio (m/z)
Detected ions produce a mass spectrum
Mass spectrum: abundance vs. m/z → reveals sample composition
How do you read a mass spectrum?
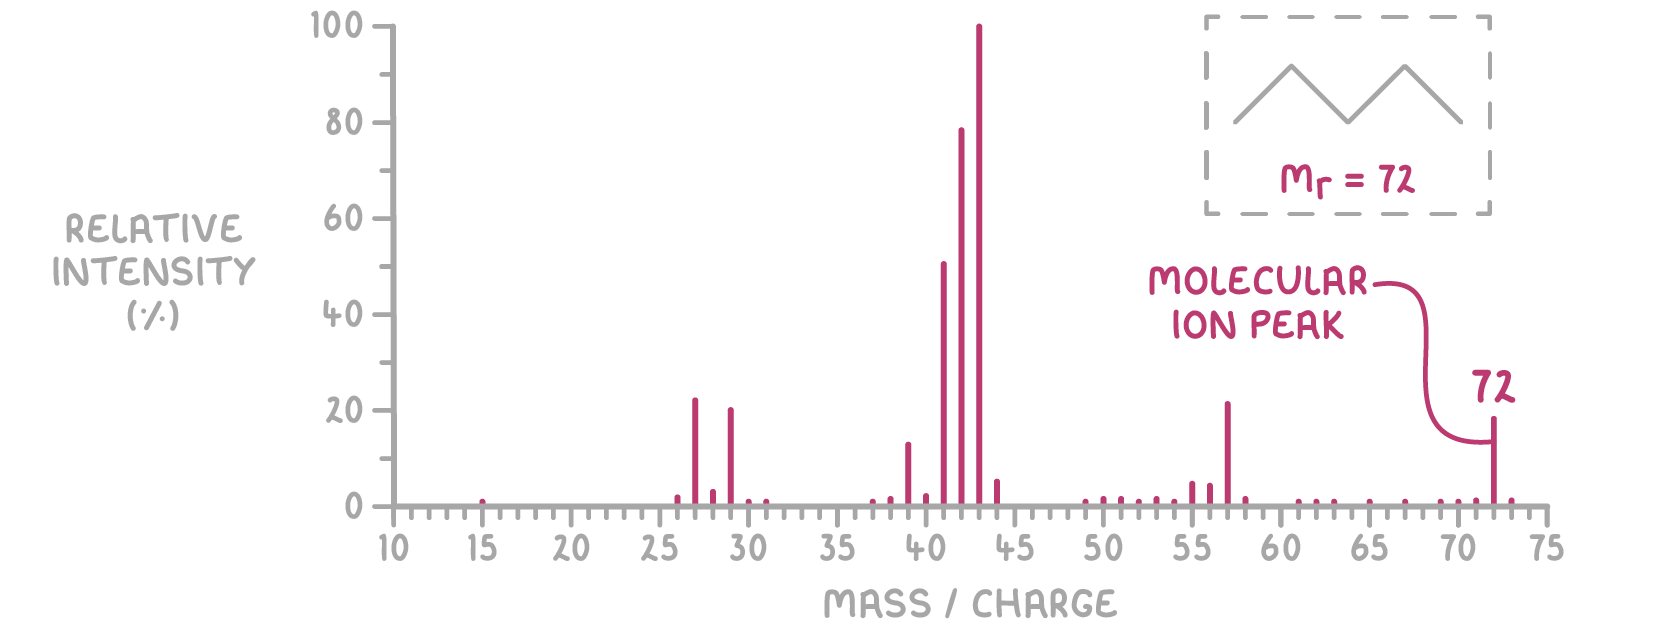
M peak = relative abundance of intact M⁺ ions
m/z value of M peak = compound’s molecular mass (Mr) → assuming just a 1+ charge
Example: pentane (C₅H₁₂) → M peak at m/z 72 → Mr = 72 g mol⁻¹
Smaller M+1 peak = presence of carbon-13 isotopes, provides isotopic info
How can you find the exact compound from a mass spectrum?
Molecular ions break into fragment ions → appear as distinct peaks
Common fragments:
CH₃⁺ → m/z 15
C₂H₅⁺ → m/z 29
C₃H₇⁺ → m/z 43
OH⁺ → m/z 17
Fragmentation pattern reveals molecular structure
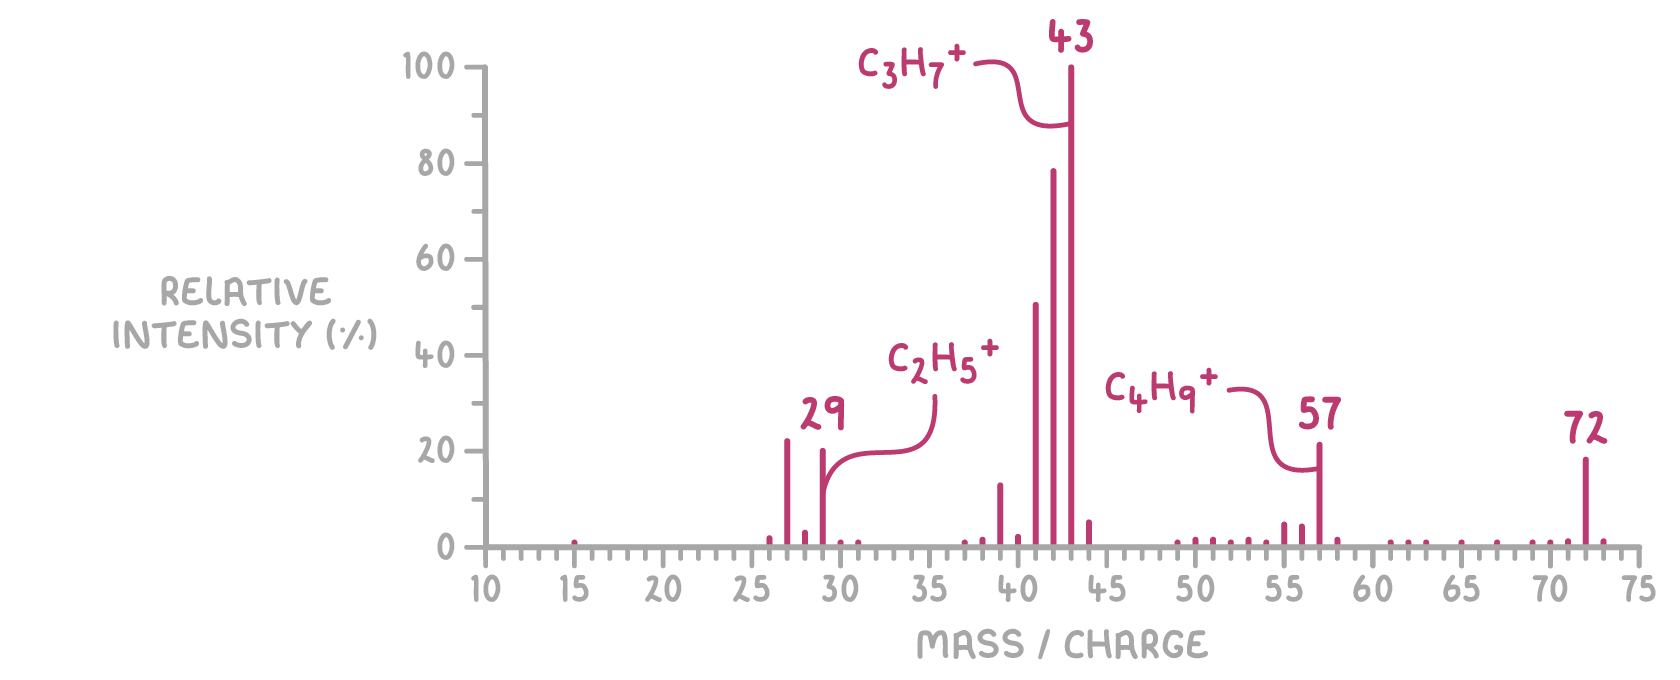
m/z 29 → CH₃CH₂⁺ → ethyl group
m/z 43 → CH₃(CH₂)₂⁺ → propyl group
m/z 57 → CH₃(CH₂)₃⁺ → butyl group
Example: pentane shows peaks at m/z 29, 43, 57 corresponding to above fragments
How can you tell the difference between compounds with the same molecular formula, from a mass spectrum?
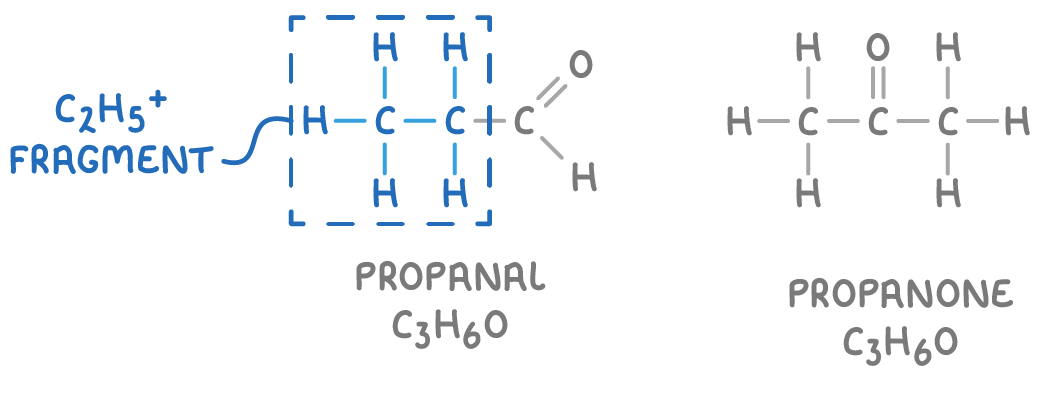
Compounds with same molecular formula can have distinct fragmentation patterns
Enables differentiation of isomers (e.g., propanal vs. propanone, C₃H₆O)
Example: propanal → fragments to C₂H₅⁺; not possible for propanone
Databases match spectra to identify unknown compounds
How do you work out what bonds are actually present from an infrared spectroscopy graph?
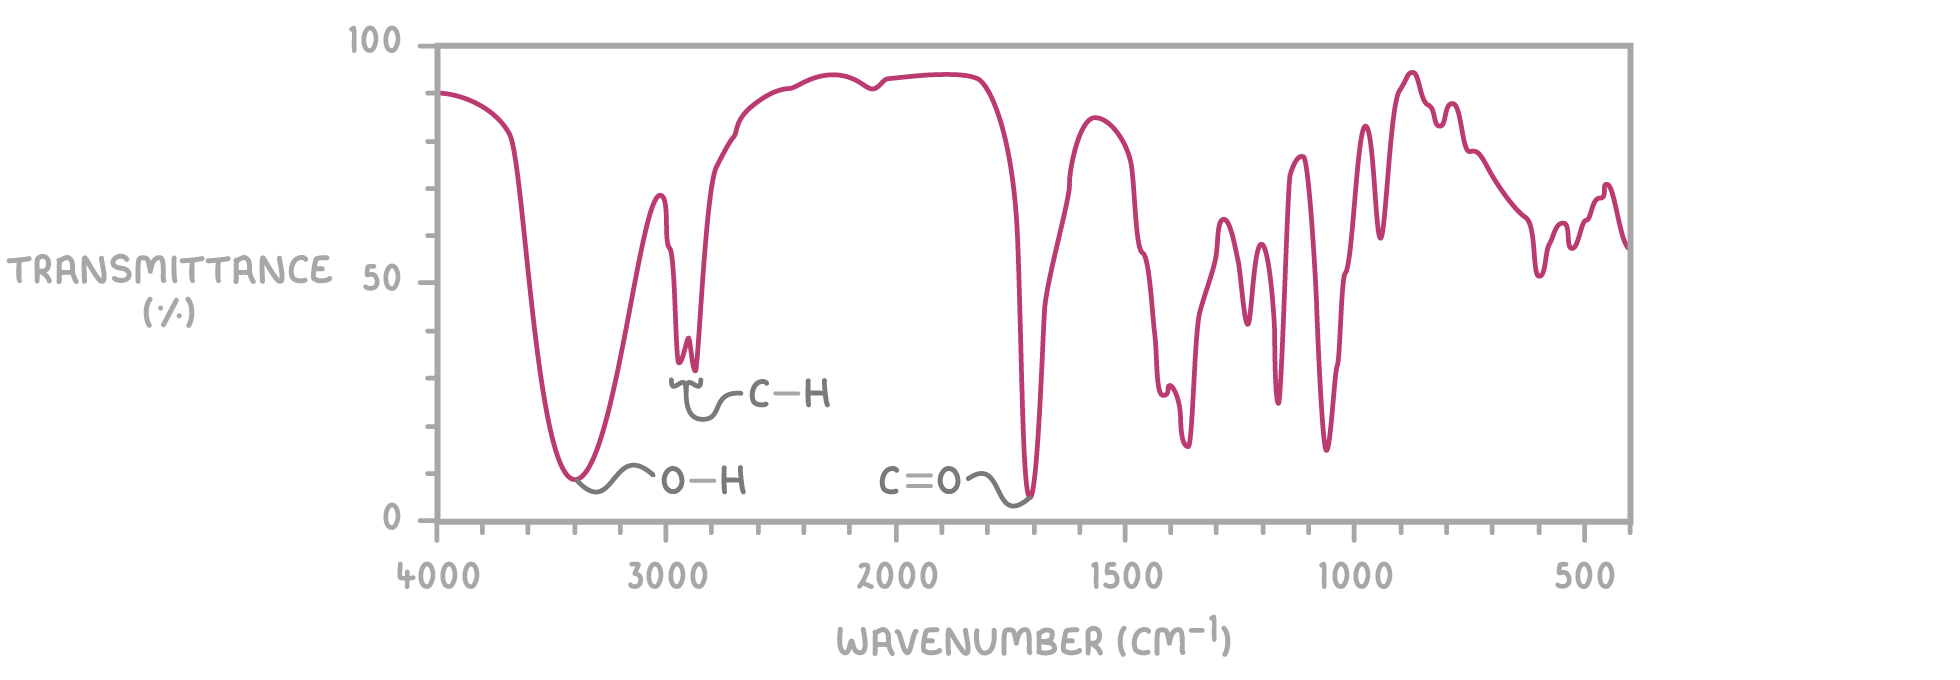
You get a table like this one (you do not need to memorise it):
Bond | Functional group | Wave number range (cm^-1^) |
|---|---|---|
N-H | Amines | 3,300 - 3,500 |
O-H | Alcohols | 3,300 - 3,600 |
O-H | Carboxylic acids | 2,400 - 3,300 (broad) |
C-H | Most organic molecules | 2,800 - 3,000 |
C≡N | Nitriles | 2,200 - 2,300 |
C=O | Aldehydes, ketones, carboxylic acids, esters | 1,650 - 1,850 |
C=C | Alkenes | 1,650 - 2,000 |
C-O | Alcohols, carboxylic acids | 1,000 - 1,300 |
Then you work out what bonds are present from the dip
What is the fingerprint region in relation to mass spectrometry?
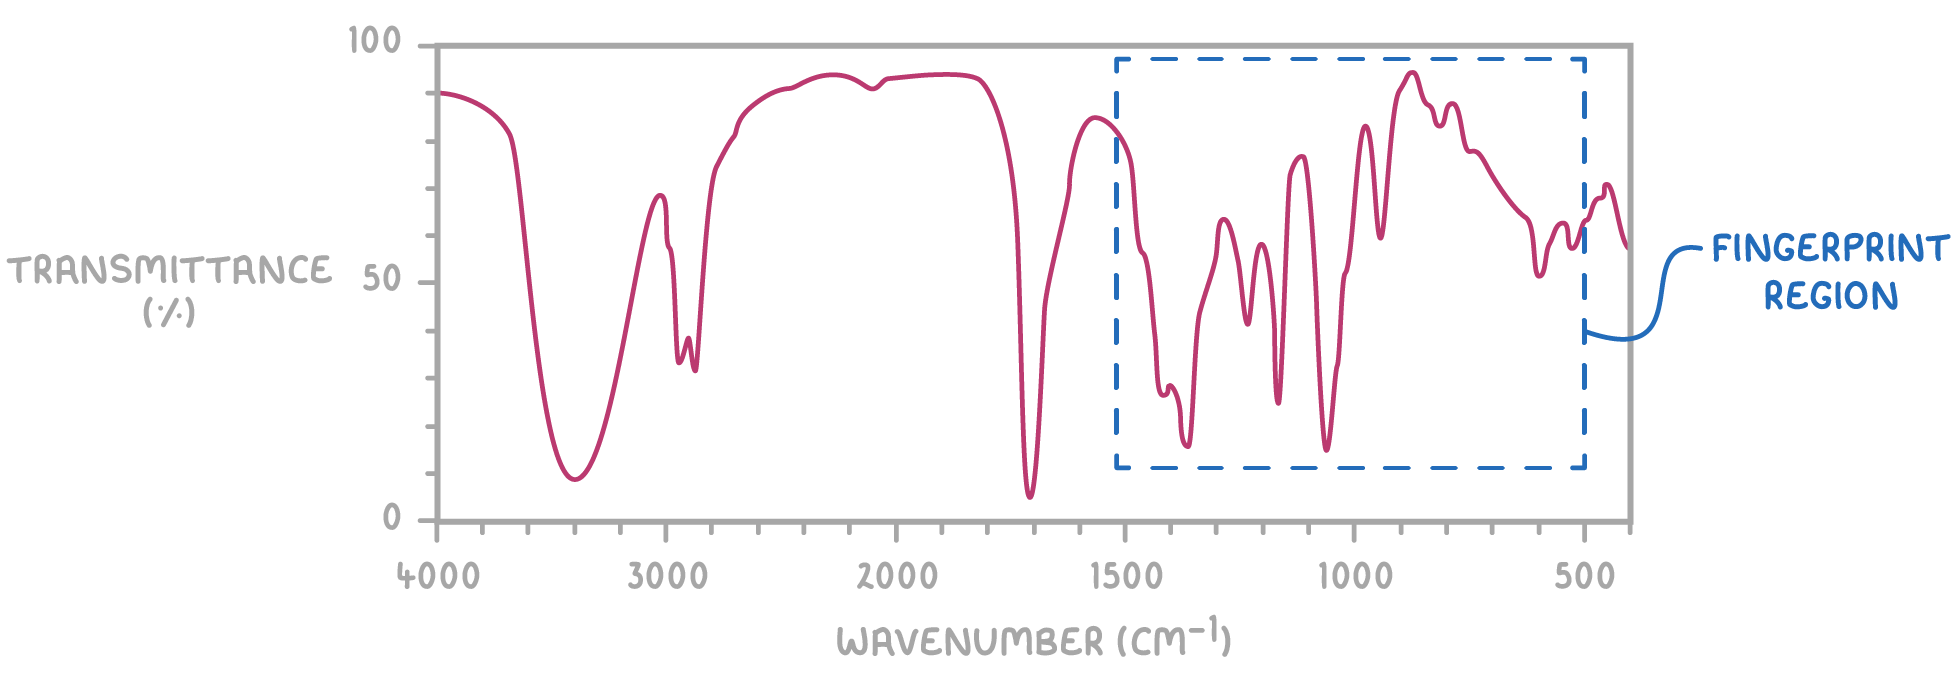
500–1500 cm⁻¹ region of IR spectrum = fingerprint region
Pattern is unique to each molecule → allows compound identification
Match unknown’s fingerprint region to reference spectra → confirms molecule identity
Extra peaks indicate impurities → useful for checking compound purity
What are the uses of infrared spectroscopy?
Infrared spectroscopy has many uses including:
Breathalyser tests - The intensity of ethanol's O-H peak indicates how much is present in a person's breath. This reveals if a driver is over the legal alcohol limit.
Atmospheric monitoring - Peak intensities for gases like CO and NO show pollutant levels from car emissions and industrial processes.