Microeconomics Graphs
1/22
There's no tags or description
Looks like no tags are added yet.
Name | Mastery | Learn | Test | Matching | Spaced | Call with Kai |
|---|
No analytics yet
Send a link to your students to track their progress
23 Terms
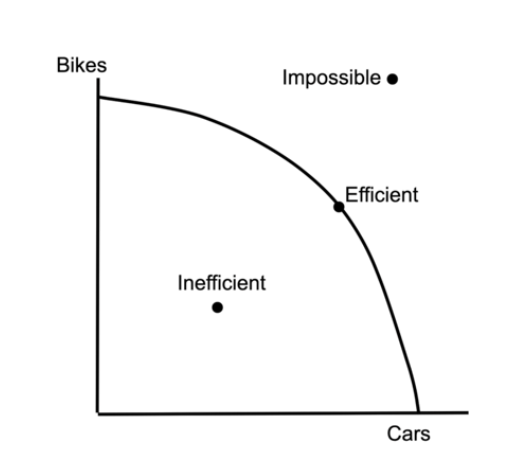
PPC and Explain
On the curve: Productive Efficiency
In the curve: Inefficient (Misallocation, unemployment, idle capacity)
Out the curve: Currently unattainable
Must be able to highlight points on allocative efficiency and productive efficiency.
Any point on the PPC shows Productive Efficiency
The allocative efficiency point is on the curve but we cannot determine where it is due to a lack of data
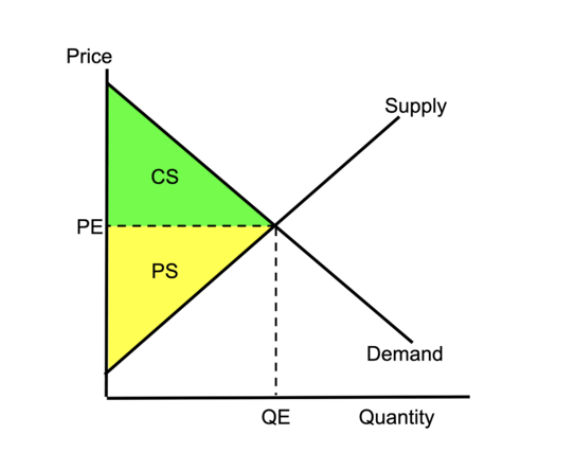
Supply and Demand Curve
Ensure CS and PS is highlighted properly.
*TIP: CS is always the triangle that touches the Demand Curve because consumer yk and PS touches the Supply Curve because producer
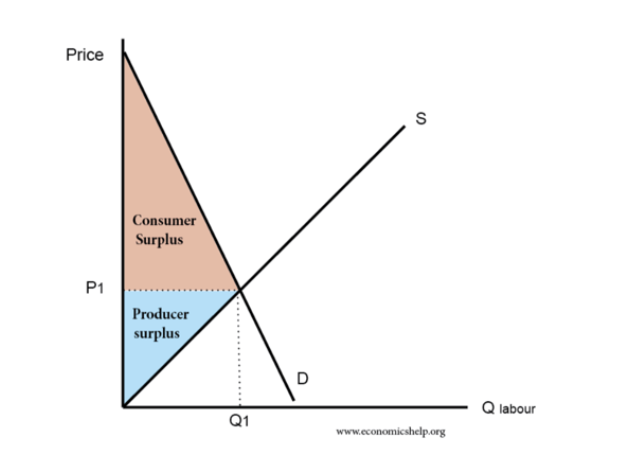
S and D curve when Demand is Inelastic, state PED
PED between 0 and 1
Curve is steep
If P increase, CS decrease and PS increase. Vice versa.
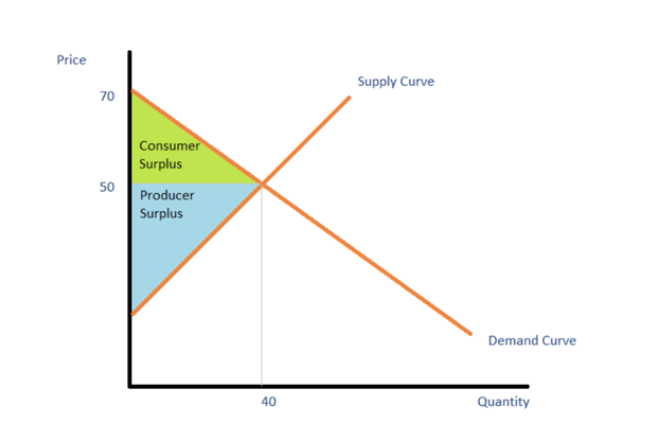
S and D curve when Demand is Elastic, state PED
PED > 1
Curve is flatter
When price increase, PS fall (because the loss from selling fewer units outweighs the gain from the higher price per unit)
When price increase, CS also falls sharply because consumers pay more and buy less
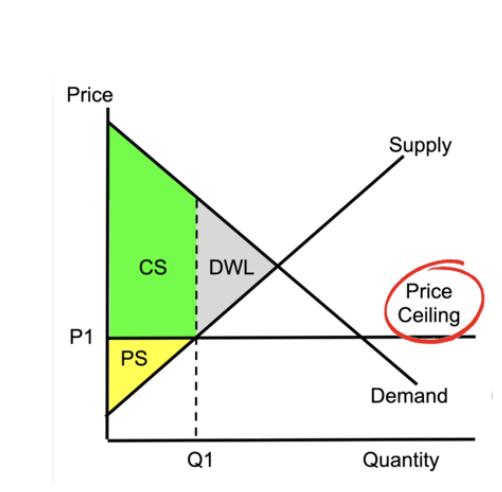
Price Ceiling, define and draw
Analyse consumer and producer surplus
Why does DWL occur?
State effects
A government-imposed maximum price limit on how high a price can be charged for a specific good or service.
QD > QS, Shortage
CS increase for those who get to buy it
PS falls because producers sell less and at a lower price
DWL occurs because there are lost trades (some consumers want to buy and some producers want to sell, but the price is too low for producers)
This could lead to:
Consumer surplus increase, can afford essential goods more easily
Long lines
Black markets
Loss of allocative efficiency (Marginal benefit exceed marginal cost)
Reduction in market size (Lower production levels, can also cause unemployment)
Shortages
Reduced quality (Producers want to cut cost to earn profit)
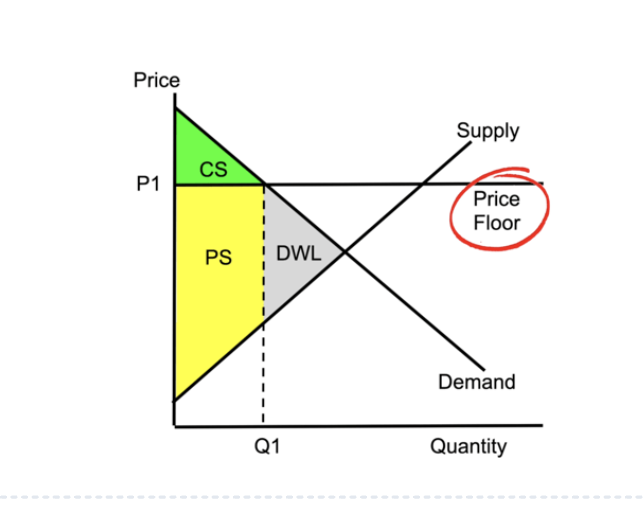
Price Floor, define and draw
Analyse graph
Why does DWL occur?
State effects
A price floor is a government-imposed limit preventing the price of a good, service, or resource from falling below a certain level.
*To be effective (binding), it must be set above the market equilibrium price.
QS > QD, surplus
CS falls because price is higher, consumer buy less
PS increases because units are sold at a higher price, but some units not sold because of surplus therefore some PS is lost
Extension in supply, contraction in demand
DWL occurs because there are lost trades (some producers want to sell but no consumers buy at that high price)
It protects producers or workers by ensuring minimum income but creates surpluses and reduces consumer welfare.
It can also lead to unemployment, wasted resources, gov intervention (gov buys the surplus to stabilise markets), and may also encourage black markets (employees offer under-the-table prices)
*Agricultural markets: governments usually purchase excess supply to store or export
Loss of allocative efficiency (artificially high price prevents market from reaching equilibirum, leading to MC exceeding MB)
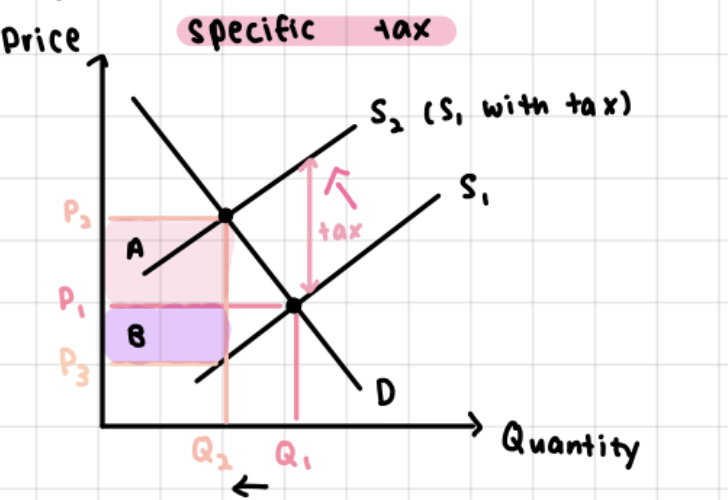
S and D with an excise tax
Clearly state differences of consumer incidence of elasticities
State effects
Pink + Purple area is Tax Revenue (P2-P3) x Q2 (total consumer + producer burden)
P2: Buyer pays, P1: Original price received by both buyer and seller, P3: Seller receives
CS falls because consumers pay a higher price and they buy less
Calculate C burden, Area A: (P2-P2) x Q2
Calculate P burden, Area B: (P1-P3) x Q2
PS falls because producers receive a lower effective price and they sell lower units
DWL occurs because loss of mutually beneficial trades due to increased price.
When Demand is inelastic: Consumers bear more tax
When Supply is inelastic: Producers bear more tax
Effects:
Final Price increase, Quantity demanded decrease
Reduce consumption of harmful goods (externalities)
May reduce producer income and cause unemployment
Gov can use revenue for public services
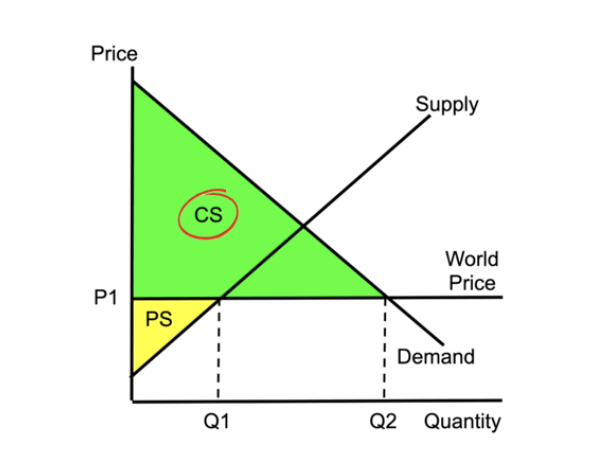
Supply and Demand showing result of trade (Skip first, not in syllabus yet)
World Price: International Market Price of a good, determined by global supply and demand
notes incomingggg once i get it ... jacob clifford yt vid
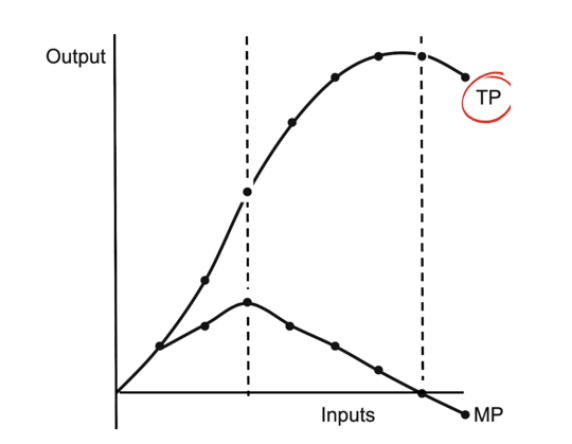
Short Run Production Function
TP: Total Product Produced
As you hire more workers it increases at an increasing rate, then it increases at a decreasing rate, then eventually it starts to decrease
MP: Marginal Product Produced
MP increases as workers increase at an increasing rate, but decreases when it increases at a decreasing rate. Each worker still increases output, but at a less rate than before. This might be due to inefficiencies (Law of Diminishing Returns). When TP starts to decrease, MP will go into the negatives, meaning adding one more worker reduces total output.
*Kinda not a high chance to have a question just about this, but good to know in case to elaborate on other cases.
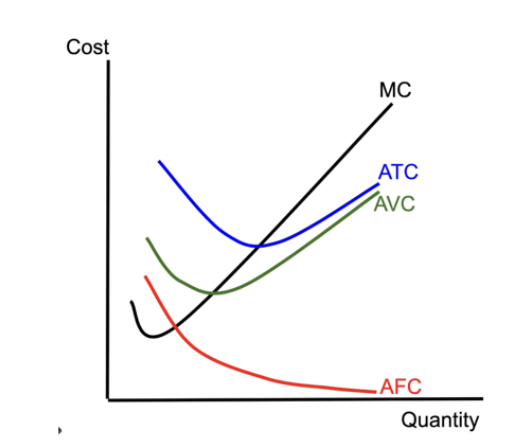
Short Run Per Unit Cost Curves
MC: Always go down and back up (Nike)
ATC: Go down, hit a minimum at MC, and go up
AVC: Go down below the ATC, then go up and close to the ATC
AFC: Downwards decreasing
AFC not that important, AVC only when figuring out shutdown costs
So the most important curves are the MC and ATC!
MC: tells you how much to produce
ATC: tells you how much loss or profit you are making
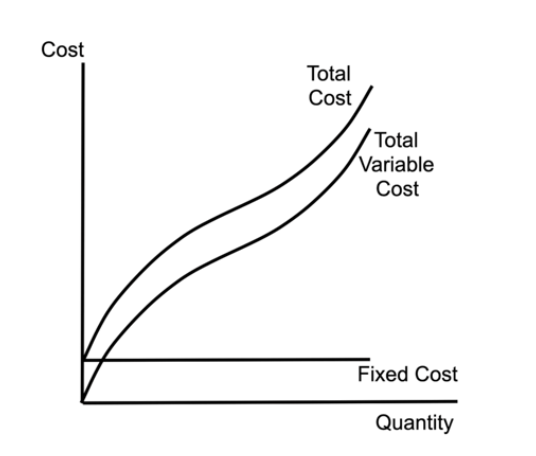
Short Run Total Cost Curves
*Not a very important graph but shows some concepts
We pay the same fixed cost on any producing amount
VC below TC
TC is the VC plus Fixed Costs
*Per unit graph is more important but just know this in case
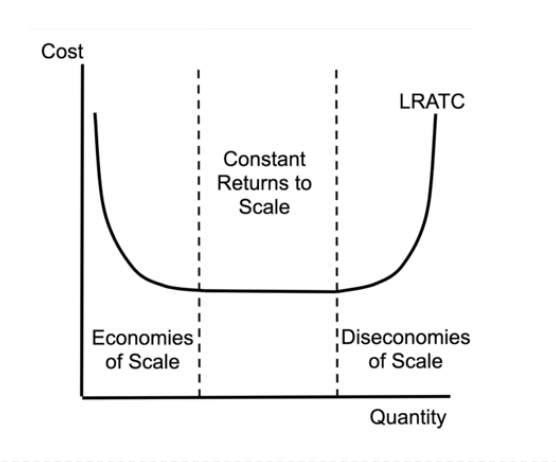
Long Run Average Total Cost Curve (LRATC)
*Not a very important graph but shows some concepts
We pay the same fixed cost on any producing amount
VC below TC
TC is the VC plus Fixed Costs
*Per unit graph is more important but just know this in case
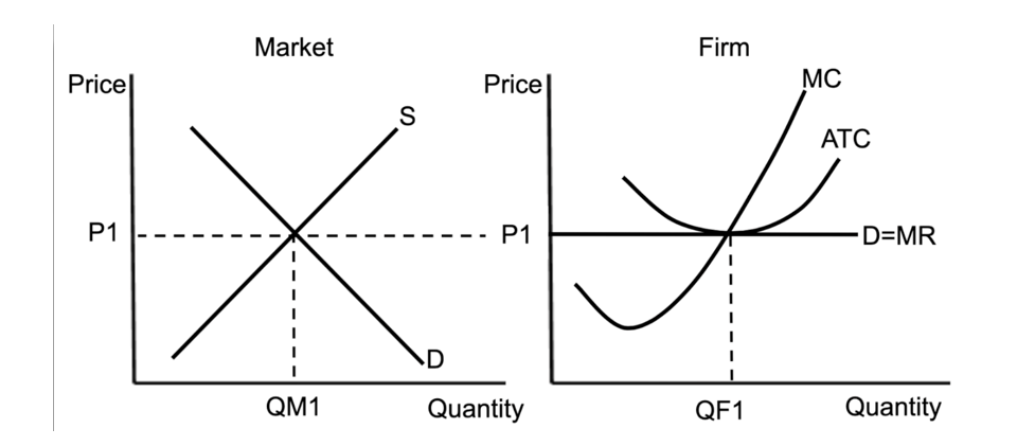
Perfect Competition and their Cost Curves, Side by Side graph
Price set by the market, so horizontal demand, D=MR=AR (because every product is priced the same, so eg $5 is D, next revenue is $5, and all revenue divided is also $5 coz perfect comp)
Always produce where MR=MC, remember if MR>MC it means you have to produce more you move up to where MR=MC, PROFIT MAXIMISATION!! (The firm increases output until MC rises to equal price. At this point, profit is maximised because producing any more would increase costs more than revenue.)
Achieving allocative efficiency at that point because: benefit to society = cost of society -> P=MC
Productive efficiency: producing at lowest possible cost
Extremely efficiency
No DWL
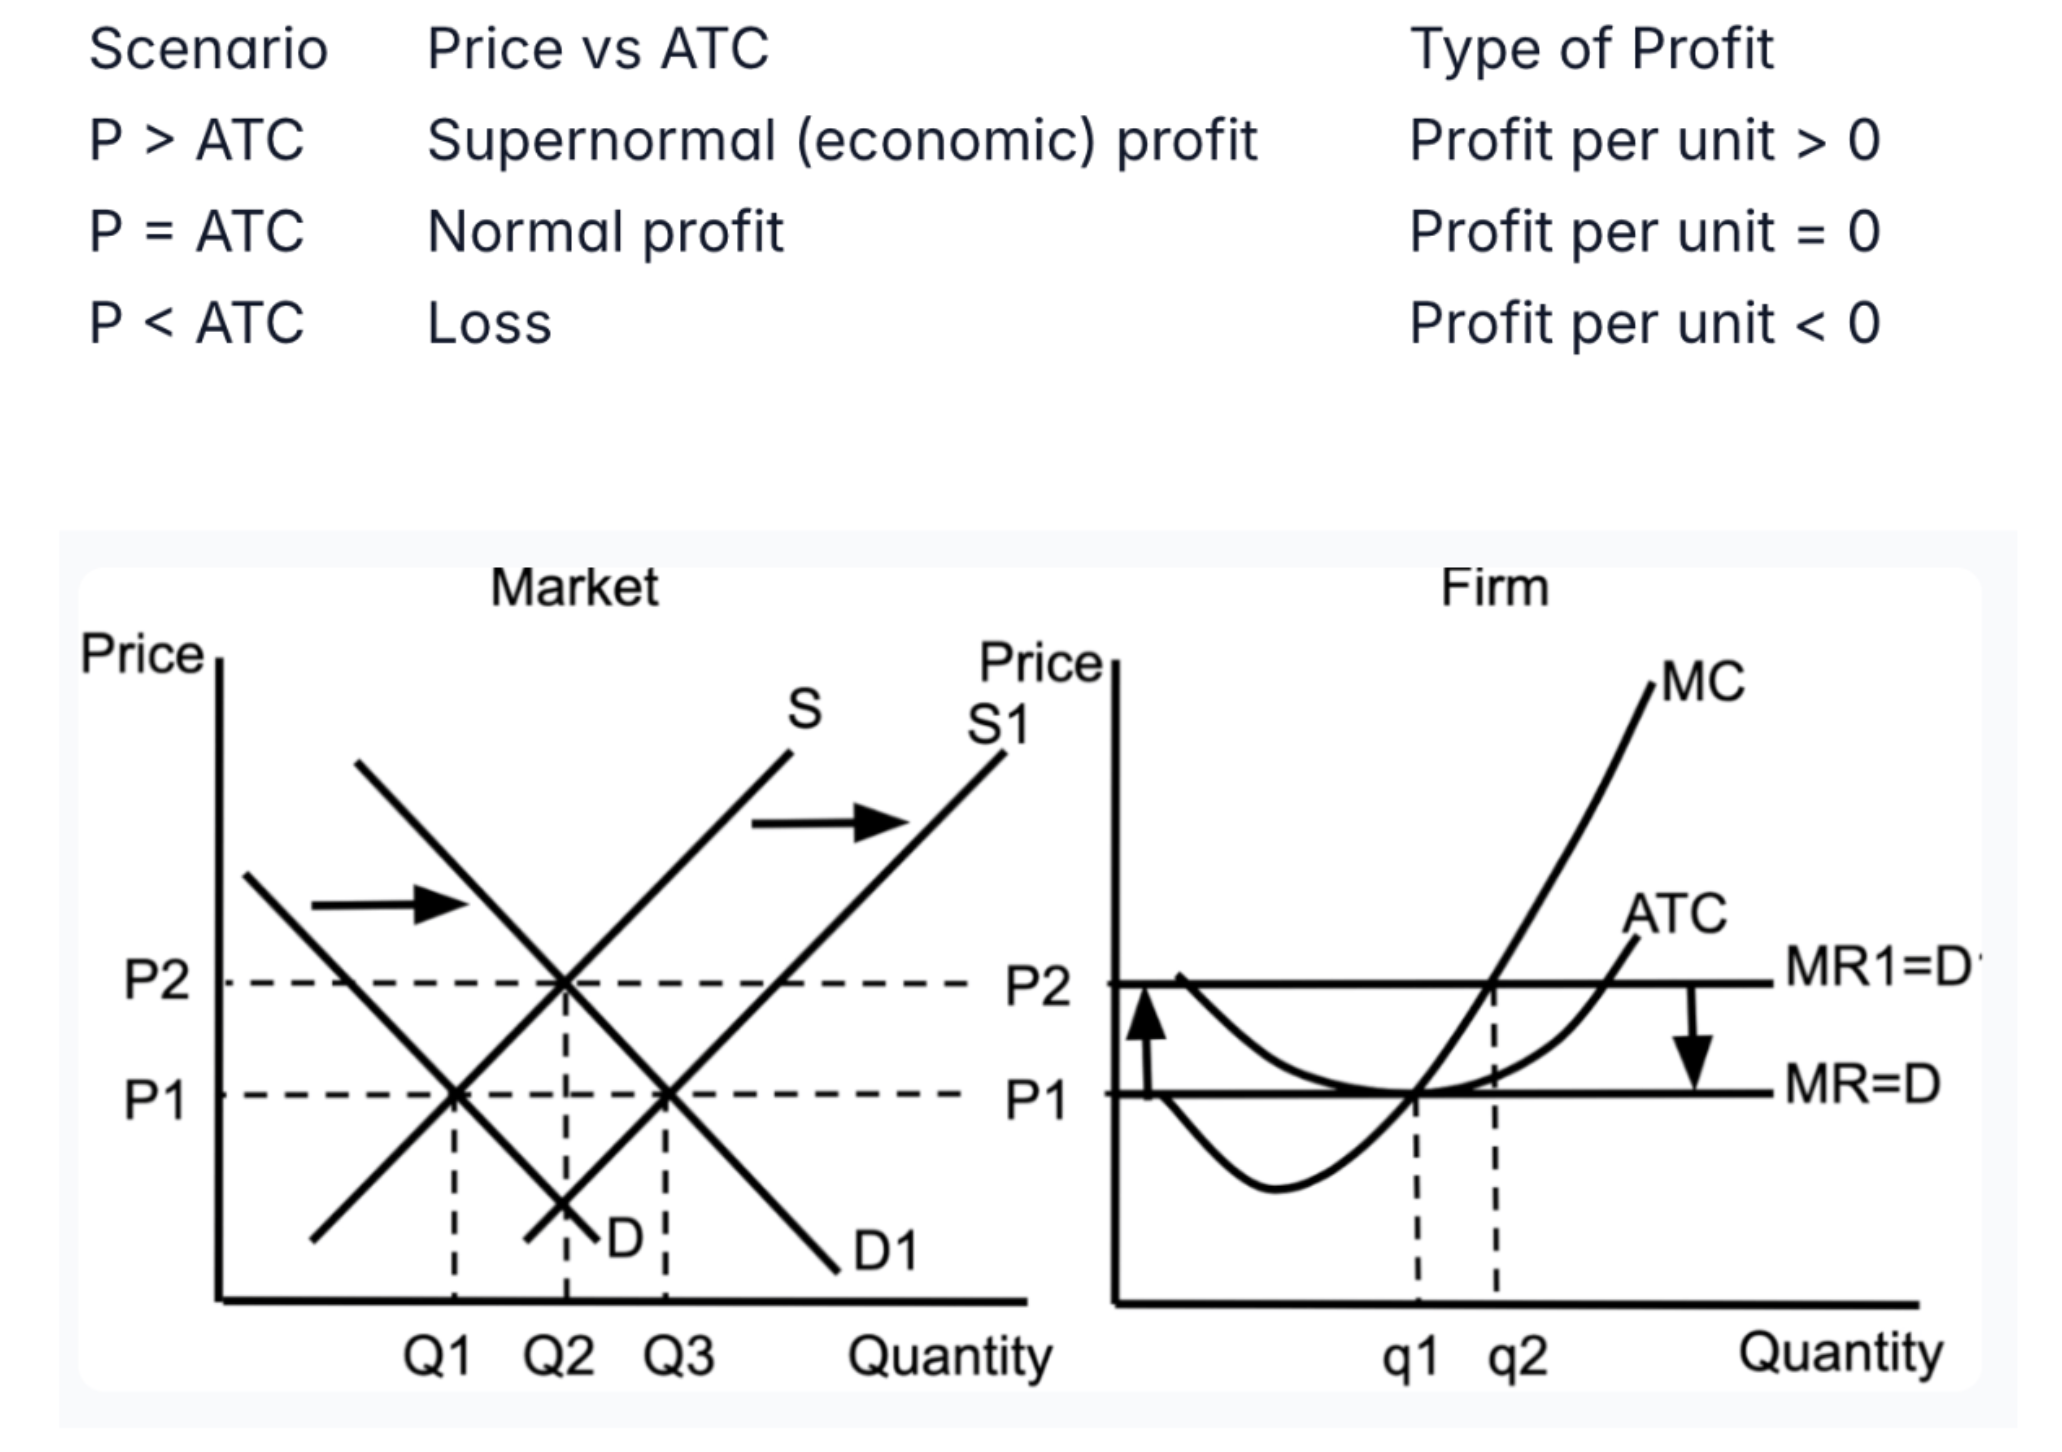
Example of NORMAL profit for a perfect competition as it is breaking even since ATC intersects MC where they touch the D curve. so P=D.
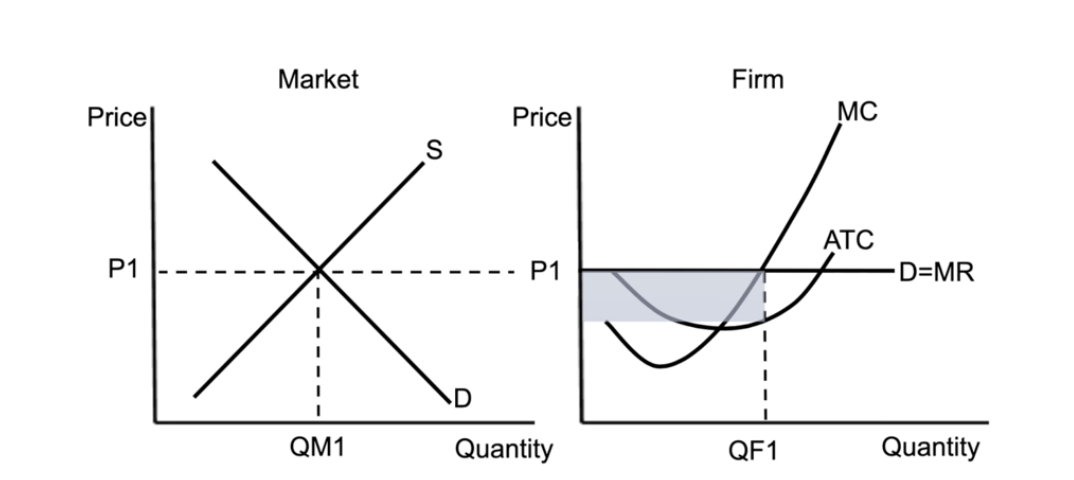
Perfect Competition (Short-run profit)
ATC curve below D=MR
Firm makes a profit if P > ATC, breaks even if P = ATC, and makes a loss if P < ATC.
Since ATC where it intersects MC is lower than P, the firm is making a profit. (supernormal profit)
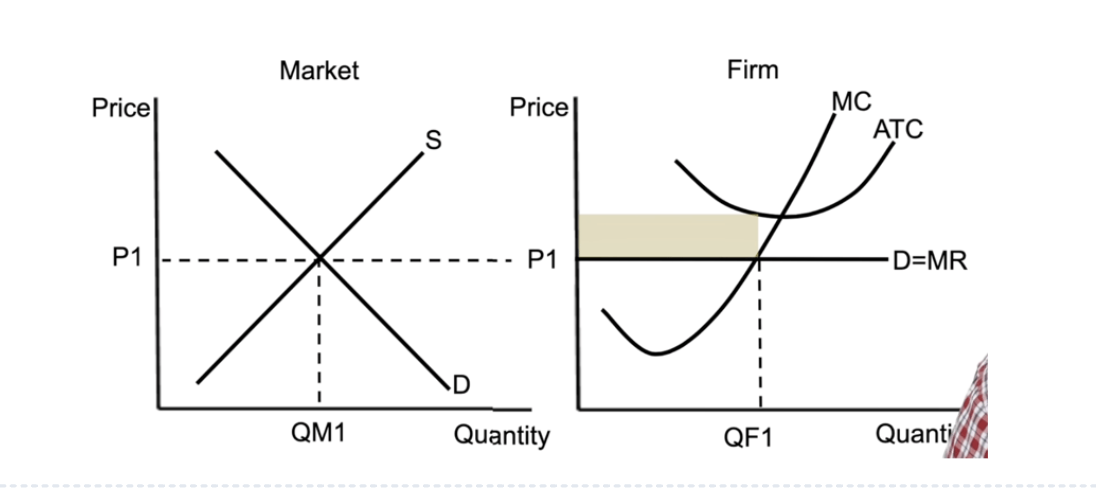
Perfect Competition (Short-run loss)
ATC curve above D=MR
Firm makes a profit if P > ATC, breaks even if P = ATC, and makes a loss if P < ATC.
Since ATC where it intersects MC is above P, the firm is making a loss.
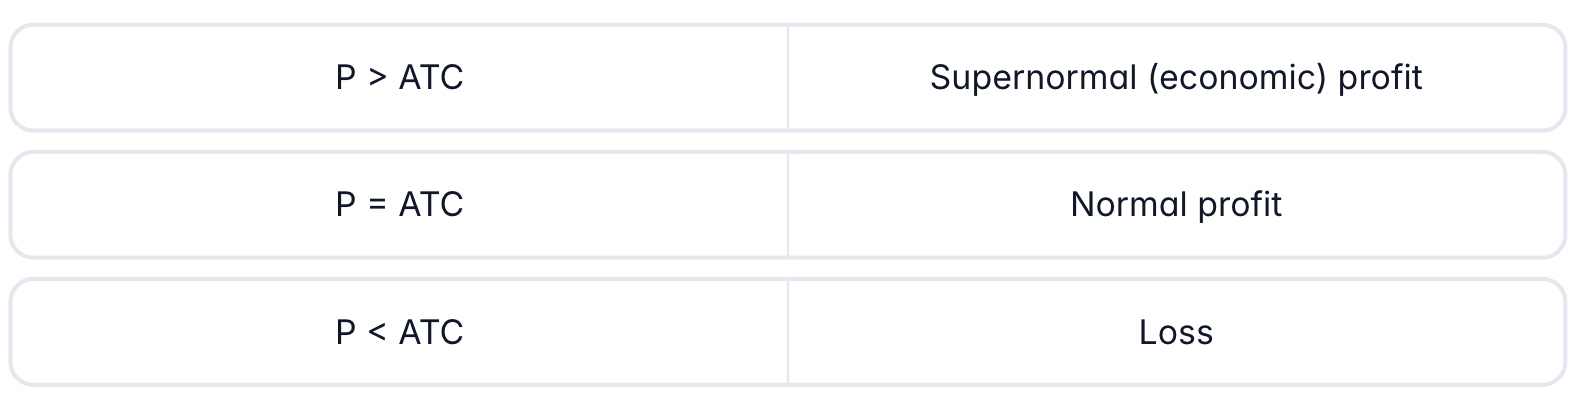
Identify the relationship between Price (P) and Average Total Cost (ATC) with the resulting type of profit per unit
Perfect Competition Long Run to Long Run
Supernormal profit → firms enter → supply ↑ → price ↓ → normal profit
Loss → firms exit → supply ↓ → price ↑ → normal profit
Long-run equilibrium: P = MC = ATC, no economic profit, productive & allocative efficiency achieved
The adjustment process continues until, at the profit-maximising output (MR = MC), price equals average total cost (P = ATC). At this point firms earn normal profit, there is no incentive for entry or exit, and the market reaches long-run equilibrium. The “cycle” of entry and exit only occurs if supernormal profits or losses exist.
*Profit-maximising output does not mean when it makes a profit, refer below table).
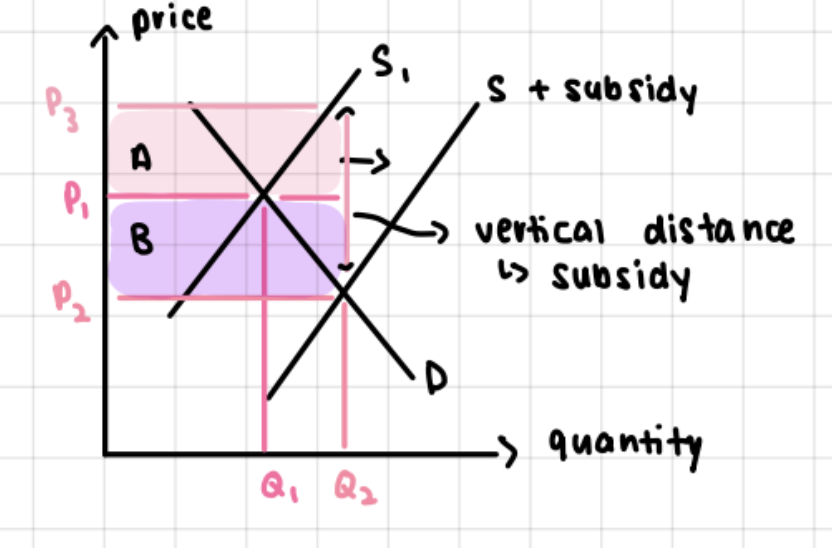
S and D with a subsidy
State difference in price labels
Analyse graph and explain DWL
Clearly state differences of consumer incidence of elasticities
State effects
Pink + Purple area is Subsidy Amount (P3-P2) x Q2
P1: Original price received by both buyer and seller
Price consumers pay decrease from P1 to P2
Price produces receive increases from P1 to P3
Producers receive P2 from consumers + Subsidy per unit from government
So Producer Revenue: P3 x Q2
Analysis:
Subsidy cause outward shift in supply
Increase QD to Q2
New eq P2Q2
Higher QD, lower P
DWL occurs because the cost of producing is higher than the value consumers place on them
When Demand is inelastic: Consumers receive higher surplus
Because consumers wont buy more, firms would have to decrease prices to have competitive value and ‘steal’ customers from other firms
When Demand elastic: Producers receive higher surplus
Producers can decrease price by a little and cause a large change in QD
When Supply is inelastic: Producers receive higher surplus
Gap between their cost and their price widens
Will not increase supply, price does not change as well
Gov want to ensure they can still stay in business (Pad their income)
Effects:
Final Price decrease, Quantity demanded increase, Quantity supplied potentially increase
Can help domestic industries → can help inc exports
Support specific industries with production costs
Can increase consumption of merit goods
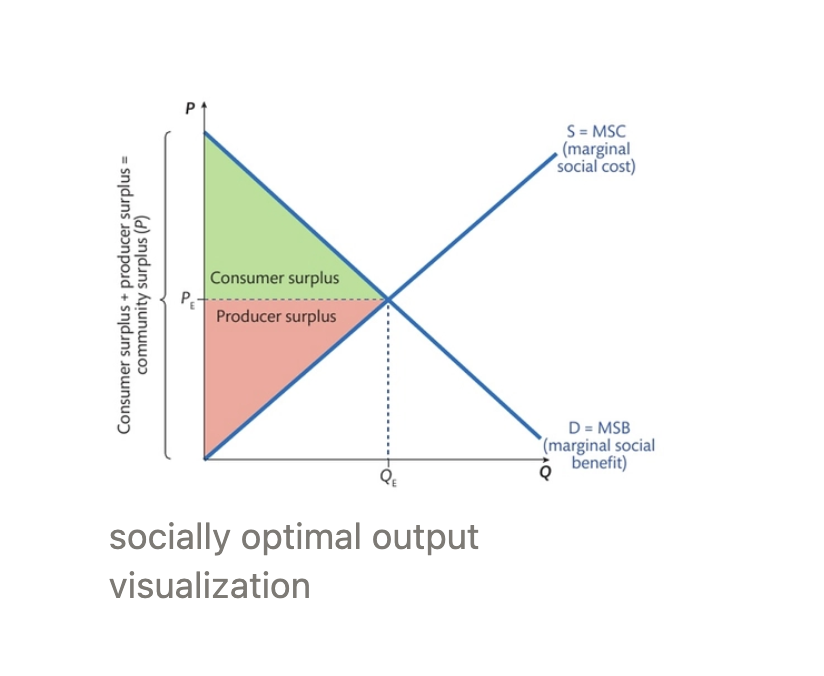
Socially optimum output, draw graph
State conditions
MSB=MSC (The point at which resources are allocated most efficiently, maximising overall societal welfare)
MPC=MSC (No external costs → no externalities)
MPB=MSB (No external benefits → no externalities)
When externalities exist, the free market does not produce at the socially optimal output
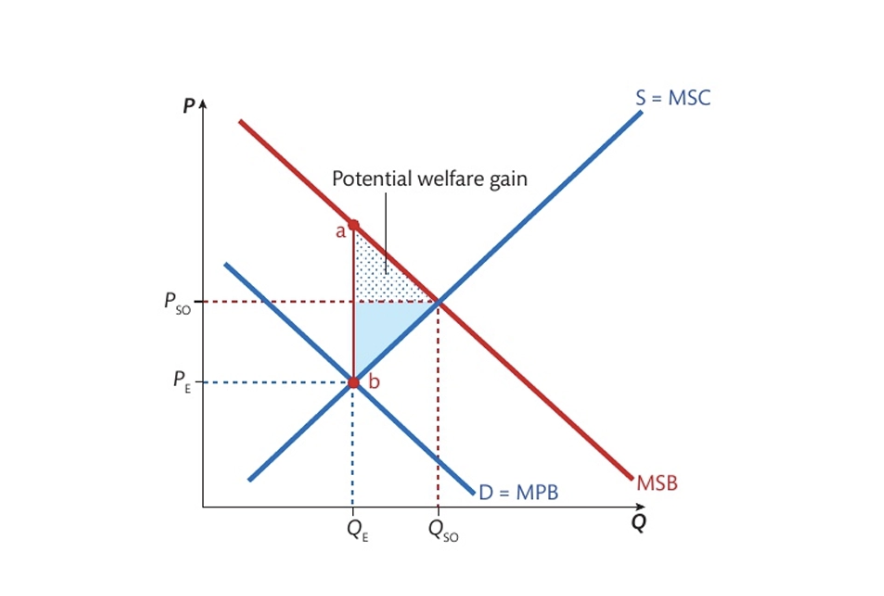
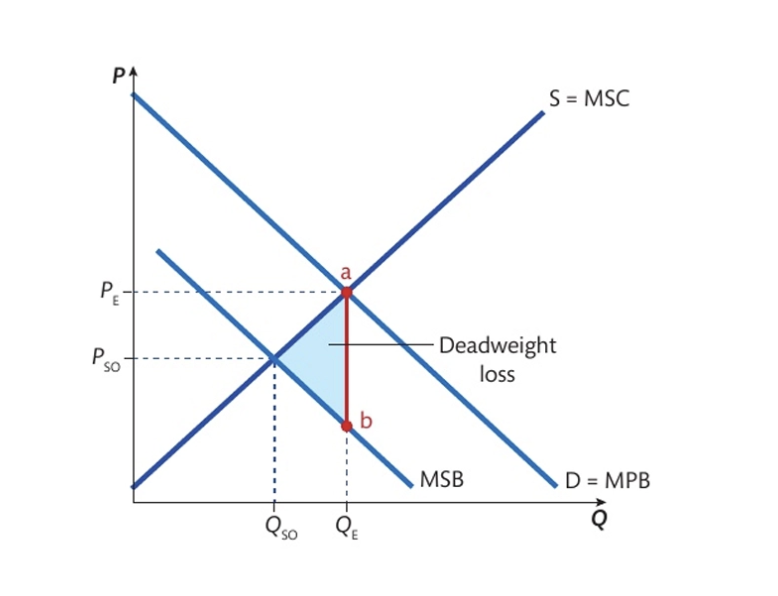
Positive consumption externalities
Draw graph
State condition and why
State level of consumption and why
State DWL and why
Give 3 examples
MSB>MPB since society values the good more than the private consumers does
Market under-consumes these goods as private individuals do not consider these extra benefits → producing a quantity lower than the socially optimal quantity (Qe < Qso)
Blue triangle: DWL (total benefit society would have enjoyed if extra units were consumed, as currently it is underconsumed,, e.g: A vaccine costs $50. A student only feels it’s worth $40 to them, so they don't buy it. But if they got it, it would save the community $30 in infection costs. Society misses out on a $70 benefit (Student health + Community safety) that only costs $50. We "lost" a $20 gain for the world.)
Examples:
healthcare (improves individual wellbeing while benefitting society by reducing disease spread and increasing productivity)
education (improves individual skill set but also contributes to more productive workforce, higher tax revenues, and societal progress)
public transportation (reduces traffic for private drivers)
Negative consumption externalities
Draw graph
State condition and why
State level of consumption and why
State DWL why
Give 2 examples
MSC < MPB since society experiences more harm than the private consumer acknowledges
Market over-consumes these goods as private individuals do not consider these additional costs → producing a quantity higher than the socially optimal quantity (Qe > Qso)
Blue triangle: DWL (costs to society exceeds the benefit due to overconsumption e.g: A driver uses a loud, high-emission car that causes $50 in noise pollution. The driver gets $150 of enjoyment from the trip. Society is "paying" $200 (the cost of the fuel + the $50 social damage) for a trip that only provides $150 of benefit to the driver.)
Examples:
demerit goods like cigs (second hand smoke) and alcohol ( inc risk of accidents and domestic violence)
overuse of common pool resources (like overfishing, deforestation, water pollution)
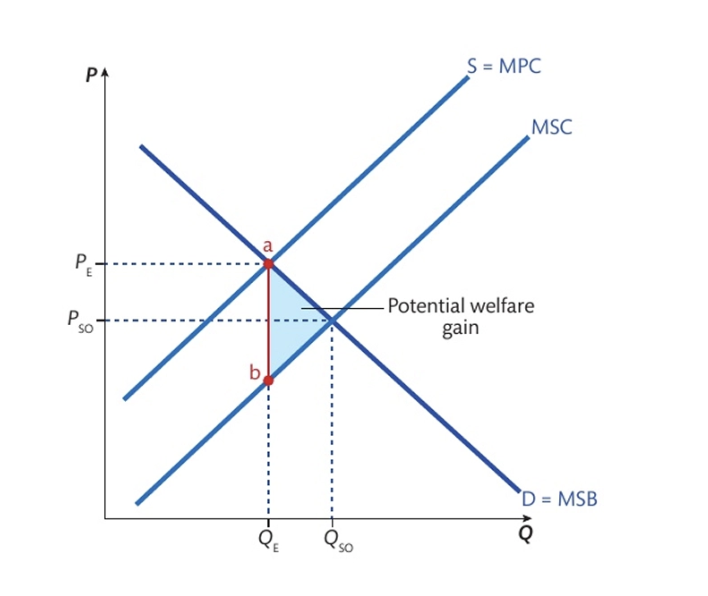
Positive production externalities
Draw graph
State condition and why
State level of consumption and why
State DWL why
Give example
MSC < MPC since social cost of production is lower than what private producers consider
Market under-produces these goods as firms do not account for these extra benefits → leads to a quantity lower than the socially optimal quantity (Qe < Qso)
Blue triangle: DWL (the total benefit society missed out on as they are underproducing, e.g: A beekeeper could add a new hive for $100. The honey is only worth $80 to him, so he doesn't do it. But that hive would also give the neighbors $40 in free apples. Society misses out on a $120 benefit (Honey + Apples) that only costs $100 to make. We "lost" a $20 profit for the world.)
Example:
Honey production (farmers gain by bees pollinating their crops, improving agricultural efficiency)
Negative production externalities
Draw graph
State condition and why
State level of consumption and why
State DWL why
Give 3 examples
MSC > MPC since society bears greater burden from production than firms acknowledge
Market overproduces these goods as firms do not consider these extra costs → quantity higher than socially optimal quantity (Qe > Qso)
DWL: Blue triangle (costs to society exceeds the benefits as they are overproducing, e.g: Smoke from a factory causing $200 in healthcare costs for someone that inhaled it. Product from the factory worth $300. Society paying $500 for a product worth only $300 to the buyer.)
Examples:
coal production (air pollution and dangerous working conditions)
textile manufacturing (often involves exploitative labor practices)
industrial agriculture (uses harmful chemicals that pollute air, water, and soil, affecting ecosystems and human health)