Lecture 7: Unified Growth Theory
1/86
There's no tags or description
Looks like no tags are added yet.
Name | Mastery | Learn | Test | Matching | Spaced | Call with Kai |
|---|
No analytics yet
Send a link to your students to track their progress
87 Terms
What did Oded Galor (2004) argue about demand for schooling?

What will UGT aim to explain?
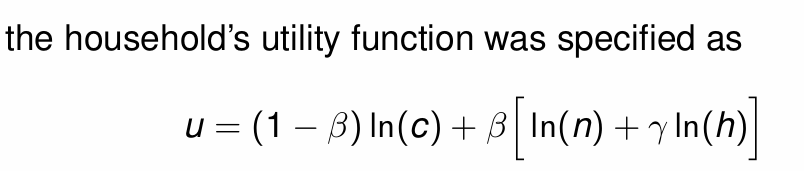
In our framework without education, what was the household’s utility function?
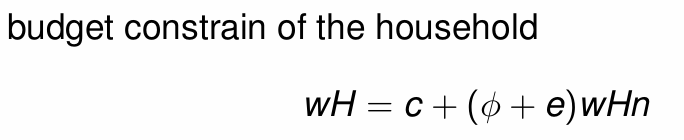
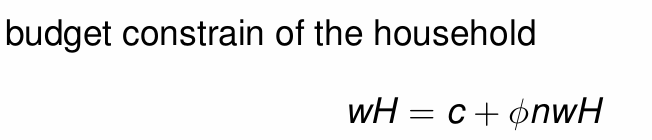
What was the budget constraint of the household?
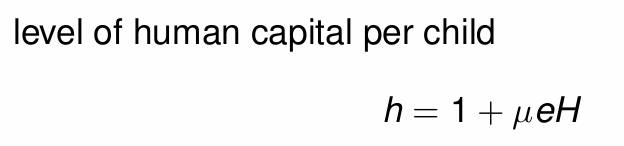
What was the equation for the level of human capital per child?
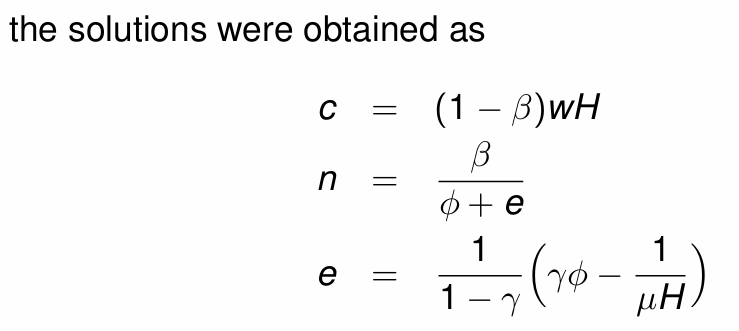
What were the solutions for c, n and e?
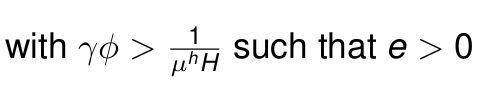
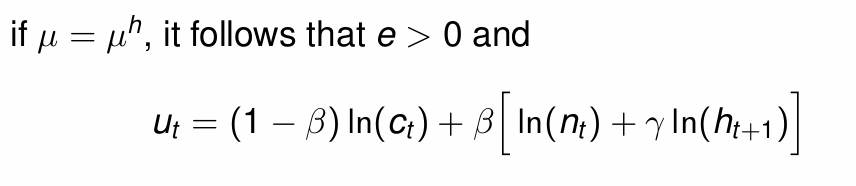
What condition does e > 0 require?

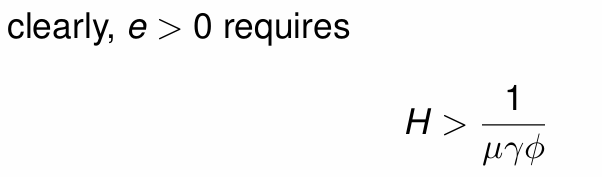
What does this tell us?
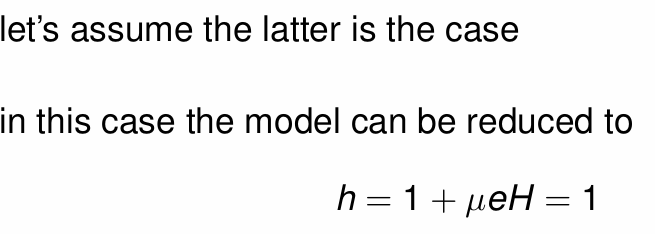
Assuming the reason is that the general productivity of education is too low, what is h equal to?
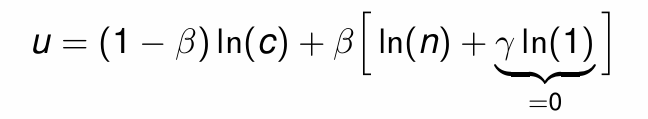
Hence, what does the household utility function become?
What is the budget constraint of the household?
Is this scenario pre or post industrial?

What were the main points from the Essay on the Principle of Population (1798) by Thomas Malthus?
What does it argue happens under favourable conditions?

What is the only restriction on fertility?

How does a low population impact land per capita ratios?

If population growth is high, what happens to land per capita ratios?
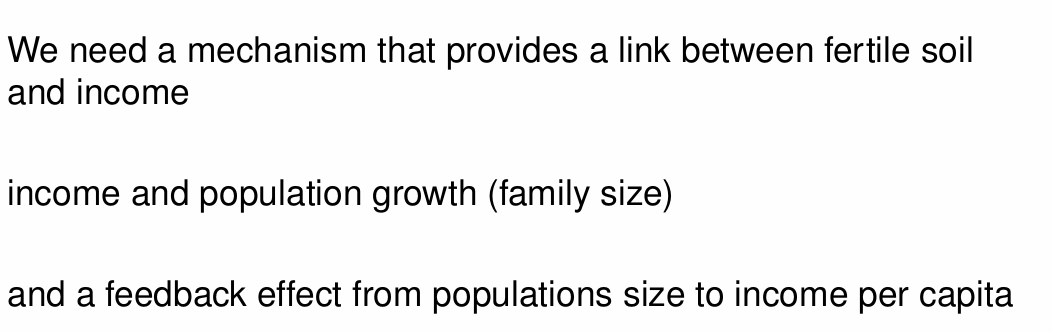
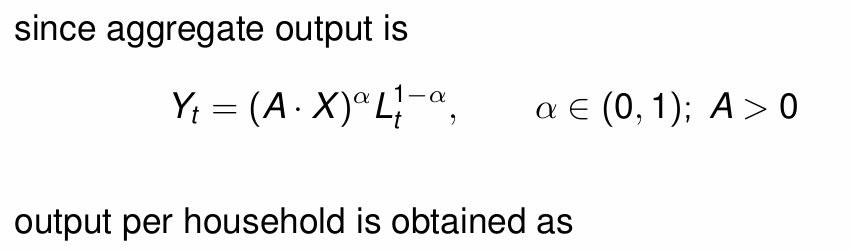
How can a Malthusian model be conceptualised within a dynamic general equilibrium framework?
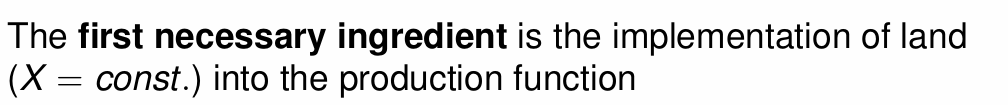
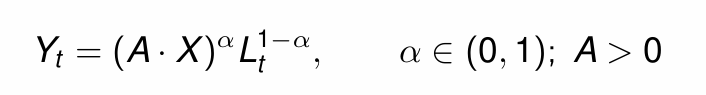
What is the first necessary part to implement?


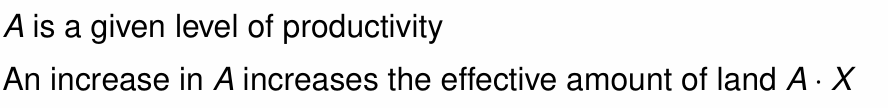
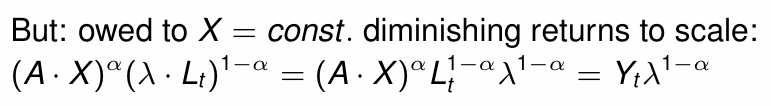
What happens as A increases?
What are X and Lt subject to?
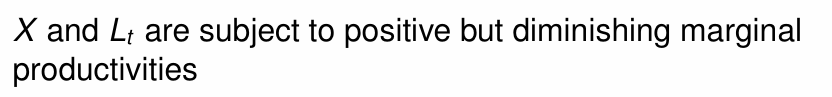
Given X is constant, what does it face?
What is the second component to implement?

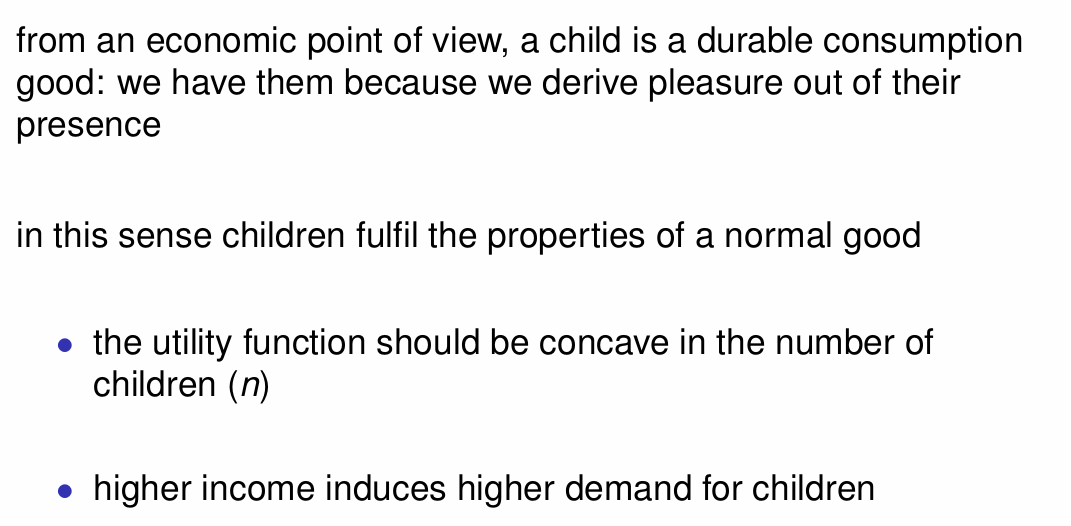
What type of good does a child represent and why?
What are the two periods in our Malthusian model?

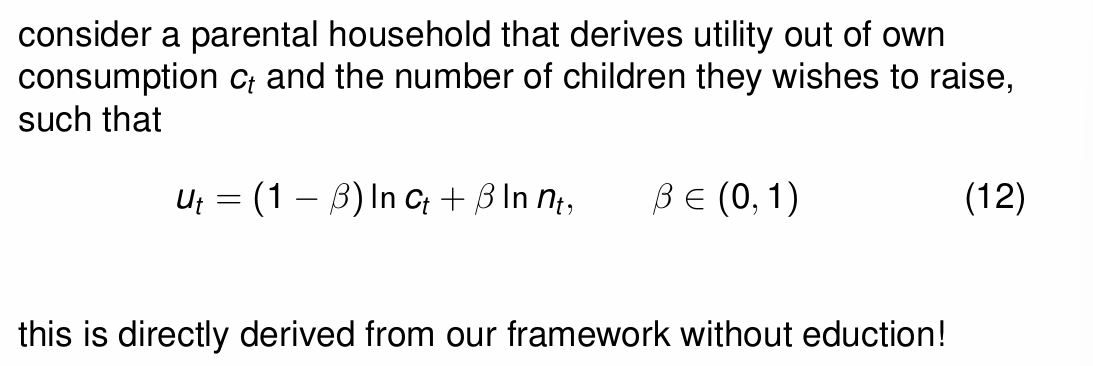
What is the utility function for the parental household?
What happens after period t to the parent household?

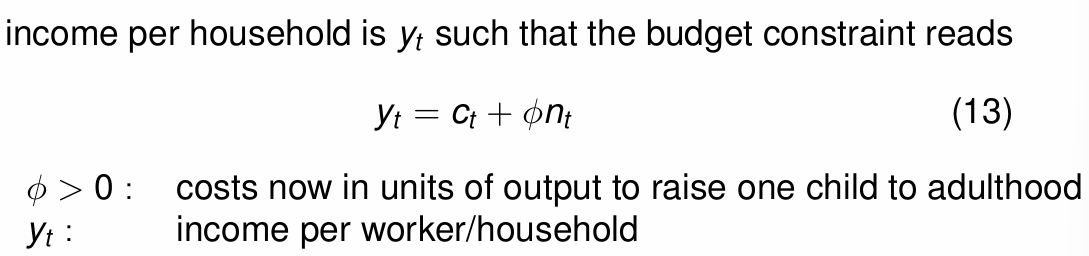
What is the budget constraint if income per household is yt?
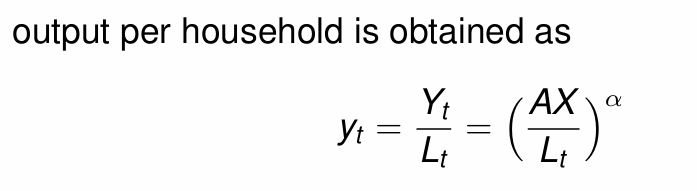

What does this tell us about the relationship between income an population size?

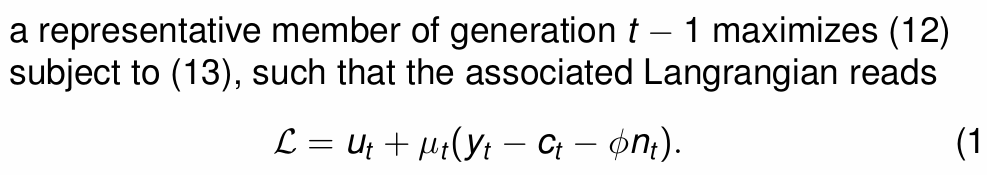
What is the Lagrangian obtained from from maximising household utility s.t. the budget constraint?

What are the FOCs?

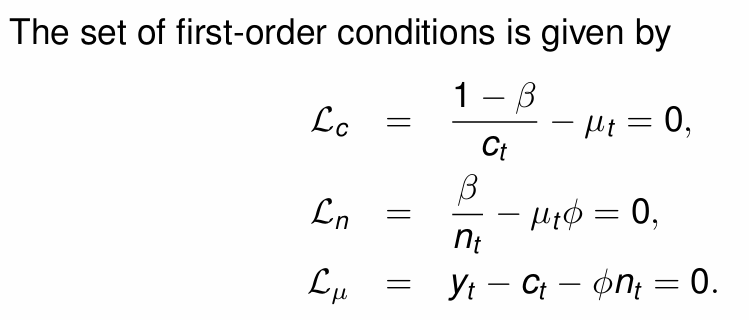
What are the resulting equations for ct and nt?
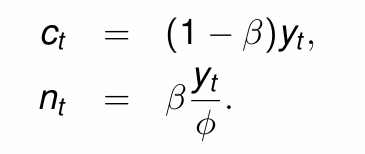

What do they tell us about the relationship between income and population growth?

What did Malthus predict about the level of population with a constant level of production?

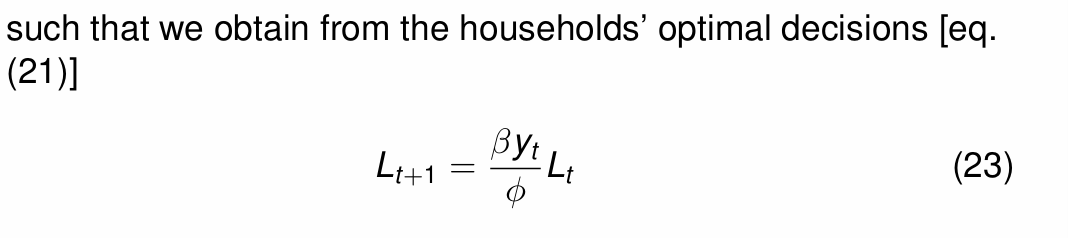
How do we denote the evolution of population size?


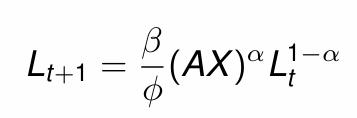
Substitute the solution for nt into the equation

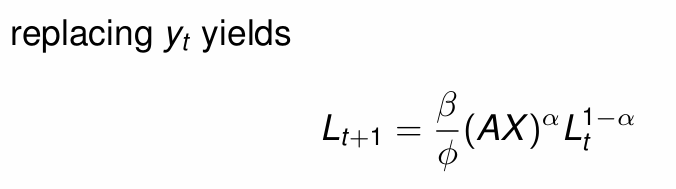
Substituting in yt gives what?
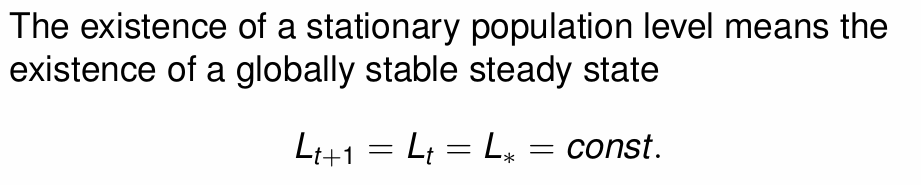
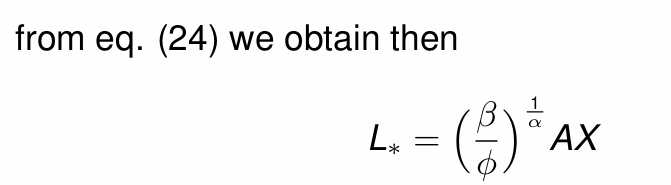
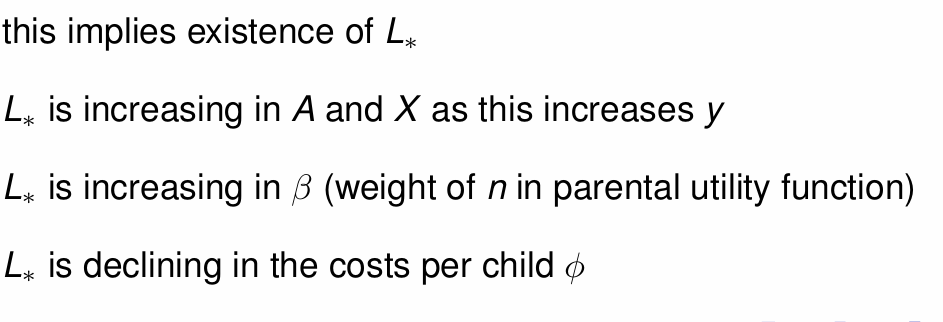
The existence of a stationary population level means what?
Hence, what is the equation for L*?

What is L* increasing and decreasing in?
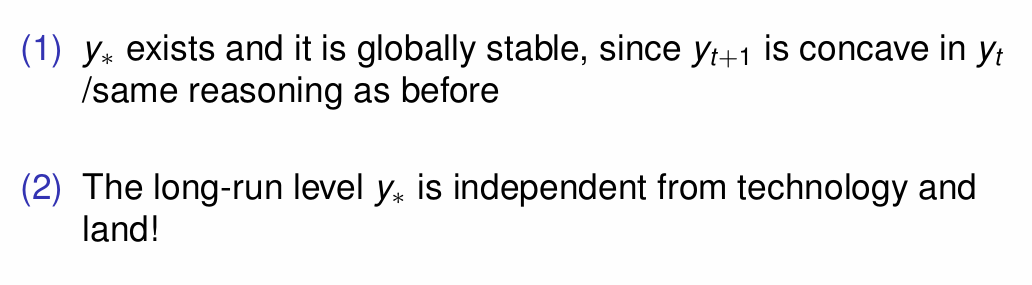
What does stability require about the shape of Lt+1?


Why does this hold?


What does (1) imply?

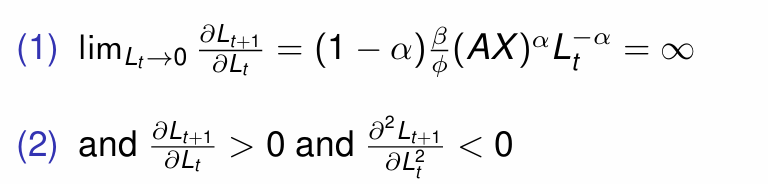
What does (2) imply?

Therefore, what does the economy converge to?


What is yt+1 (dynamics of income per capita)?

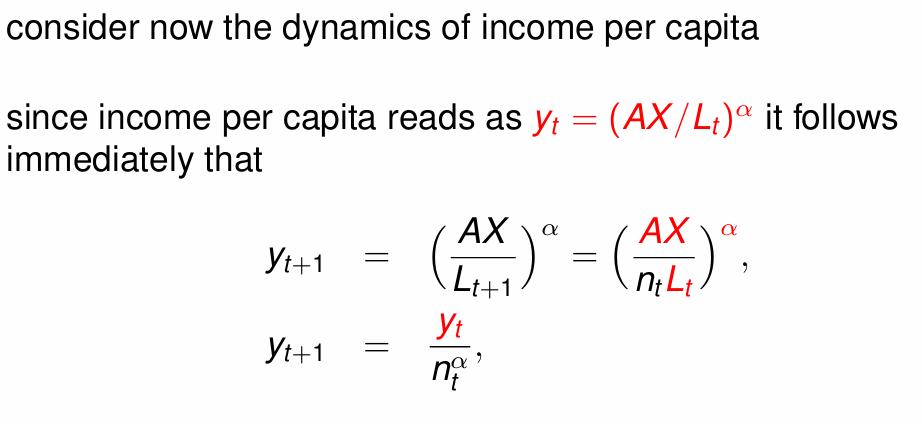
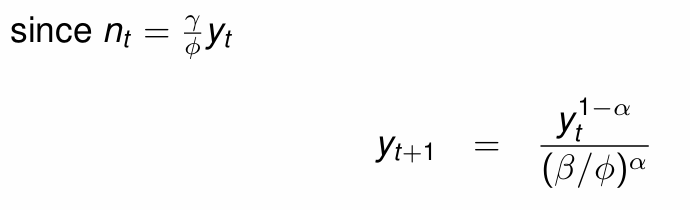
Substitute in nt
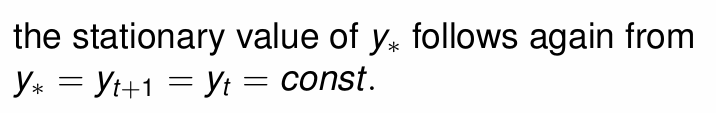
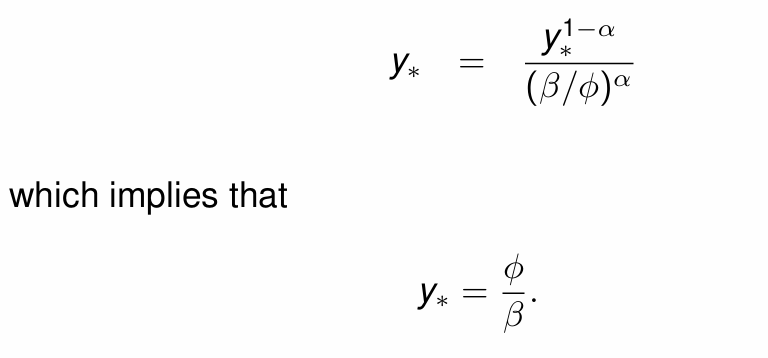
Hence, what is y*?

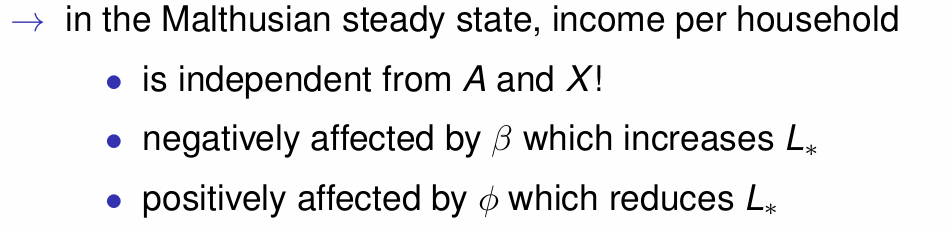
What does it tell us that y* is and isn’t dependent on?
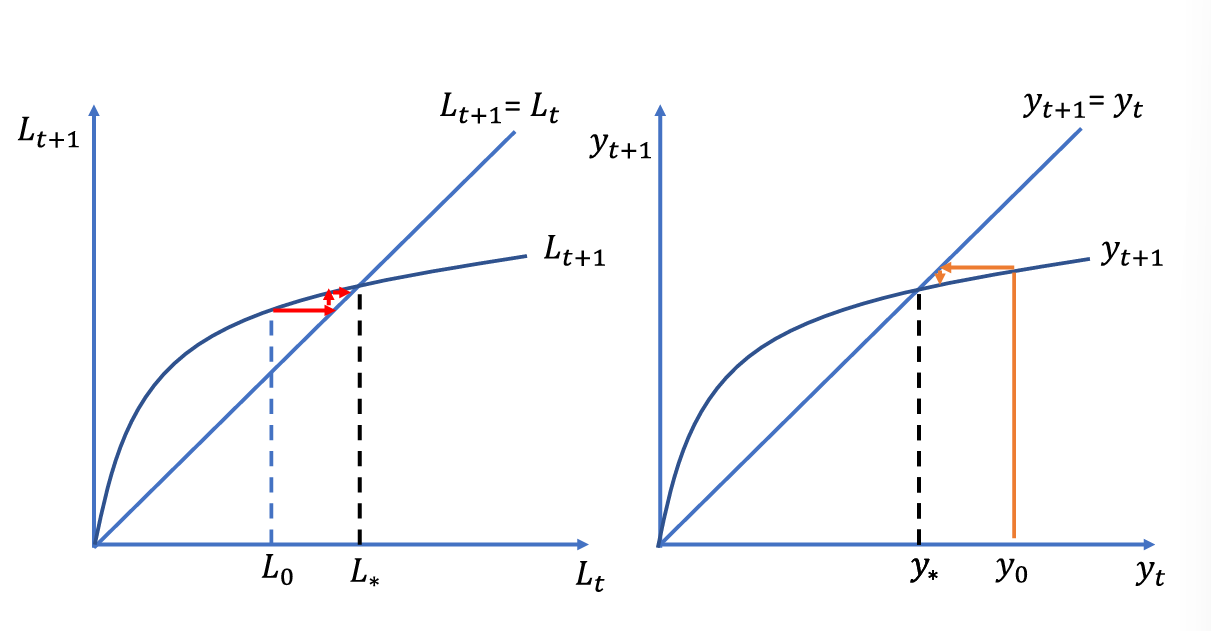
What are the diagrams for the steady state of L and y?


What do they tell us?
Therefore, what does superior technology translate to?

How do we show the impact of improved technology (increased A) on the graph?
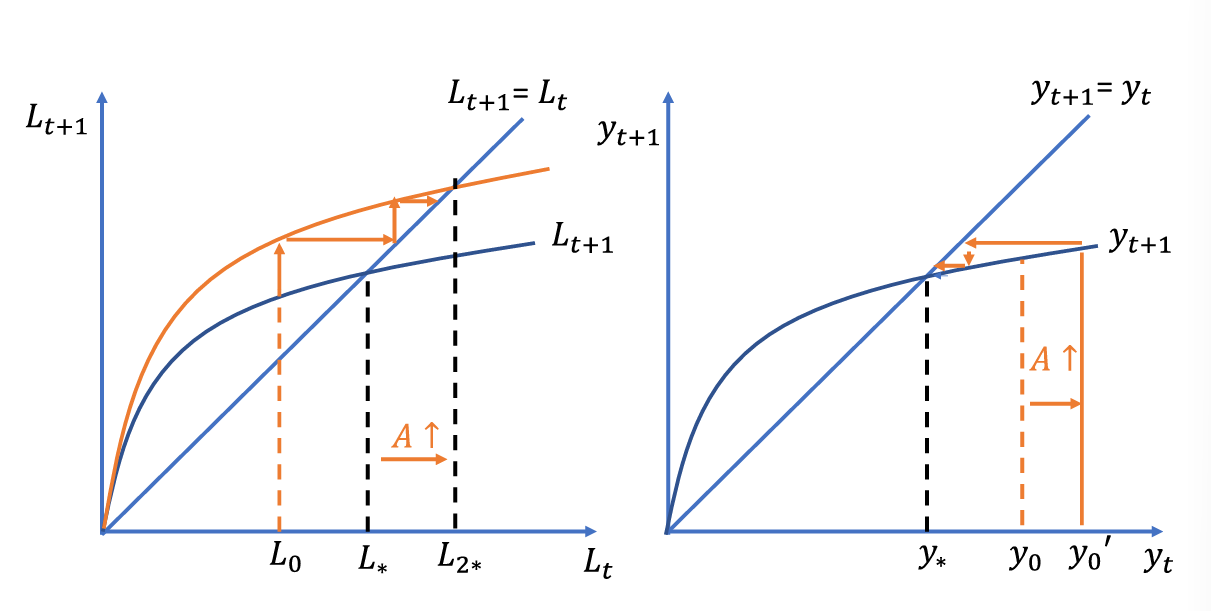
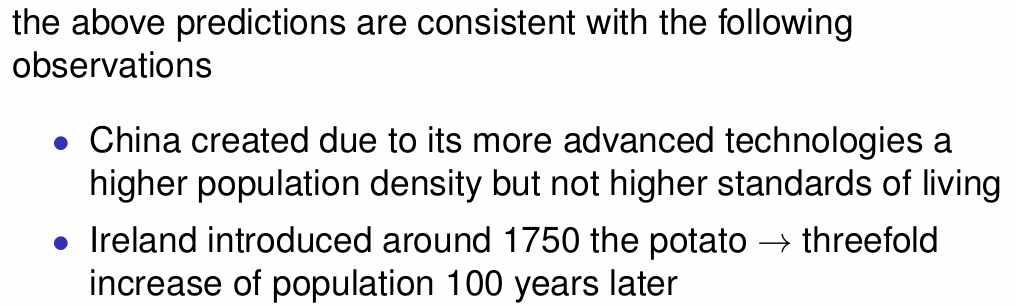
What is this result consistent with?
Hence, what do Malthusian forces imply that occasional technological advancements do to standard of living?
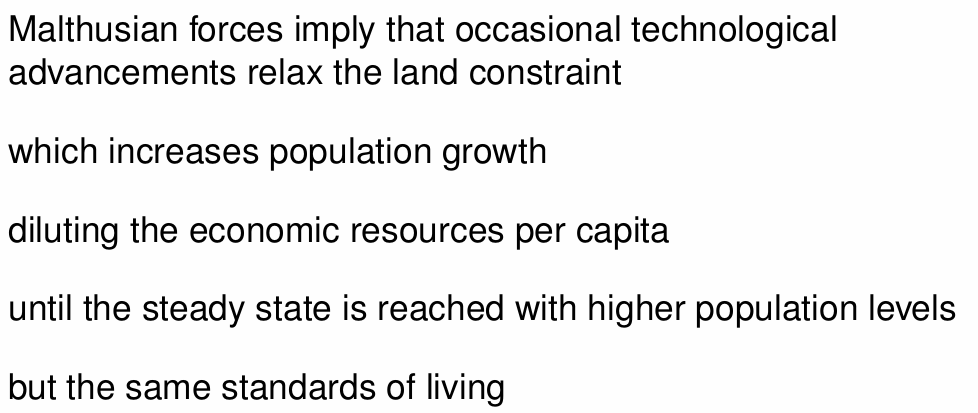
Only when is this possible?

What is that known as?

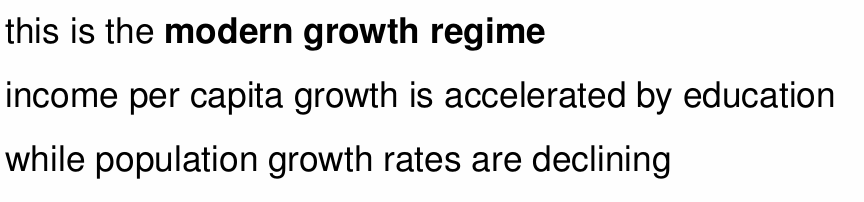
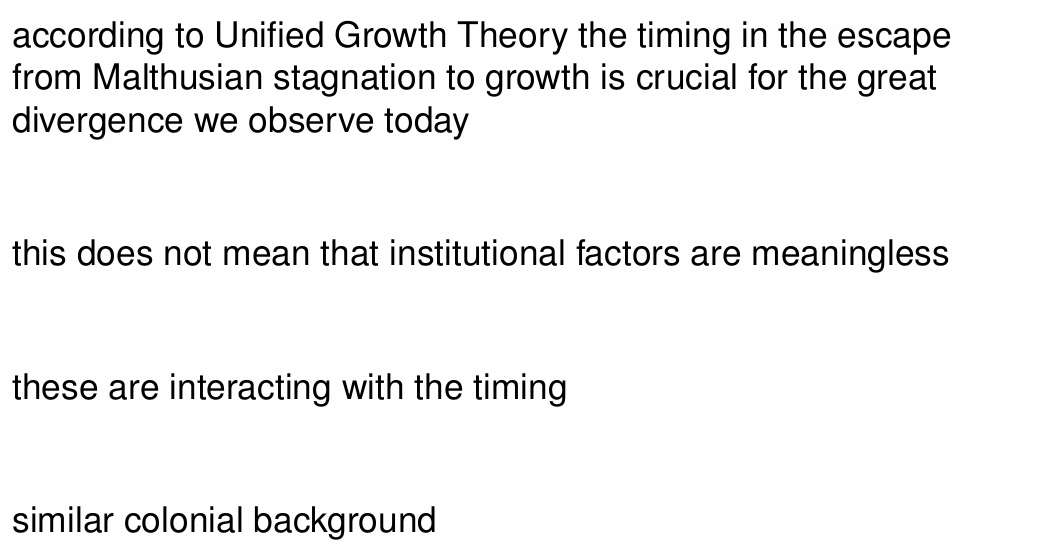
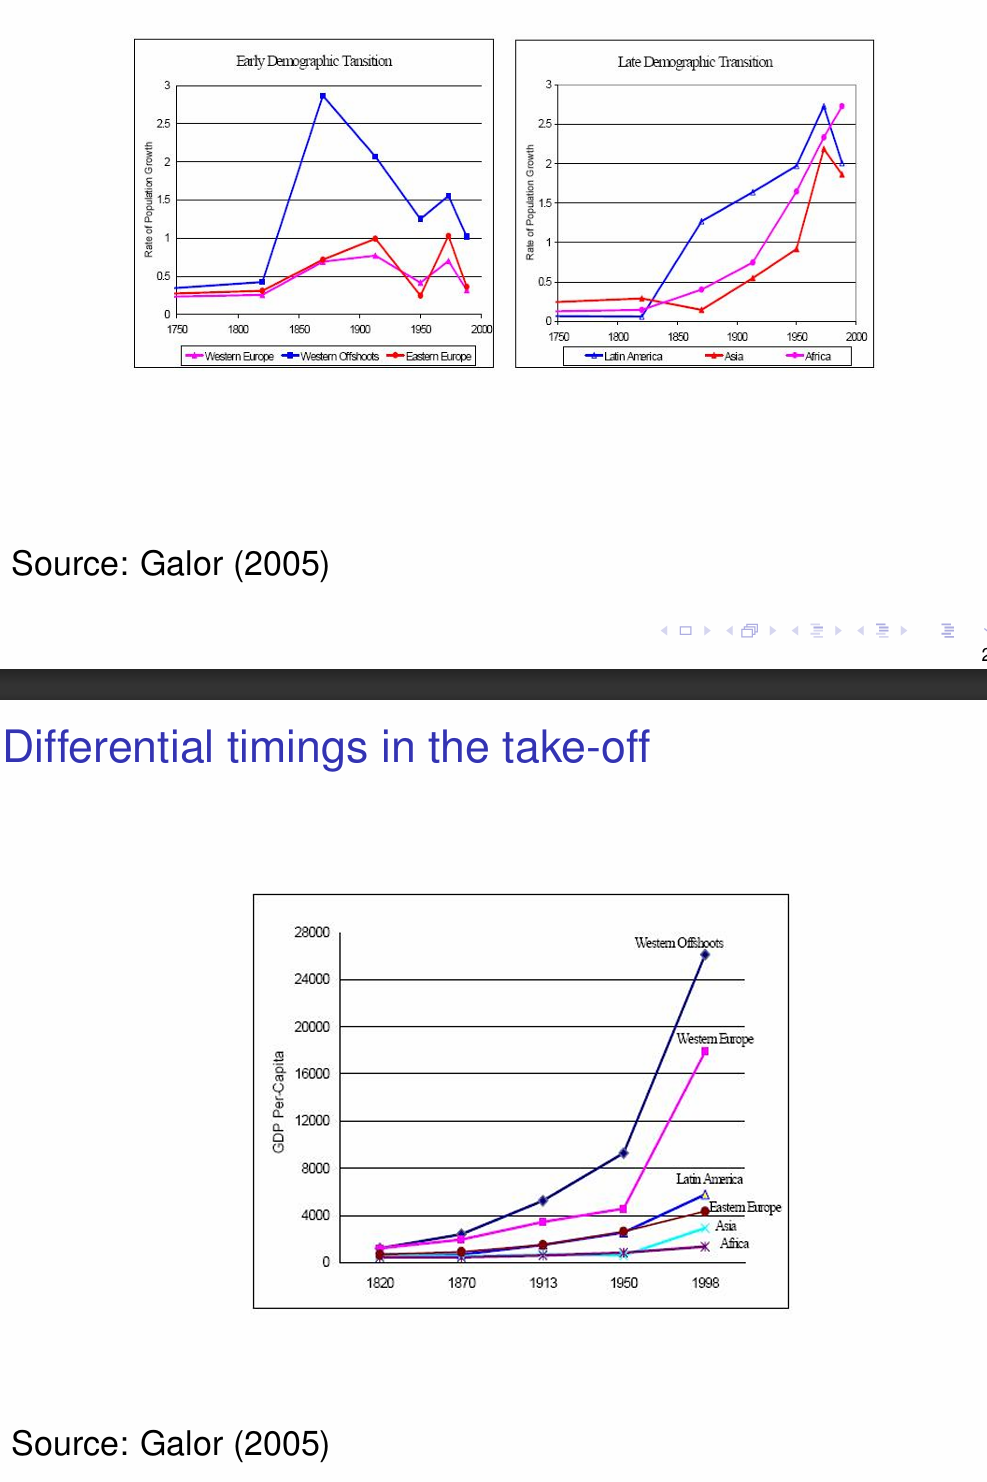
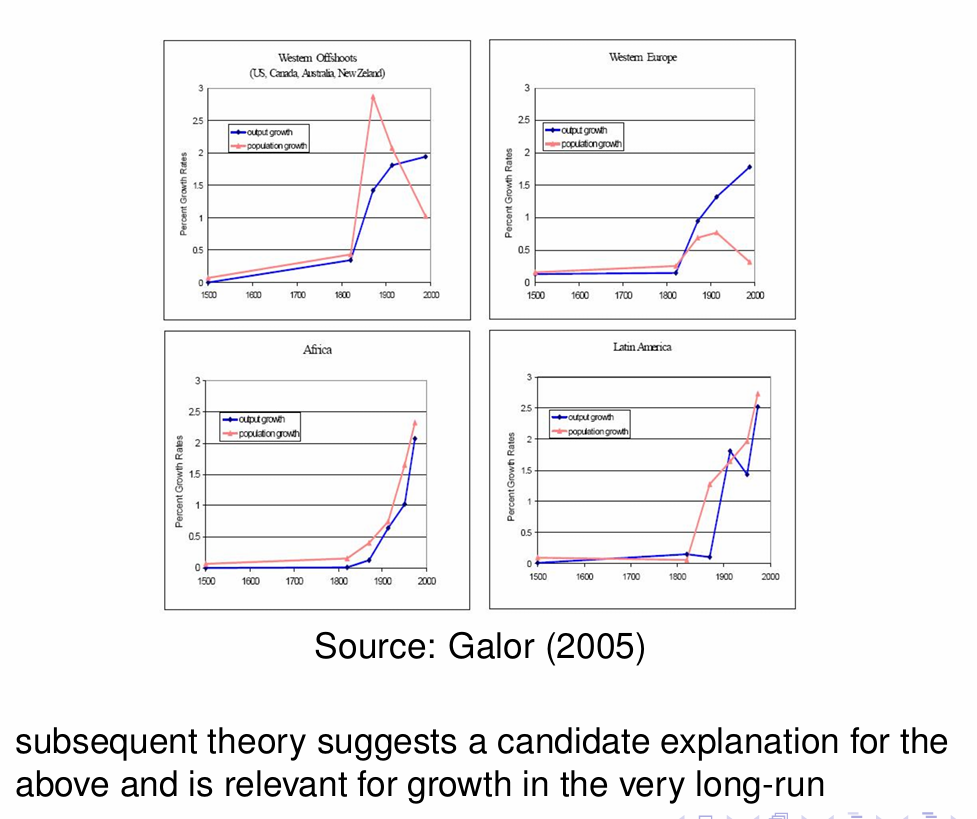
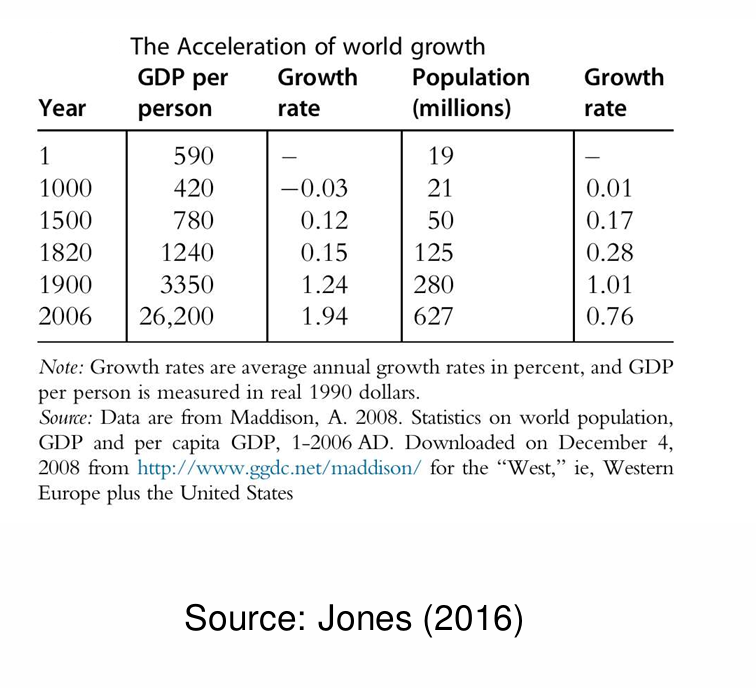
How has GDP per capita changed alongside the population over time?
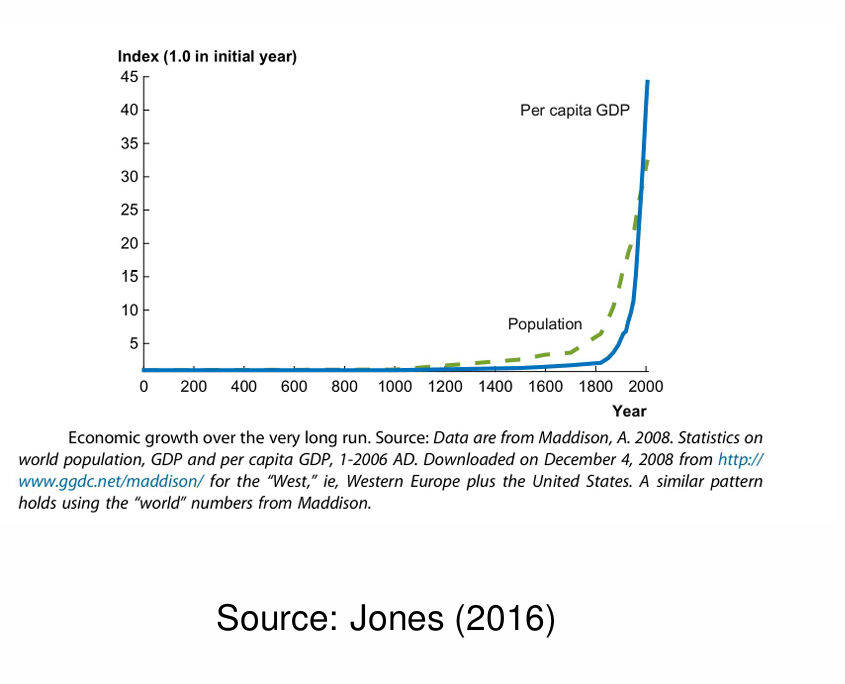
How has world growth changed over time?

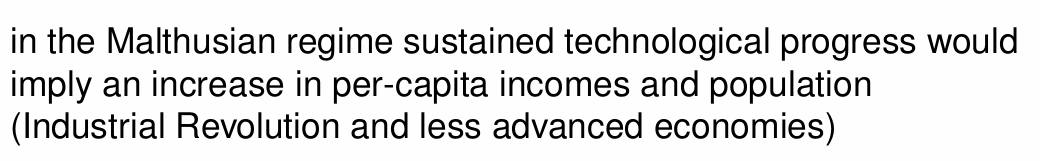
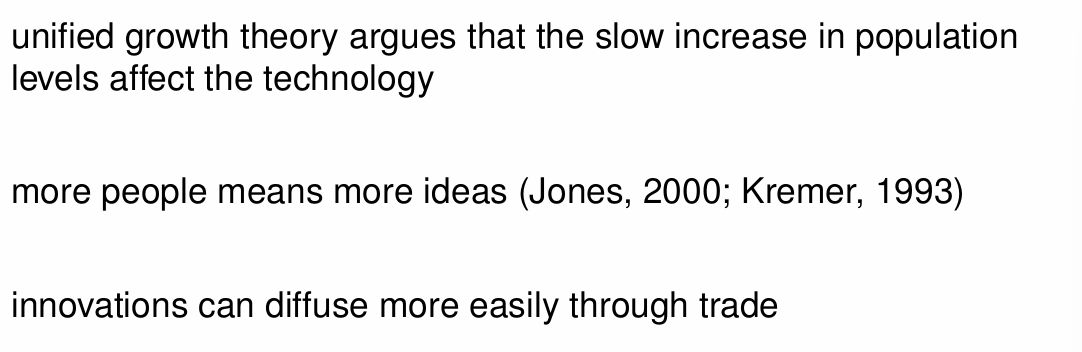
What does UGT argue about slow population increases?
For the post-Malthusian growth regime, how do we denote technological progress?
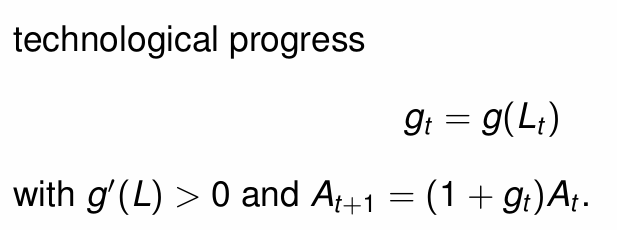
How does UGT capture regime switches?

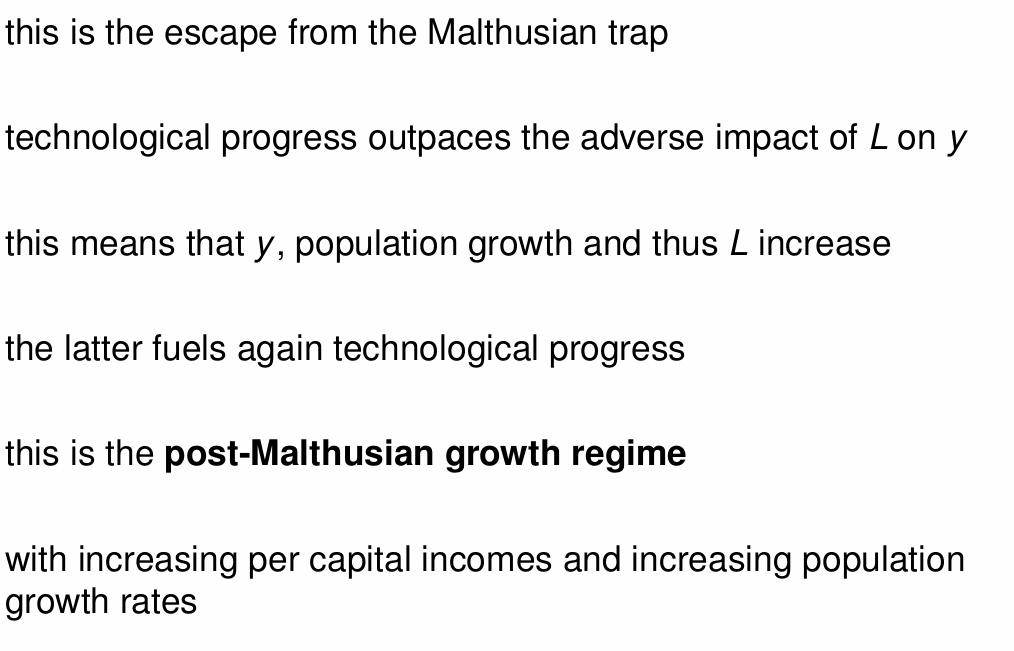
If the population has surpassed a critical level what happens?

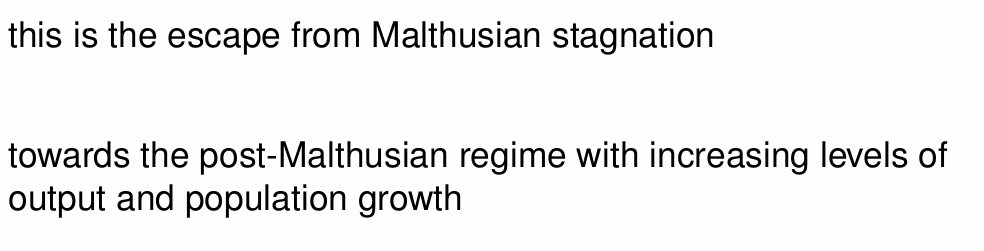
How does this imply an escape from the Malthusian trap?
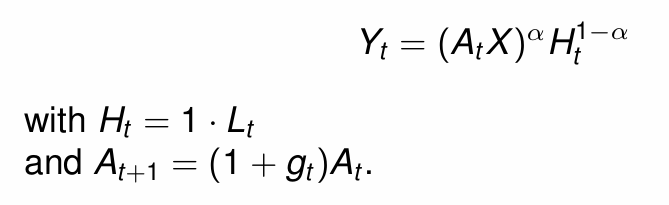
Hence what is the production function?
For the modern growth regime, what are the additional threshold effects represented by?

What is then possible?
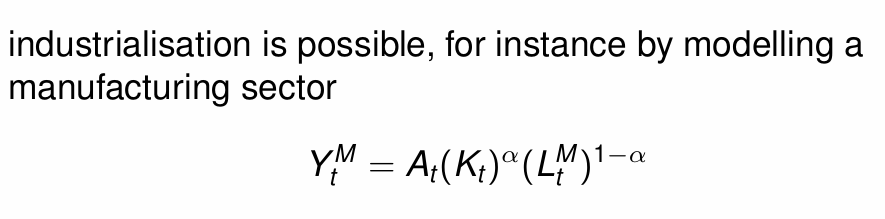
Industrialisation
How do we model the production function of the manufacturing sector?
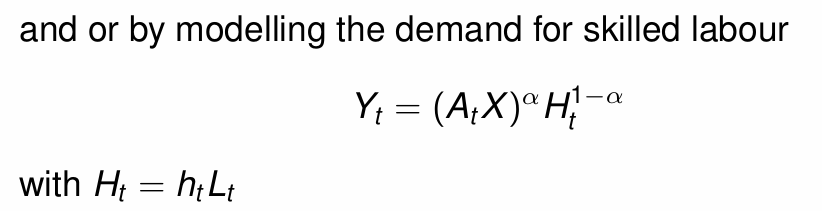
And what is the demand for skilled labour?
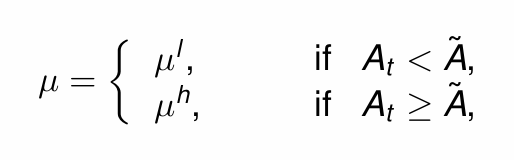
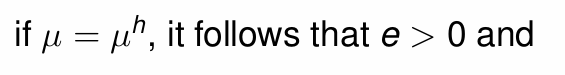
What are the values that µ can take?
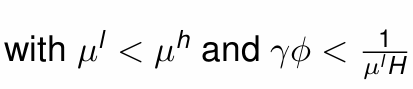
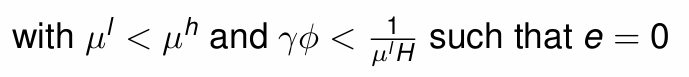
What happens to e?
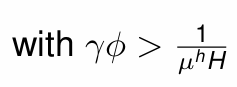
What happens to e?
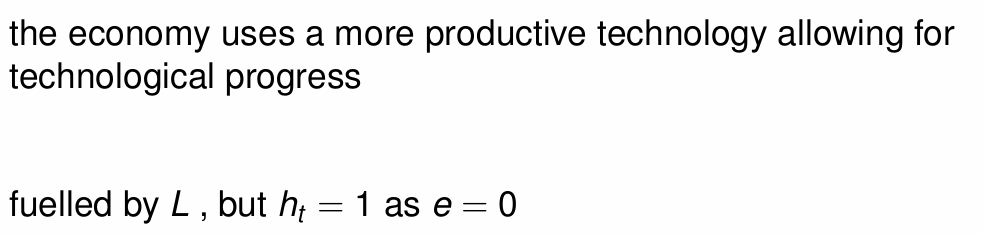
What fuelled the escape towards the post-Malthusian growth regime?

What did it allow for?

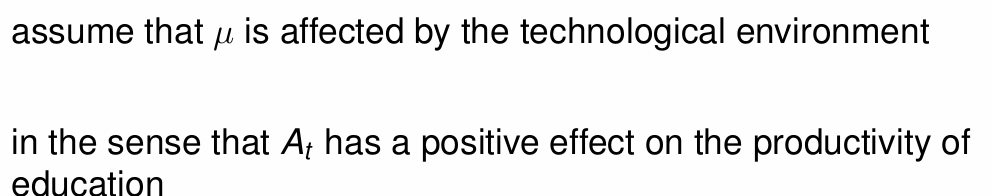
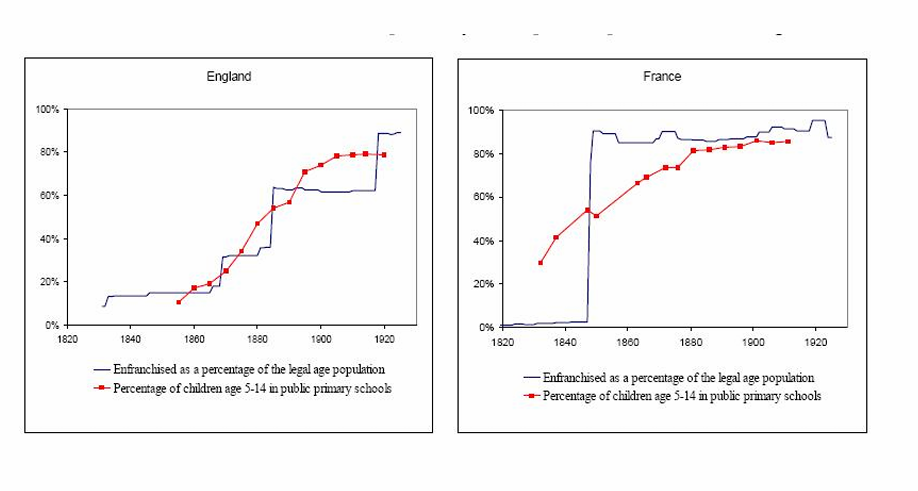
What did a higher level of A reflect?
How does this impact human capital and school attendance?
This makes education more productive in the acquisition of human capital, and this is reflected by the increase in school attendance
What is the household utility function?
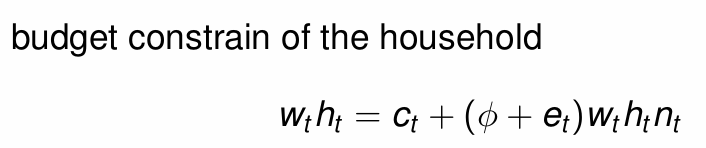
What is the budget constraint of the household?
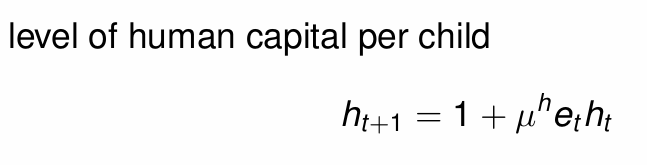
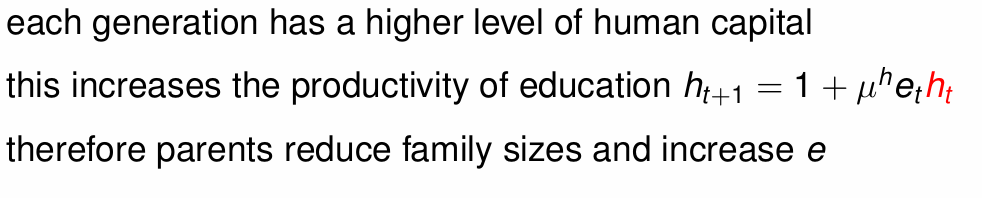
What is the level of human capital per child?
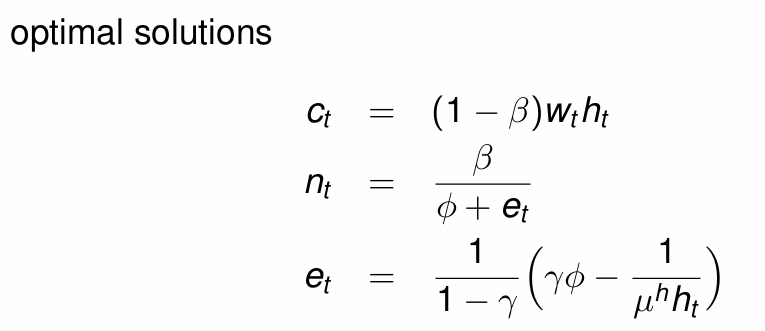
What are the optimal solutions for ct, nt and et?
How does each generation having a higher level of human capital lead to increases in e?
How does this impact output and the growth rate of A?
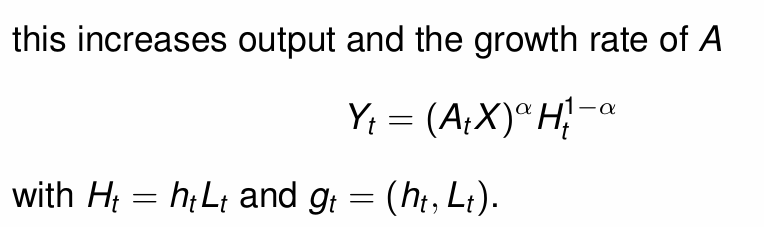
What does this represent?