M7: Query, visualize, and monitor data in Microsoft Sentinel
1/22
There's no tags or description
Looks like no tags are added yet.
Name | Mastery | Learn | Test | Matching | Spaced | Call with Kai |
|---|
No analytics yet
Send a link to your students to track their progress
23 Terms
What are workbooks in sentinel ?
Microsoft Sentinel Workbooks provide interactive reports that help you visualize important signals by combining text, table, charts, and tiles.
Workbooks are used to visualize data in e.g. dashboards
100s of templates are pre-built by Microsoft
Can be customized with KQL
Microsoft Sentinel collects logs from its integrated connectors and stores them in the ______ .
Azure Log Analytics workspace
The ______ is a repository that stores data and configuration information
Log Analytics workspace
Tabs in Advanced hunting of Defender portal ?
Schema: groups logs from different solutions into Schema / tables.
Functions
Queries: Create queries that retrieve data based on the expression that you provide
Shared Queries
My Queries
Community Queries: consists of predefined sample queries
Detection Rules
A ____ is a read-only request that processes data and returns the results of this processing without modifying the data or metadata.
query
A ______ is a collection of tables grouped under logical categories.
schema
____ character is used to separate commands and the output of the first command becomes the input of the next command.
pipe (|)
By default, Log Analytics limits queries to a time range of the past _____ hours.
24 hours. To set a different time range, you can add an explicit TimeGenerated filter to the query or use the Time range control
some of the most commonly used operators:
count. Returns the count of rows in the table.take. Returns up to the specified number of rows of data.project. Selects a subset of columns.sort. Sorts the rows of the input table into order by one or more columns.top. Returns the first N records sorted by the specified columns.extend. Computes derived columns.summarize. Aggregates groups of rows.render. Renders results as a graphical output.
To combine the records from two sources (tables), you can use the _____ operator.
The _____ operator combines two or more tables into one.
join
union
Q1) Which one of the following tools can an administrator use to query data in Microsoft Sentinel?
Structured Query Language (SQL)
PowerShell
Azure Data Explorer
Azure Data Explorer, which is also known as Kusto, is a log analytics cloud platform optimized for ad-hoc big data queries.
Q2) Which one of the following characters can an administrator use to separate the commands in the query.
Pipe (|)
Hyphen (-)
Underscore (_)
You can use the pipe (|) character to separate commands.
______ contains out-of-the-box detections, exploration queries, hunting queries, workbooks, playbooks, and more to help you secure your environment and detect threats.
The Microsoft Sentinel repository on Github
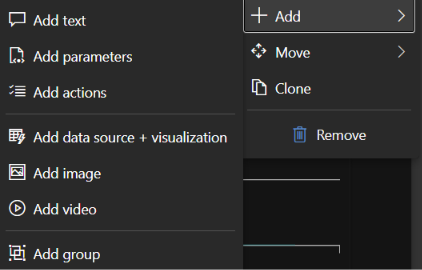
workbook visualization types and elements:
Elements Types:
Text
Query
Query Settings
Visual Formatting
Step Settings
Advanced Editor
Parameters
Links/tabs
Metric
Visualization Types in Query item
Grids (or tables)
Area charts
Bar charts
Line charts
Pie charts
Scatter charts
Time charts
Tiles
Types of elements we can add to your workbook ?
For text visualization you can edit the text using the ____ language, which provides different formatting options for headings, font styles, hyperlinks, and tables.
Markdown markup
Markdown is a markup language that you can use to format text in plain text documents. For more information on how to format text by using Markdown controls, see the markdown guides available online.
What is Parameter element type ?
In a Microsoft Sentinel workbook, a Parameter is used to create interactive filters and dropdown menus at the top of your dashboard. [1]
Instead of hardcoding values (like specific dates or computer names) directly into your KQL queries, you map your queries to a parameter. This allows analysts to dynamically filter the entire workbook's charts and tables on the fly without editing code.
The Purpose of a Parameter
Dynamic Filtering: Allows users to easily change the time range, choose a specific subscription, or filter by a particular user account. [1]
Interactivity: Selecting a value in one dropdown parameter can automatically update all the visual graphs, maps, and text grids below it.
Scoped Access: It enables the workbook to be highly reusable across different teams or workspaces because users can change the scope via the dropdown parameters. [1, 2]
1) Dropdown List (Drop down)
Usage: Creates a custom dropdown menu populated either by a static list you type in, or dynamically populated by a background KQL query.
Example: A dynamic dropdown that runs
SecurityEvent | distinct Computerso analysts can select a specific server from a list to filter the dashboard.
2) Text Input (Text)
Usage: Provides a free-form search text box.
Example: Great for threat hunting dashboards where an analyst wants to type in a specific IP address or Username to immediately check if it appears anywhere in the environment.
You can use ______ in your interactive workbook to manipulate the results of the query in different ways.
parameters
Parameter types:
Text. You can enter arbitrary text.
Drop down. You can modify the appearance of a query step to include a dropdown menu in which you can select a value from a set of values. In this parameter type, you can enter a KQL query or a JSON string to provide the choices for the dropdown list.
Time range picker. You can select from prepopulated time ranges or select a custom range.
Resource picker. You can select one or more Azure resources.
Subscription picker. You can select one or more Azure subscription resources.
Resource type picker. You can select one or more Azure resource type values.
Location picker. You can select one or more Azure location values.
Options group. You can group multiple properties into group.
Tabs.
Multi-value.
You can reference parameter values in other parts of the workbooks either by using ______ or by using ______.
bindings and value expansions
You can add a ____ step to customize the navigation in the workbook with tabs, lists, paragraphs, or bullet lists.
links/tabs
links/tabs options
Text before link. Use this option to display the text before the link is selected.
Link text. Use this option to specify the actual text that is displayed in the link.
Text after link. Use this option to indicate the text that is displayed after the link is selected.
Action. Use this option to specify the action that is performed when you select the link, such as Url, Set a parameter value, and Scroll to a step.
Value. Use this option to indicate a value for the link.
Settings. Use this option to configure specific settings based on the link type and support parameters syntax.
Context pane?. Use this option to open a new context panel to the side instead of a full view.
Style. Use this option to select between Link, Button (primary), and Button (secondary) styles.
You can use _____ steps to combine the results of the workbook with metrics from different Azure resources
metric