Applied Economics
1/53
There's no tags or description
Looks like no tags are added yet.
Name | Mastery | Learn | Test | Matching | Spaced | Call with Kai |
|---|
No analytics yet
Send a link to your students to track their progress
54 Terms
Applied economics
the application of economic models and theories/concepts in every day living
Scarcity
resources are limited
people have unlimited ____ & _____
needs, wants
Economics
the efficient allocation of available resources
Absolute advantage
the ability to produce more output compared to another entity
comparative advantage
an economy’s ability to produce a specific good/service at a lower opportunity cost
opportunity cost
the benefit you give up because you choose to take one action in favor of another
economic goods
goods and services used extensively in economic discussions (it covers goods, services, products, and the like that have a price and are sold in a market).
WHAT GOODS TO PRODUCE?
HOW TO PRODUCE AND HOW MUCH?
FOR WHOM TO PRODUCE?
Basic economic problems
Factors of production
land
labor
capital
entrepreneurship
Land
available natural resource
typically cultivated or improved for use in production
factor income is rent
Labor
represents human capital like workers and employees
the return on this is wage
Capital
represents physical assets like production facilities, warehouses, equipment, and technology used in the production of goods and services
factor income is interest
Entrepreneurship
represents the factor that decides how much of and in what way the other factors are to be used in production
the return on this is profit
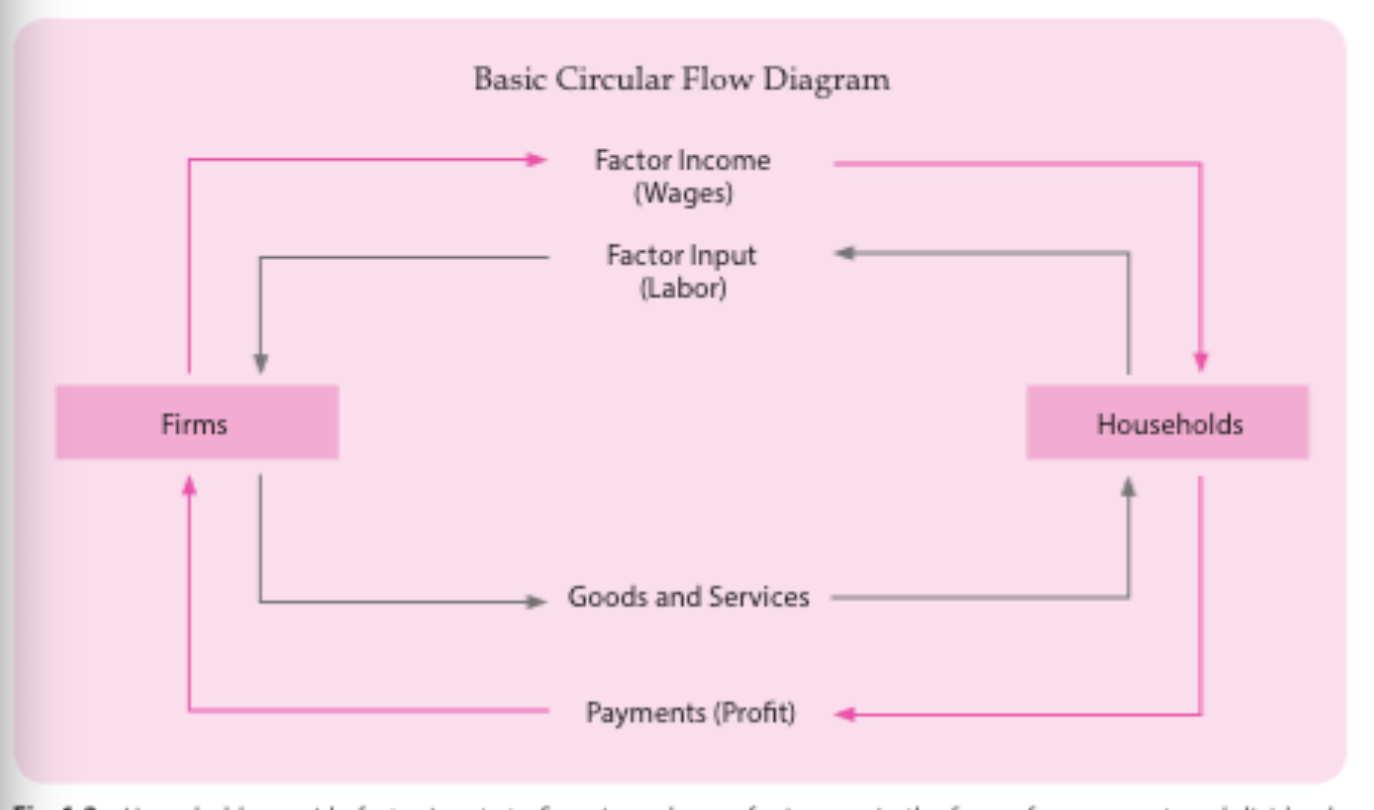
Circular flow diagram
an economic diagram that illustrates the flow of factors of production in the economy.
The circular flow diagram in its most simple form
Production possibility frontier (PPF)
application of the concept of allocation of resources and factors of production
determined by the availability and efficient use of its inputs of production
Qualitative Approach
focuses on directional relationship of different economic variables
often used interchangeably with descriptive analysis
Quantitative approach
involves mathematical and statistical analysis of economic data
complements qualitative analysis by providing figures that support descriptive findings
Economic Variables
used to signify elements in an economic model
a variable is an element that can change in contrast to a fixed one
Functions
explains the relationship between two or more economic variables
Graph
provides visual representation of the relationship between two or more economic variables
Economic theories
simplify economic phenomena
statements or observations on the relationship of variables
Marginal Utility Theory
states that people buy goods that give the highest personal satisfaction
further explains that a rational person will maximize his or her utility given some constraints like budget or income
Economic Models
representations of economic and social phenomena analyzed using research, observations, and testing
Ceteris Paribus Assumption
Ceteris Paribus - a latin term that translates to “all else being the same”
implies that there are other elements which may affect the model but for the pertinent study, the model focuses only on specific variables
a form of acknowledgment of the limitation of the model
Time-series Data
data collected for particular elements for several time periods
Cross-Sectional Data
includes different variables for a single time period
Normative economics
evaluates economic decisions, policies, or outcomes as good or bad
based on opinion and is subjective
Positive economics
evaluates economic scenarios and policies based on qualitative and quantitative analysis
factual and objective
Main branches of economics:
Microeconomics and Macroeconomics
Microeconomics
examines the individual or company level
Macroeconomics
studies the aggregate or country level
Microeconomic Concepts
Utility
Marginal Utility
Law of diminishing marginal utility
upward sloping utility curve
indifference curve
indifference map
budget line
equilibrium position
Utility
refers to the value or satisfaction derived from the consumption of a good
Marginal Utility
the additional satisfaction from the consumption of an additional unit of a good, keeping other things constant
Law of diminishing marginal utility
for every additional consumption your marginal utility or your level of satisfaction is declining
upward sloping utility curve
a scenario where one of the two choices is an economic "bad" (e.g., pollution, commuting time) rather than a good
indifference curve
when the consumer behavior of not being affected by the quantity consumed of a good in favor of another is illustrated by this concept
indifference map
shows a group of indifference curves
budget line
represents the income constraint of a consumer
equilibrium position
represented by the tangency point of the budget line with the highest indifference curve
Disposable income
income after taxes
Discretionary income
income left from disposable income after all other necessary non tax expenses have been deducted
Gross Domestic Product (GDP)
the total value of final goods and services consumed during a given period, usually on year
GDP Growth
the rate of increase in the GDP value from one period to another which is expressed as a percentage
“Final”
emphasized in the value of goods and services derivation of GDP to avoid double counting
Final goods
goods and services are the products bought or consumed by end consumers
Nonproduction transactions
excluded in the GDP value
includes: transfer payments, social security benefits, financial market securities, such as stocks and bonds certificates
Two ways to measure national income
output approach
expenditure approach
Output Approach
looks at output and evaluates what goods and services are factored in
Expenditure Approach
considers the value or expenditure associated with eh purchase of goods and services
Nominal GDP
derived when the value of goods is expressed in current prices
Real GDP
adjusted for inflation and is expressed at constant or base year prices