HDE 120: Exam 1
1/82
There's no tags or description
Looks like no tags are added yet.
Name | Mastery | Learn | Test | Matching | Spaced | Call with Kai |
|---|
No analytics yet
Send a link to your students to track their progress
83 Terms
Why conduct research?
To answer questions/ understand human behaviors
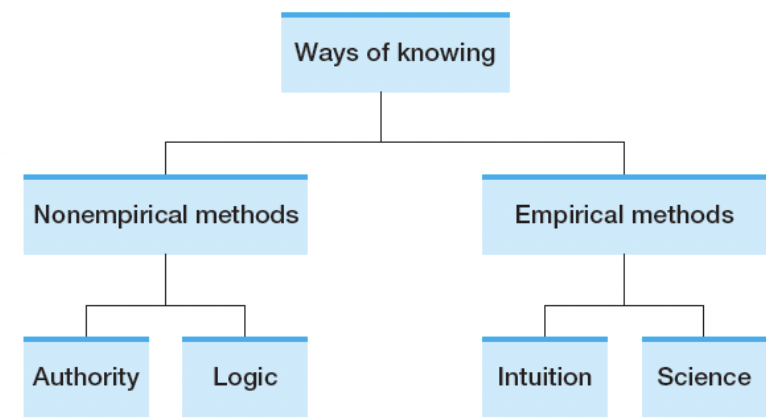
Ways of Knowing
Authority, Logic, Intuition, Thinking(Science)
Ways of Knowing- Authority
Experts share opinions, rather than facts. Can be wrong.Change over time
EX: Prof is sharing her opinion, can be wrong and change over time. Not necessarily correct, can be wrong and change over time
Ways of Knowing- Logic
Important, but…
A: Learning improves academic performance
B: Early childhood education benefits learning
C: Early childhood education improves academic performance
Is it logical? Based on the first 2 statements (A/B) → It is logical, but it is only correct if the first 2 statements are correct.
But the first 2 statements are not necessarily correct → Requires observations/experience
See what’s really going on, rather than just sitting there and thinking
Ways of Knowing- Intuition
Something that happens repeatedly, observe a pattern based. More likely to believe that it’s going to happen again. Experience that over and over, more likely to develop this intuition.
Ways of Knowing- Thinking
Probably seeing people getting spanked and they’re okay (based on intuitition). Just bc it has always been this way, doesn’t necessarily mean its telling the truth, its intuition.
“If you suffered in life and you want other people to suffer as you did because “you turned out fine,” you did not in fact turn out fine”
Which Ways of Knowing require observations/experience
Intuition and Thinking
Can I trust what I know?
Inaccurate observation
Selective observation → Don’t know the full story
Conflicting information→ Lot of misinformation
Illogical thinking
How to get at the truth?
Turn to the Scientific Method: Systematic, Objective, Observations
Make an observation
Ask a question
Make a Hypothesis ( “I Think”)
Conduct your experiments
Draw conclusions
Report your results
EX of Ways of Knowing: My textbook states that frustration causes aggression.
Authority → Experts share opinions, rather than facts.
Ex of Ways of Knowing: My dad always behaves aggressively when he gets frustrated. It seems to me that frustration causes aggression
Intuition → Something that happens repeatedly, observe a pattern based.
Ex of Ways of Knowing: If negative emotions cause aggression, and if frustration induces a negative emotion, then frustration must cause aggression.
Logic → A: Learning improves academic performance
B: Early childhood education benefits learning
C: Early childhood education improves academic performance
Is it logical? Based on the first 2 statements (A/B) → It is logical, but it is only correct if the first 2 statements are correct.
Non Empirical Methods vs. Empirical Methods
Non-empirical methods includes Authority and Logic → Don’t require experiences/observations
Empirical is Intuition and Science(Thinking) which requires observations/experiences.
Theory and Hypothesis
Theory: Must be falsifiable
Based on prior logic/information
Organizes knowledge
Guides hypothesis
Hypothesis: Testable/ falsifiable
Both need to be falsifiable, not trying to prove something right/wrong
Falsifiability
Can be demonstrated to be false by observation (to be proven wrong)
A: All swans are white → Falsifiable bc as long as we see a black swan than we can falsify this statement
B: There are aliens on the Earth → Can’t prove it right/wrong, doesn’t necessarily mean there are no aliens on earth though
Science is…
Empirical and Objective
Concerned with Theory
Based on prior logic/information
Organizes knowledge
And is supposed to guide hypothesis→ Theory is abstract, general, broad which covers multiple statements
Tentative & Self-correcting
Progressive
Parsimonious
Science is Probabilistic
Oftentimes we are talking about populations
There can be, and there always are, exceptions
Can only answer empirical questions
Questions (Empirical Q’s vs. Nonempirical Q’s)
Empirical Q’s: (Intuition/Science)
How does poverty affect children?
Are there age differences in happiness?
Non-empirical Q’s: (Authority/Logic)
Is abortion immoral?
Do animals have rights?
T/F: Empirical is based on observations/experiences
TRUE!!! Empirical is based on observations/experiences → Non-Empirical is not
Jenna enrolls in the Child Development class this quarter, and she is required to observe children in the lab school. Although she’s just been there for the first day, she notices a few particularly loud displays of aggression and that children involved are always boys.
This continues to be the case in the next few days.
She concludes that boys are more aggressive than girls.
Example of Intuition → Observations → Empirical → No standard procedure to test the hypothesis, conclusion is merely based on observations
Basic Elements of Hypothesis
Constructs
Operationalization
Variables
Constructs
A tool used to facilitate understanding of human behaviors → Describes the things we can’t observe/measure but they exist, probably abstract/general
Broad concepts or topics of study
Abstract
Not directly observable
May be complex
Constructs in Research Questions
Is memory associated with purpose in life?
Memory is pretty abstract, can’t really measure memory, different ideas regarding what memory is. Purpose in life is pretty abstract, not directly observable.
Are their age differences in personality? One construct → Personality… Age is not a construct. There are things that you can directly measure (Age, Height, Weight, Temperature), constructs are only about things you can’t observe/measure
Loneliness increases with age?
Loneliness is a construct, people define it differently it too.
Operationalize Constructs
Conceptual
Abstract or theoretical terms
Operational
Concrete and observable procedures
Intelligence- Conceptual
“The capacity for abstract thought, understanding, communication, reasoning, learning, planning and problem solving”
Using a lot of constructs to define a concept, but makes sense conceptually
Thus, to define a construct operationally, it is important to state the means of measuring this construct
Which one of the following terms best illustrates an operational definition?
a. punishment -- harsh or injurious treatment for an offense
b. learning -- acquiring knowledge or skill
c. thirst -- 18 hours without access to water
d. anxiety -- state of being uneasy, apprehensive or, worried
c. thirst -- 18 hours without access to water
“To define a construct operationally, it is important to state the means of measuring this construct”
Variables
Operationalize a construct → A variable
“Any characteristic that varies”
A variable must have at least two values
ALWAYS HAS TO HAVE AT LEAST TWO VALUES OTHERWISE HOW CAN IT VARY. If it changes, it should have at least two levels, if not its a constant
Variables Example: Professor Jones studied the effect of two types of instructions on learning either nonsense words or real words by college sophomores. Which of the following is NOT a variable?
a. Instructions
b. Type of words
c. Year in school
d. They are all variables
Year in school is NOT a variable → College sophomores, doesn’t vary, every participant is a 2nd year.
Instructions → Two types (Either nonsense word or real word)
Type of words → (Nonsense or real word)
The other thing that doesn’t vary is that there is only 1 investigator (Professor Jones)
Types of variables
Categorical: Varies in kind
Quantitative: Varies in amount
Continuous: An “infinite” number of values
Measured (1.5, 1.55, 1.558)
Discrete: Separate bins with no intermediate values possible
Counted (Number of people in class is 120, not 120.5) → ( 120,121,122 )
Which one of the following variables represents a quantitative variable?
a. College major
b. Political party affiliation
c. Salary in dollars
d. Type of life insurance owned
Salary in dollars
Experiments
Independent variable (IV)
“Cause” , Manipulated, Values → Levels, Each level → Condition
Dependent variable (DV)
“Outcome”
“Effect of IV variable on the DV variable”
Professor Smith studied the effect of giving either two, four, or eight pellets of reward to rats that ran a maze. He measured how fast they ran, and how many wrong turns they made.
• DV? IV?
• How many levels of the independent variable did he have?
• How many dependent variables was he interested in?
IV: 2, 4, or 8 pellets of reward
3 levels of the IV.
DV: Rats that ran a maze
Interested in how fast they ran and how many wrong turns they made
Quantitative variables
Fast = Timer, Continuous (Measured)
Wrong turns = Counting, Discrete (Counting)
“Effect of IV variable on the DV variable”
Variables in Correlational Studies
DO NOT manipulate variables, rather, we observe them and identify associations
Predictor & Outcome
***Correlation doesn’t imply causality.
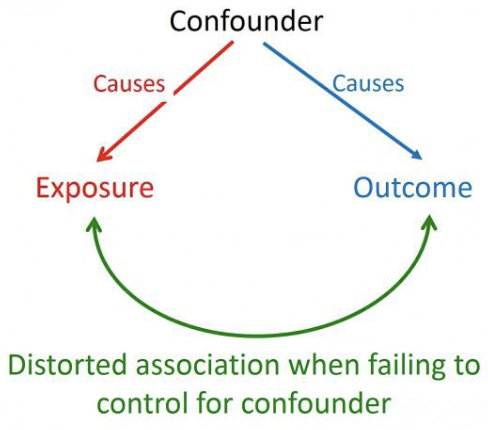
Confounders
Influences both the DV and the IV, causing a spurious association
Distored association when failing to control for confounder
Confounder can either : Cause → Exposure or Cause → Outcome
Researchers are interested in examining the influence of cooperative learning (i.e., working in groups) on learning effectiveness. They randomly assign students to either work in groups or work alone to prepare for a test. They find that working in groups is associated with a 15% increase in test scores.
Identify the IV/ DV.
IV: Influence of cooperative learning (working in groups)
DV: Learning effectiveness
2 constructs , cooperative learning is pretty abstract → Assign students to either work in groups or work alone = 2 conditions (Work in groups/ work alone)
2 groups are actually representative of the 2 conditions assigning the participants to which are one IV
Measurement
Variables must be measured on scales→ Anything that varies, should have at least 2 levels
“Assignment of numbers/labels to events or objects according to a rule or system”
Measurement Scales
Categorical
Nominal
Ordinal
Quantitative
Interval
Ratio
Categorical- Nominal
Classifies objects or events into categories , No quantitative properties
Major’s: Different categories, they are just different (Econ vs. Comm. vs. Comp. Sci)
Hair color: (1- Brown, 2-Black, 3-Blonde, etc)
Categorical- Ordinal
Values represent categories & order of their magnitude, Intervals between values not known.
EX: NFL ranking, can have different #1, #2, #3. But the values don’t actually mean much, represent the different categories. Intervals bw values don’t have any meaning. The difference bw #1 and #2 is probably not the same from #4 and #5. ***Not Calculable
Quantitative- Interval
Difference bw values are meaningful. Intervals are equal in size. YET, NO meaningful zero point
100 degrees - 80 degrees= 40 degrees - 20 degrees.
Can’t do division, there is no zero point. 0 doesn’t necessarily mean the absence of thermal energy, doesn’t necessarily mean nothing. Doesn’t mean there is no temperature.
IQ Score: Getting a score of 0 on the IQ test doesn’t really mean anything, doesn’t necessarily mean they have no intelligence. IQ of 0 doesn’t mean the absence of intelligence, not an absolute zero.
Quantitative- Ratio
When there is a meaningful/absolute zero.
Reaction time: 0 in that case means that no time has passed, that is an absolute zero. Or if I want to weigh anything and I get 0 then it doesn’t weigh anything.
Hierarchy of Measurement Scales
Ratio (Absolute zero)
Interval (Distance is meaningful)
Ordinal (Attributes can be ordered)
Nominal (Attributes are only named) weakest
What Measurement Scales?
Hours watching TV, Marital status, Calendar year
Hours watching TV → Quantitative, Ratio = There is a meaningful/absolute zero. If you watch 0 hours of TV that means you didn’t watch TV
Marital Status → Nominal, categorical variable, they know nothing is better than the other; they’re just different categories
Calendar Year → Interval, NO meaningful zero point. Zero is not an absolute zero.
Different Scales Measuring the Same Variable
EX: How often do you smoke?
Never, Sometimes, Regularly, I’m a Chain Smoker
Ordinal scale, follow a certain order. There is a ranking
OR, How many cigarettes do you smoke per day
Ratio, there is a meaningful/absolute zero
Statistics
Descriptive
Presenting, organizing, and summarizing data
Inferential
Drawing conclusions about a population based on data observed in a sample
Distribution
Shows the possible values for a variable and how often they occur
Central Tendency
Mode: The value(s) that appears most often → Nominal
Median: The middle number → Ordinal
Mean: Total # of values → Interval & Ratio
Dispersion
Range
Interquartile Range
Variance
Standard Deviation
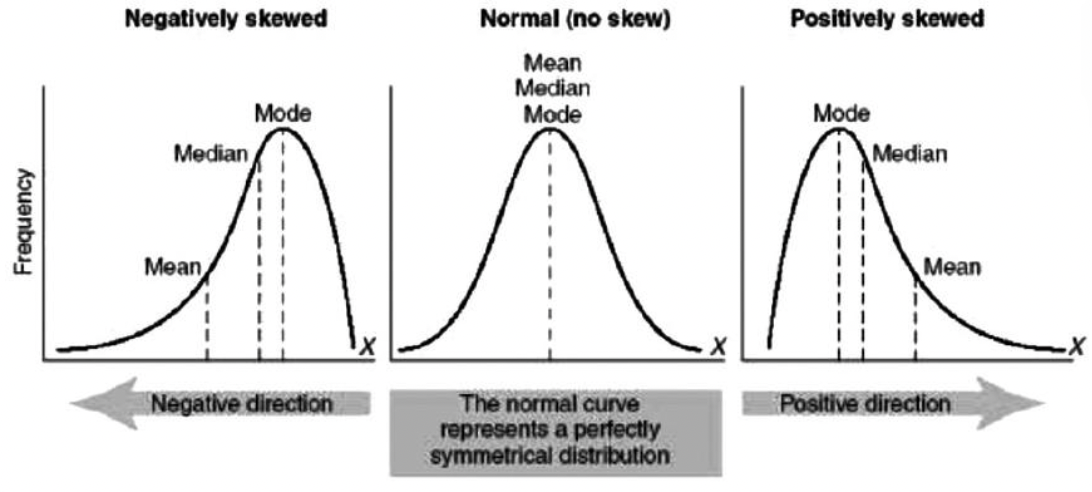
Skews on a Frequency Graph
Negatively Skewed = Tail to the left , towards the negative direction
Normal (No skew) = Normal curve represents a perfectly symmetrical distribution
Positively Skewed= Tail to the right, towards the positive direction.
In a certain box-and-whisker plot, the left hand (or lower) whisker is longer than the right hand (or upper) whisker. The distribution is probably:
a. Normal
b. Positively skewed
c. Negatively skewed
Negatively skewed
If tail , left hand(or lower), is longer then that means it’s negatively skewed.
Bar Graph vs. Histogram
Histogram describes quantitative data ( NO Gaps)
Bar graph describes categorical data (Gaps)
Reliability
Consistency of a measure across occasions.
Observed Score = True Score + Measurement Error (Random Error/Systematic Error)
Minimize the measurement error as much as possible
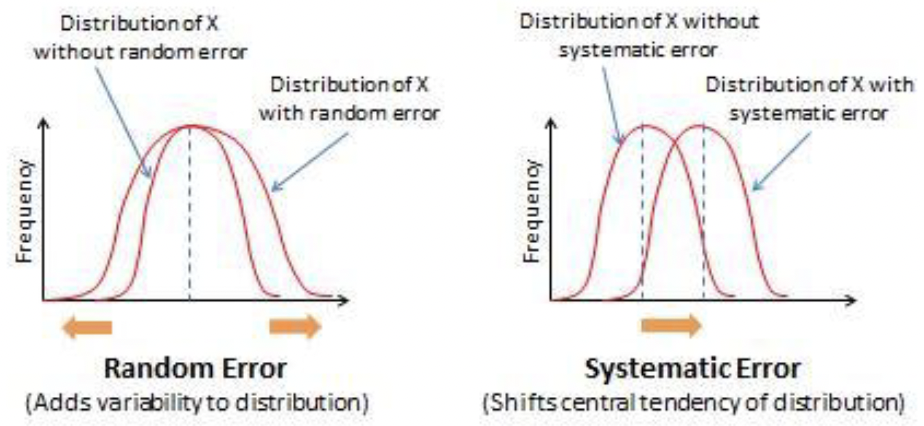
Measurement Error
Random error & Systematic error
Random Error: Scores shouldn’t be drafted towards any certain directions. Shouldn’t change your true score
Systematic Error: Underestimating the true scores, consistently get a score that’s lower than the true score (Shifts central tendency of distribution)
Small in reliable measures
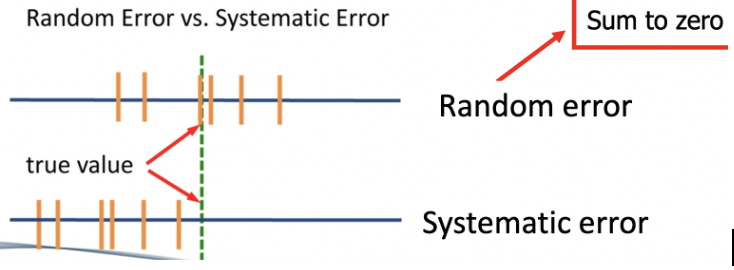
Random Error v. Systematic Error Distribution
Random Error
Adds variability to distribution
Systematic Error
Shifts central tendency of distribution
Methods for Evaluating Reliability
Test-retest
Parallel forms
Split-half
Interrater
Test-Retest Reliability
Same measure, same person, different time points
Use when:
The property being measured is stable ( shouldn’t change, won’t get same results).
Small practice/ exercise effect
The only thing that differs should be time points, each participant should get two points.
Parallel Forms Reliability
One person completes multiple measures, one time point
You will need to come up with a parallel measure.
Questionnaires that are as similar/identical as possible so they complete 2 measures (Form A=Form B).
One data collection, one time point, but need to show two measures (2 questionnaires).
Still want to include 20 items, each participant should still have 2 scores, in total they should complete 40 questions, should have 2 scores.
Split-Half Reliability
One measure split into two, one time point, one person.
Use when there are multiple items in a scale.
Nothing new, work with what we already have. Divide a 20 item scale into 2, 10 items scales.
Divide items into 2 subscales, want to measure the original one to test its reliability. Including both items in both A/B, only reason to divide items is to have participants complete both of them and see whether scores are reliable or consistent.
Each participant gets 2 scores, only competing 20 items but bc of division you’ll get 2 scores, each score represents 10 items.
Inter-Rater Reliability
Commonly used in observational research. Multiple coders are on the same page, so that it can be reliable, something that you can trust.
EX: Parent-Child Interactions:
Observe parent-child interactions for 10 minutes and rate closeness on a scale from 1 to 10
Observe parent-child interactions for 10 minutes and count # of the following behaviors
Role play, Touch, Praise, Criticize
The more subjective a code book is, the better. Don’t leave it to their subjective interpretation.
A researcher constructs a 20-item questionnaire to measure test anxiety among college students. In order to test whether her questionnaire is reliable, she puts together another 20-item questionnaire and asks students to complete both.
a. Test-Retest
b. Parallel Forms
c. Split-Half
d. Inter-rater reliability
Parallel Forms → One time point, one person completes multiple measures. One data collection, one time point, but need to show two measures (2 questionnaires).
“Another 20-item questionnaire” is two measures. “Asks students to complete both” seems like the researcher is telling them to take them right then and there (one time point).
A researcher tests the hypothesis that women provide more emotional support than men. During an experimental session, women and men were respectively paired with a crying confederate for 15 minutes. Three raters made judgments concerning the occurrence of emotional support for each participant.
“Three raters” is sufficient to know it’s Inter-rater reliability → Multiple coders are on the same page
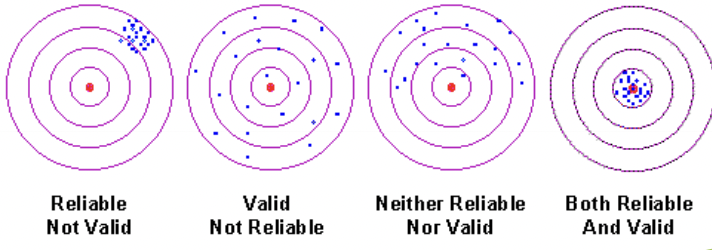
Reliability vs. Validity
Reliability: Yield consistent results
Extent to which the outcomes are consistent when the experiment is repeated more than once
Validity: Measures what you want it to measure
Extent to which the instruments that are used in the experiment measure exactly what you want them to measure
Validity of Measurements
Construct Validity
Face Validity
Content Validity
Criterion Validity
Construct Validity - Face Validity
Appears to measure what it is intended to measure
EX 1: How often do you drink coffee?
EX 2: Do you always feel tired?
Both of these are trying to measure fatigue, EX 2 has higher face validity. Whether you get a rough idea of what you’re trying to measure
Construct Validity- Content Validity
Sample the range of behavior represented by theoretical concept being tested
A valid depression measure should assess depressive symptoms
Items should capture depression rather than anxiety/loneliness.
Construct Validity - Criterion Validity
Correlates with other validated measures of relevant construct
Do individuals diagnoses with major depression score higher on the depressive sympotms scale than their non-depresses counterparts
Are these individuals more lonely?
Both are examples of Concurrent Validity (Same time)
Are these individuals more likely to report suicidal attemps in 2 years.
Example of Predictive Validity ( In the Future)
Criterion Validity - Concurrent Validity vs. Predictive Validity
Concurrent Validity: The criterion is measured at the same time (“Concurrent=Present”)
Predictive Validity: The criterion is measured in the future (“Predict future”)
If a test of leadership ability actually measures behaviors linked to high extraversion, then the test is low in ________?
a. Content validity
b. Test-retest reliability
c. Predictive validity
d. Parallel forms reliability
Content Validity → Low in it since it’s assessing something different rather than the theoretical concept being tested.
Graph of Reliability v. Validity
Reliability
Consistency of a measure across occasions. Observed Score = True score + Measurement Error . Yield consistent results
Test-retest, Parallel forms, Split-half, Interrater
Validity
Measures what you want it to measure
Construct Validity → Face Validity, Content Validity, Criterion Validity
Internal Validity
Degree to which a study provides evidence of a casual relationship. How can you be sure there’s no alternative explanations? How sure are you?
Something that happens within the study. Whether research was done right?
Depends largely on:
A: The procedures of a study
B: How rigorously it is performed
Threats to Internal Validity
Historical Events
Maturation
Testing
Attrition
Regression
Bias
Historical Events- Threats to Internal Validity
May influence the outcome of studies that occur over the same period of time.
EX: Does marriage influence depression in a study conducted 2019-2020?
COVID Pandemic is the Historical Event that co-occured with the study, basically a confounding variable. Can’t be sure that getting married is increasing depressive symptoms, it’s affecting the study
Maturation- Threats to Internal Validity
Impact of time, Naturally changed
Ex: Do after school programs influence social skills?
Children and their skills naturally improve over time, social skills would probably increase as they mature anyway over time.
Testing- Threats to Internal Validity
Practice effect, participants learn the test while completing it multiple times
Ex: Participants complete a test several times, they start to learn the test. Make sure the last time they take a test is in a while (6 months), otherwise they learn and it’s no longer reliable.
Attrition: Threats to Internal Validity
Certain subgroups of participants are more likely to drop out or leave study. The sample can be biased.
Longitudinal studies are prone to having participants leave.
Attrition rate= How many participants did you lose?
EX: Baseline ( Time 1 ) , n=100 → Time 2, n=60.
Attrition rate= 40%, always a percentage.
Regression Towards Mean: Threats to Internal Validity
Participants w/ extreme scores at T1 tend to score closer to the mean at T2.
EX: If I happen to find you at a peak point, starting with an extreme score, the second point would make it seem like you are less happy.
Ceiling vs. Floor Effects
Extreme values, Reaching the limit of a scale/measure
Ceiling: Too high → Can’t really differentiate, no variability. EX: Everyone getting an “A” on exam
Floor: Too low → Everyone getting low scores on exam
Experimenter Bias (Confirmation Bias) → Threats to Internal Validity
“The Clever Hans”— a horse that can do math: Trainer was giving non-verbal cues to the horse, couldn’t control his behaviors to achieve certain results.
Participants can have bias too!
A (conscious or unconscious) tendency to act in a way they think the experimenter wants them to act.
Threats Ex: A clinical psychologist wanted to know whether pets could help reduce depression. She selected 40 patients with the most severe depressive symptoms to participate in a study. These individuals did not own pets at the beginning of the study, and were notified of the aim of this study. After 3 months living with their adopted pets, 20 participants showed up for a post test. The psychologist found that they had lower levels of depression than before.
Attrition → 40 patients were selected, after 3 months only 20 participants showed up for a post test.
Historical → After 3 months, can’t control what occurs during that time.
Bias → Notified of the aim of this study.
Regression → Found people at most severe depressive symptoms. Participants at T2 will score closer to the mean since they already experiences an extreme score.
Practice Threat: You are interested in the effects of success and failure on feelings of depression. All participants experience the failure condition on a rainy Monday and the success condition on a sunny Wednesday.
Historical Event → Weather condition co-occurs w/ experimental conditions. All very tired on mondays as well, probably feel more depressed but can’t determine if it’s the weather or the day of the week, affects examination of the association.
What can we do to Improve Internal Validity?
Random Selection ( Participant recruitment/enrollment)
Randomization (assigning to conditions)
Blinding (Double-blind)
Rigorous protocol
External Validity
About the research being finished, don’t have to worry about the components.
Now that we have these findings, will we see the same things if we were able to reciprocate this study?
How well does the findings generalize to other situations/populations?
Is the sample representative of the population?
Would the same study conducted at another time reveal the same findings?
External Validity EX: Want to study how often college students exercise: If we only sample students who enter the ARC a random friday night, what’s the problems?
The sample isn’t representative of the population interested in (college students in general) → Only measuring students who exercise at ARC on a friday morning.
Hiro is doing a study on happiness. He explained that "happy" would be identified based on whether an individual smiled with their teeth showing. During the peer review process, another researcher notices that the majority of the observations from Hiro's study came from a small town. This most likely could reflect a problem with:
External Validity → Regional limitation, sample is not representative/generalizable