STATS 7 - Quiz 2 (LO3, LO4, LO5, LO6)
1/41
There's no tags or description
Looks like no tags are added yet.
Name | Mastery | Learn | Test | Matching | Spaced | Call with Kai |
|---|
No analytics yet
Send a link to your students to track their progress
42 Terms
Categorical variable
The value of the variable consists of groups and categories that don’t have any logical ordering.
Quantitative variable
The raw data consists of numerical measurements on each individual/units or they consist of counts
Easiest way to identify categorical or quantitative variable?
Categorical variables are statements and quantitative variables are numbers
Bar graphs
Each characteristic, or level, is represented by a bar. The height of a bar represents either the count of individuals with that characteristic, the frequency, or the percent of individuals with that characteristic, the relative frequency.
Pie charts
A pie chart can only represent how one categorical variable breaks down into its components. Each characteristic is represented by a slice, and the size of a slice represents what percent of the whole is made up by that characteristic.
Histograms
A summary graph for a single quantitative variable. Useful to understand the pattern of variability in the data, especially for large data sets
Line graphs (time series plot)
Use them when there is a meaningful sequence, like time. The line connecting the points helps emphasize any change over time
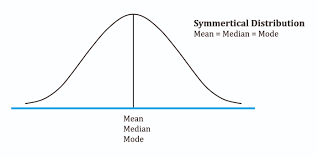
Symmetric distribution
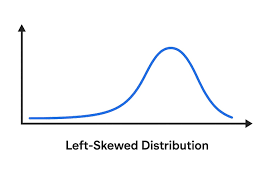
Left skew
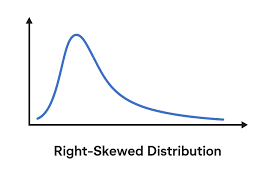
Right skew
Outliers
An important kind of deviation in the distribution of the data is an outlier. Outliers are observations that lie outside the overall pattern of a distribution. Always look for outliers and try to explain them.
Graphing time series
Data collected over time are displayed in a time plot, with time on the horizontal axis and the variable of interest on the vertical axis
We look for a possible trend and possible cyclical variations
Long-term trend
Variables change steadily over time
Seasonal components
Trend to be high in certain months or seasons and low in other years
Irregular Cycles and Random Fluctuations
Irregular cycles may be explained by social, environmental, political, or other factors
Unexplainable random fluctuations are part of the natural variabiltiy present in all measurements
Mean (or average)
Add all values and then divide by the number of values
Median
The middle value after the numbers have been put in order
Mode
Most common value in a dataset
Comparing median and mean
The median is a measure of center that is resistant to skew and outliers. The mean is not.
Variability
Describes how spread out or close together the data values are.
Minimum
The smallest value in the data set
Maximum
The largest value in the data set
Range
The difference between the maximum and minimum
First Quartile (Q1)
The median of the values below the median in the sorted data set
Third Quartile (Q3)
The median of the values above the mean in the sorted set
Five number summary
Minimum, Q1, Median, Q3, Maximum
Boxplots
Visual representation of five number summary
IQR
Q3 - Q1
Lower Bound
Q1 - (1.5 * IQR)
Upper Bound
Q3 + 1.5 * IQR
Standard Deviation
A useful measure of how spread out the numbers in a data set are
How to find standard deviation
Find mean, find deviation of each value to mean (value - mean), square the deviations, divide sum by number of values - 1 to find variance, square root the variance to find standard deviation
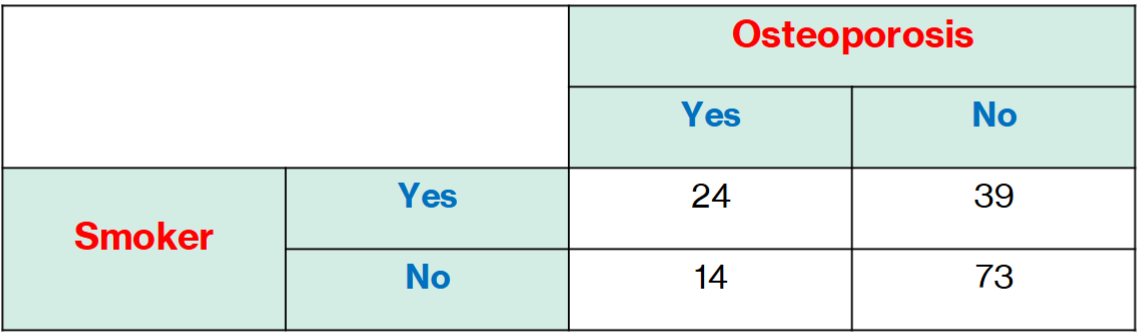
Contingency Table
Represent the counts and values of one variable in the rows and represent the counts and values of another variable in the columns
Relative risk or relative odds
Involves comparing one category to another category
percentage with the trait
(number with trait / total) x 100%
Proportion with the trait
number with trait / total
Odds of having that trait
number with trait / number without trait to 1
Relative risk
Relative risk of an outcome for two categories of an explanatory variable is the ratio of the risks of the risks of each category. (So the risk of getting allergy from owning a pet vs risk of getting allergy from not owning a pet - double calculation)
Baseline risk
Risk without the treatment or behavior. Difficult to read
Increased risk
Comparing relative risk vs baseline risk to see if your chance of gaining something has changed or not
Odds ratio
Ratio of the odds, like the relative risk of odds
Simpson’s paradox
Third variable is missing due to combining of data leading to false conclusions