MBS 325T Unit 2
1/45
There's no tags or description
Looks like no tags are added yet.
Name | Mastery | Learn | Test | Matching | Spaced | Call with Kai |
|---|
No analytics yet
Send a link to your students to track their progress
46 Terms
Although only briefly mentioned in class, one of the transcriptional targets of Hedgehog signaling is GLI1, a GLI protein that is activated by Hedgehog signaling. Unlike other GLI proteins mentioned in class, GLI1 exists only as a full-length activator. It is not processed into a repressor in the absence of Hedgehog and it is also not transcribed or present in the absence of Hedgehog activation. Is this an example of a positive or negative feedback loop? Justify your answer.
This is an example of a positive feedback loop. Since GLI1 is only an activator – and also only transcribed after administration of Hedgehog signaling, it acts to boost the levels of target gene response. This contrasts with negative signaling loops (Ptch1 and Hhip) discussed in class.
Activation of the Hedgehog pathway results in Ptch transcription. This is considered a negative feedback loop Why?
PTCH receptor (protein) inhibits the activation of the Hedgehog pathway unless it is bound by Hedgehog ligand. The binding of the ligand prevents PTCH from inhibiting SMOOTHENED, thereby activating the pathway. The activation of the pathway then results in the transcription of many target genes, including Ptch. Ptch mRNA is translated into protein that then results in a large amplification of PTCH protein in the cell membrane. Unless this new PTCH is also bound by Hedgehog ligands, it will have an inhibitory effect on the pathway. Since Hedgehog is activating something that will later inhibit it, this is referred do as a negative feedback loop.
Describe the differences in cellular localization of Ptch and Smo in the presence of Hedgehog signaling. Also describe them in the absence of Hedgehog signaling.
In the presence of HH signaling, Ptch is found outside the cilia (around the base though we did not discuss this). Smo is found in the cilia.
In the absence of HH, Ptch is present within the cilia while Smo is not present in the cilia.
You decide to examine craniofacial tissue from wild-type tissue and also from tissue from a ciliopathy mutation for Gli2. You find that there is increased full length GLI2 and decreased GLI repression. Predict the effect of this mutation on downstream target genes.
There will be a loss of repression on some target genes that results in increases tp their expression. Note: from this data alone, it isn’t possible to tell if the increased full length GLI2 has been processed into GLI-activator. Or, if it is unprocessed GLI2 that has accumulated since the cilia helps process GLI FL into GLI activator. Either way (either because of the loss of the repressor or the loss of repressor and concurrent gain of activator), there is increased expression of target gene.
You isolate mRNA from cells treated with and without Sonic Hedgehog protein, use reverse transcriptase to generate cDNA from the mRNA. You then perform quantitative real time PCR using primers that detect Ptch and Smo. Will there be a difference? If so, what? If not, why?
Yes. Ptch is a transcriptional target of the pathway while Smo is not. There will be an upregulation of Ptch mRNA in SHH-treated cells compared to untreated cells. There will be no change in Smo mRNA between the two cell types.
You have just identified a new protein that is mutated in several different patients that present with a novel ciliopathy phenotype. The mutations are all point mutations that change a single amino acid. Describe how you could determine if this protein was normally present in cilia, and if its localization is altered in patients.
You could isolate cells from these patients and from control patients. Then you could use an antibody against this protein and use immunofluorescence to determine if it is located in the cilia. Importantly, you would also need to use a control antibody that is present in the cilia (for example Arl13b or acetylated Tubulin). Then, using two different secondaries with different fluorescent conjugates, you could determine if your protein co-localizes with your marker.
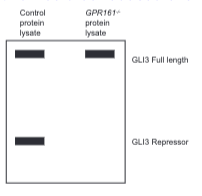
Using a cartoon of a western blot, diagram the predicted effect of a GPR161 mutation on GLI3 full-length and repressor protein levels in a Hedgehog-responsive tissue compared to controls with normal amounts of GPR161. Justify your prediction.
You would see little to no GLI repression because GPR161 promotes the cleavage of full length GLI into repressor form (by stimulating PKA activity. This cartoon shows similar amounts of GLI3 FL but the actual levels of this would be reduced even though they would still be present).
You are concerned that the differences in bands you see in the mutant tissue in #7 might not actually be biological differences but instead would be caused by different amounts of protein present in the cell lysates of the samples. What type of control do you need to run to show this is the case? Give an example.
You need to run a loading control for some protein that should be expressed at the same levels in both samples. This will then tell you if the two wells have similar overall protein levels. One example we’ve used in class is an antibody against Tubulin.
You are given a set of cells and need to determine if they are multiciliated (something we only briefly touched upon in class) or, like most cells, contain only a single cilium Describe an experiment that will allow you to do this – be as specific was possible with reagents. Note that these cells do not have any Hedgehog signaling – so you can’t use HH signaling as part of your strategy.
You could use a basal body marker, an axoneme marker or, ideally, both. If only a single cilium, there will be only one per cell. If multiciliated, there will be multiple basal bodies (and axonemes) per cell.
You want to determine if a specific ciliary mutation results in shortened cilia. You have an antibody to the basal body marker gamma tubulin in your laboratory. Will this allow you to answer your question? If so, why? If not, why not?
No, gamma tubulin mark the basal bodies of cilia. It does not mark the axoneme, which is the region that would be shortened.
What are the differences between anterograde and retrograde transport within the primary cilia?
Anterograde transport moves material from the base to the tip of the cilia using ‘plus-end’ directed kinesin motors. Retrograde transport moves material from the tip to the base using ‘minus end’ directed dyneins.
You have a protein that is typically trafficked to the ciliary tip. Predict the cellular localization of this protein in an anterograde mutant and retrograde mutant.
Anterograde mutants would never be transported to the tip. Thus the protein would be mislocalized elsewhere. In a retrograde mutant, the protein could accumulate in the tip but not be removed. This would result in higher accumulations at the tip that might ultimately overflow into the entire cilia.
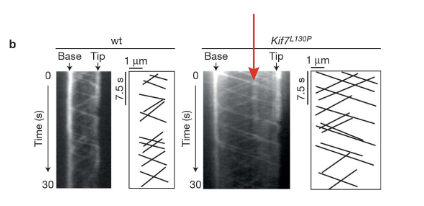
You are imaging IFT ciliary movement on a kymograph and you see a specific structure (indicated by the red arrow) that is only present in the mutant. What do you think this vertical line signifies? Based on your answer, indicate what this might mean or a subset of IFT particles in mutant cilia?
The vertical line indicates a spot on a cilium that isn’t moving over time. Since this is imaging IFT, it indicates that an IFT particle is stuck in one place on the cilia. Note that other spots are moving in anterograde and retrograde patterns on the same cilium (as on the in-class exercise).
You treat a Hedgehog-responsive cell line with forskolin, a drug that results in very high levels of protein kinase A activity. Predict its effect on the Hedgehog signaling pathway and explain why. Then explain whether this will be similar to or different than the effect from GPR161 loss-of-function mutations.
Protein Kinase A (PKA) promotes the formation of GLI repressor. If I treat with forskolin, increased PKA activity will result in the formation of increased GLI-repressor, inhibiting the HH pathway.
Like PKA, GPR161 is required to generate GLI repressor. In GPR161 loss-of-function mutations, there will be an absence of GLI-repressor, leading to pathway activation (the opposite effect).
You see a patient with a dominant disorder that has a sporadic, de novo point mutation in a gene. Using SNP sequence analysis on her DNA alone, you identify all known SNPs (you don’t sequence her genome). Is this likely to identify her mutation? Why or why not?
No, this will only identify known SNPs, alleles present at a detectable frequency in human populations. SNPs are generally not appropriate for identifying unknown mutations since these disease-causing alleles typically are rare. It will certainly not identify a de novo point mutation since this is a completely new mutation.
Now you decide to identify parents, grandparents and siblings of the patient and identify all their SNPs. Will this data be helpful for performing linkage analysis given what you know of this mutation in #1? Why or why not?
No, since this is a sporadic mutation, it won’t be present in these family members.
You decide against performing linkage analysis (in #2) but using all the SNP data, you are still hopeful that you might be able to identify the allele variant by subtracting out all common SNPs. Will this work?
No, the SNPs are generally markers of regions but not the mutation itself.
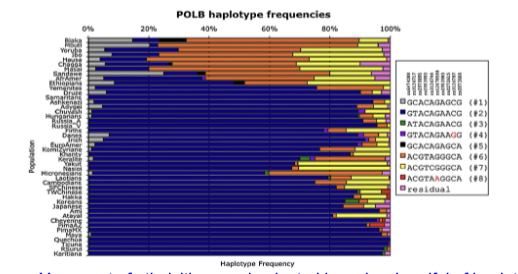
A study found multiple SNPs within and around the human POLB locus and used this to generate haplotypes and compared their population frequencies across multiple human populations. (Yamtich et al, 2009 DNA Repair 8: 579–584). The below chart shows the haplotype frequency in different populations (y-axis). Does the data indicate that they are finding any regions that are in linkage disequilibrium? If so, explain why. If not, why?
Yes, most of ethnicities are dominated by only a handful of haplotypes that would not occur at random. Thus, these are in linkage disequilibrium.
Consider the below image from class. A 50Kb core haplotype (depicted in black) is enriched in patients with severe forms of COVID-19 but there is also a larger region encompassing ~300Kb that is variably enriched to a lesser degree than the core region. The y-axis indicates a measurement of linkage disequilibrium for each of the datapoints (the X-axis indicates genomic coordinates on part of chromosome 3. Provide an explanation for why the 300Kb region is still present in many patients.
This is most likely because there are either no recombination hot-spots within the 300Kb region – or if there is one, it is very infrequently used. Thus, it is only whittled down by recombination very slowly.
A haplotype is defined as ‘…a collection of linked, variable alleles at nearby loci.’ These alleles are in linkage disequilibrium. What does linkage disequilibrium mean in this context?
It means that the alleles within this haplotype are more frequently associated with each other than would be predicted by random recombination.
A haplotype is defined as ‘…a collection of linked, variable alleles at nearby loci.’ These alleles are in linkage disequilibrium.
Since there are multiple alleles within this haplotype, do you think that all of these alleles are likely to contribute to the phenotype? Explain why?
No, it is possible that none of the alleles directly correlate with this phenotype; if one of the alleles does contribute to the phenotype, it is likely to be the only allele within the haplotype that does so. The other alleles segregate with this allele because they are within a region within meiotic recombination. These other alleles are, so to speak, along for the ride
Using copy number variant (CNV) probes on a SNP-chip, how could you determine if a person had a gain of copy number versus loss of copy number at a particular locus and how would this data compare to the rest of the genome where there were normal copy number variants?
At most of the genome, you would see a specific signal level for most CNV probes because they will show two copies of most regions of the genomes (CNV probes aren’t looking for variable SNP variants – they are probes looking for regions that are invariant). You would see reduction (by half) compared to baseline levels if there is a loss of CNV variant (so only 1 remaining copy) across the entire CNV while a gain-of-copy would have in increase in signal compared to baseline levels across the entire CNV.
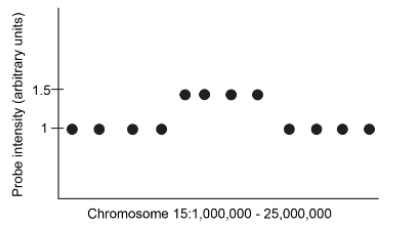
Please examine the schematic on the right showing SNP genomic data from an individual. Each dot corresponds to the intensity of hybridization at a SNP probe present at the corresponding interval shown on the X axis (the numbers on the X-axis refer to chromosomal coordinates). Being as specific as possible, indicate what type of genomic variation reflects. Then explain why.
This reflects a CNV variation, specifically a gain in copy number. You know this is a CNV because it is a large region (several megabases) and that it is a gain rather than a loss of copy number variation because there is a 1.5x increase in signal in a region .
In an attempt to identify the mutated gene underlying a rare genetic retinal disease, you sequence an individual and identify 15,000 variants in their coding region. Without knowing anything about their family history, list two specific steps you could you narrow these variants down to a smaller list of candidates? Assume this is caused by mutation(s) in a single gene.
1. Remove silent mutations
2. Remove common SNP variants (since this is a rare disease)
Correct answer (that we will cover in the upcoming week) Identify those mutations likely to have a deleterious function on protein activity or describe how you would make this prediction by identifying mutations in critical domains / mutations predicted to have substantial changes in protein structure)
Tay Sachs is a neurodegenerative disease resulting from mutations in the HEXA gene that is common in Ashkenazi Jews (AJ). A particular haplotype associated with this disease in AJ contains the following alleles in no particular order (allele 175, allele 240, allele 284, allele 144,and allele 418 ). Allele 144 is associated with the disease-causing mutation in all instances of the disease while the other 4 alleles are associated with the mutation at progressively lower frequencies. First, explain what a haplotype means as applied to this question. Second, propose an explanation for why there are different frequencies of association with alleles within this haplotype.
This haplotype is a collection of variable alleles that are in linkage disequilibrium. This haplotype is also associated with people who have Tay Sachs. Allele #144 might be the closest allele to the mutation and thus the least likely to be disrupted by recombination while the alleles that are associated at progressively lower frequencies may be progressively farther away from the mutation and therefore more likely to be disrupted by recombination

The map on the right heat map showing the rates of linkage disequilibrium at 24 SNPs in a 500Kb region of chromosome 9p21 that is associated with coronary artery disease. Each of the numbers within the square represents the degree of linkage disequilibrium between each of the 24 SNPs.
The top of the figure shows brackets denoting three labeled regions (blocks 1, 2 and 3). Explain what each of the labeled blocks represent and how the boundary at the end of each block was determined?
Each block represents a haplotype where the SNPs within the block have a high degree of linkage disequilibrium.
The boundary at each end was defined by SNPs that are in reduced/absent linkage disequilibrium compared to the SNPs within the block.
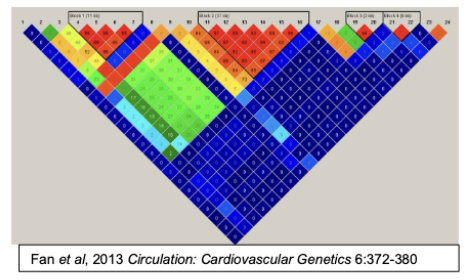
The map on the right heat map showing the rates of linkage disequilibrium at 24 SNPs in a 500Kb region of chromosome 9p21 that is associated with coronary artery disease. Each of the numbers within the square represents the degree of linkage disequilibrium between each of the 24 SNPs.
The region labeled block 2 is the exact region associated with coronary artery disease. Propose a plausible explanation for why different individuals might have only block 1 or only block 2 rather than always having both blocks?
It is because of the likely presence of recombination hotspots between these blocks. Regions of lower or absent LD suggest that these regions are prone to undergoing recombination.
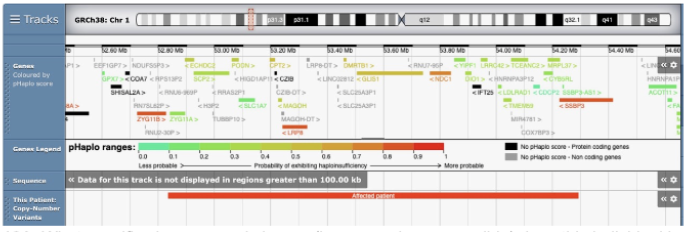
What specific chromosomal change (be as precise as possible) does this individual have – and how you know this
This is a loss of copy number variant (CNV). You know this because the CNV bar is red. Partial credit for recognizing it is a CNV but no indication of whether a gain or loss of copy number

Referring again to the diagram for question 4, genes are coded by color according to their pHaplo score (which is the same as the pLI score discussed in class). First, explain what a high pLI score means. Then, explain why the genes labeled in red (indicating a high pLI score) are most likely to contribute to this person’s phenotype?
1. A high pLI score means that the gene is likely to be Haploinsufficient.
2. haploinsufficient genes are likely to contribute to the phenotype because the deletion in this person means there is only one copy of each gene within the CNV

Can you say that individuals with significant SNPs in the CDKN2A locus are likely have the biggest effect on the particular trait being analyzed? Why or why not?
No, Manhattan plots show GWAS hits based on their statistical significance. (Note:You would need to determine the odds ratio to obtain this type of information).
What is linkage disequilibrium?
LD is when the expression of two or more alleles at different loci are associated with each other at a higher frequency that would be expected by chance.
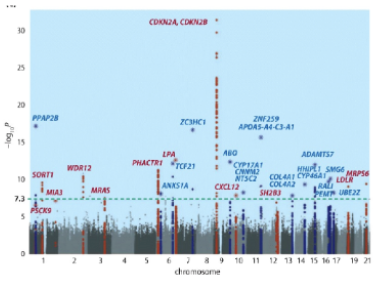
Referring again to the Manhattan plot, many of the peaks have multiple different SNPs (indicated by the dots on the same vertical line). Are these different SNPs likely to be in linkage disequilibrium? Why or why not?
Yes, the SNPs are in close proximity to each other (since they are on a vertical line) and are highly likely to map to the same locus. These different alleles are likely to be tightly linked to each other (since they are all linked to the trait allele). Thus, they are likely to be in linkage disequilibrium. Note that in denser Manhattan plots like the ones showing height, the X-axis is so compressed that different loci may appear to be on the same peak.
After performing a GWAS study on Schizophrenia patients and controls, you decide to manually determine whether a particular SNP is significantly enriched in all the patients. How would you determine this and what statistical test would you use?
You would determine how different the observed frequency of the allele in the patients is from the expected frequency of the allele in present in controls.
You would use a chi-square test to identify statistically significant changes.
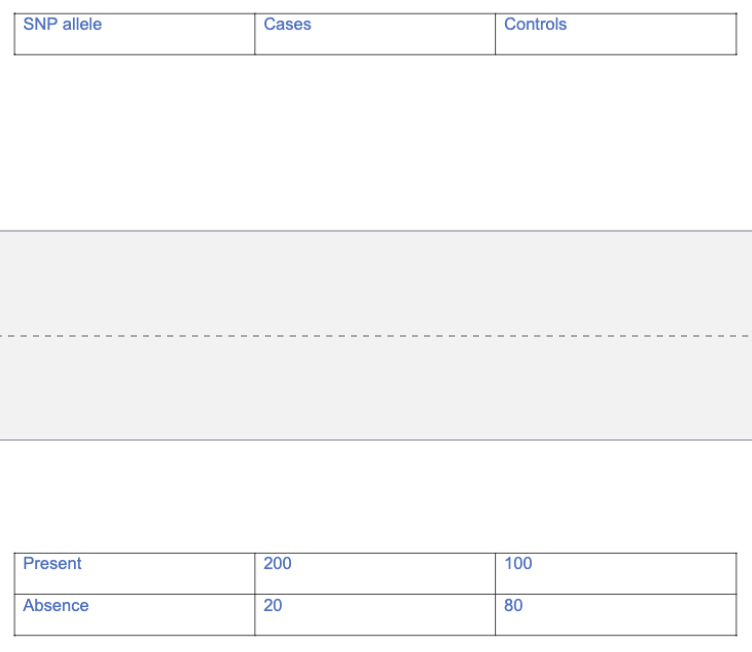
After performing a GWAS study, you find a particular SNP allele present in 200 people with a certain kidney disease and absent in 20 additional people with the disease. This allele is also present in 100 control people without the disease and absent in 80 control people without the disease. As discussed in class, please construct a table of cases and controls showing presence and absence of the allele. Then use this to determine the Odds Ratio
Odds Ratio = (200/20)/(100/80)=8
Somewhat different information has emerged in GWAS studies for size in dogs and height in humans. What is the major difference?
Only a few loci (~6) control at least half of variation in dogs. In contrast, hundreds of loci control less variation in humans (maxing out around 30% of variation).
Mutations in one copy of the transcription factor Sox9 cause campomelic dysplasia, a disorder affecting cartilage and bone morphology. Since one copy of Sox9 is normal while the other is mutated, you wonder if this might indicate that Sox9 is haploinsufficient. However one of your classmates points out that the mutation might instead be a dominant mutation in Sox9.
What do you think is the difference between dominance and haploinsufficiency?
Haploinsufficiency refers to a phenotype if there is only 1 copy of a gene while a dominant mutation has a phenotype in when one copy of the gene is mutated in a way where there is still some gene function (even if it is aberrant).
Mutations in one copy of the transcription factor Sox9 cause campomelic dysplasia, a disorder affecting cartilage and bone morphology. Since one copy of Sox9 is normal while the other is mutated, you wonder if this might indicate that Sox9 is haploinsufficient. However one of your classmates points out that the mutation might instead be a dominant mutation in Sox9.
Would nonsense mutations or missense mutations be a more definitive indication of haploinsufficency?
If the mutations lead to premature stop codons (caused by either nonsense or frameshift mutations), they are likely to be loss-of-function variants. This is seen in campomelic dysplasia. It is harder to determine if mis-sense mutations are dominant or recessive without knowing additional information (mode of transmission and effect of the particular mutation on the protein). They could be either but a nonsense mutation would be more definitive.

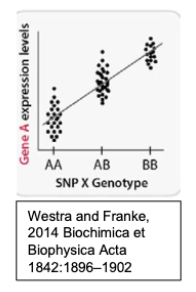
Consider the below schematic showing eQTL data individuals with the following genotypes of a single interesting SNP, SNP X, identified from a GWAS study.
Which allele of SNP X is associated with higher expression levels?
The B allele is associated with higher expression levels.
Consider the below schematic showing eQTL data individuals with the following genotypes of a single interesting SNP, SNP X, identified from a GWAS study.
Assuming that SNPX is not directly within Gene A, provide an explanation for how it could be regulating it’s expression.
Since eQTLs mediate gene expression, it might be acting as an enhancer that activates Gene A (like the SNP within CELSR regulating SORT1 we discussed in class).

Consider the below schematic showing eQTL data individuals with the following genotypes of a single interesting SNP, SNP X, identified from a GWAS study.
If you looked on the genome where would you expect Gene A to be located relative to SNPX to be consistent with your hypothesis
We learned in the first part of the class that enhancers regulate genes over long distances but typically this occurs within the same TAD (vary in size but typically within 1 Megabase) – and definitely on the same chromosome. The first step would be to determine if SNP X is located near Gene A (within 1 Megabase or the same TAD). If SNP X is not near Gene A, then it is probably not working as an enhancer (perhaps some other, more complicated form of regulation (perhaps SNPX activates a transcription factor nearby that then regulates the expression of several genes, including Gene A.
You are studying a very rare genetic disease and identify a patient with a mutation in an uncharacterized protein that results in an amino acid substitution. First, define this type of mutation. Then describe two steps you can take to determine if this mutation is likely to be a benign or pathogenic variant.
This is a missense mutation.
Step 1: is this gene variant common in individuals within the population (ok to instead state the name of the database like gnomAD)? If so, it is unlikely to be the cause of a rare disease. Note: SNPs are generally not appropriate for this type of answer because it is a very rare disease and SNPs are not likely to be as informative.
Step 2: Is this variant likely to result in a disruption of the protein structure.
3 Tools could be mentioned based on class (SIFT, Poly-Phen or Alpha Missense). Partial credit for mentioning only one of these tools without explaining how it worked (don’t need to mention the tools at all)
You treat a Hedgehog-responsive cell line with forskolin, a drug that results in very high levels of protein kinase A activity. Predict its effect on the Hedgehog signaling pathway and explain why. Then explain whether this will be similar to or different than the effect from GPR161 loss-of-function mutations.
Protein Kinase A (PKA) promotes the formation of GLI repressor. If I treat with forskolin, increased PKA activity will result in the formation of increased GLI-repressor, inhibiting the HH pathway.
Like PKA, GPR161 is required to generate GLI repressor. In GPR161 loss-of-function mutations, there will be an absence of GLI-repressor, leading to pathway activation (the opposite effect).
Shet and pLI scores are similar methods we discussed for predicting haploinsufficiency. What is haploinsufficiency? What type of mutation do Shet and pLI measure and what flags a gene as being possibly haploinsufficient?
Haploinsufficiency means that both gene copies are required for a normal phenotype. Shet and pLI measure the rate of mutations that cause premature stop codons (or state nonsense mutations) in specific genes within populations. Genes that have lower rates of premature stop codons than the background rate are possibly haploinsufficient.
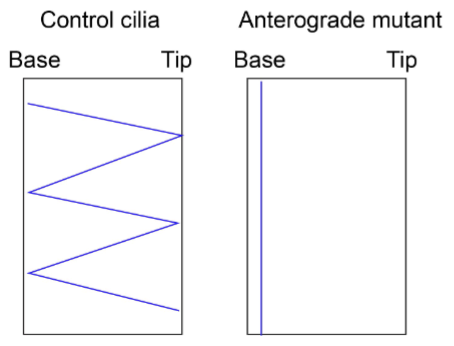
You want to monitor cells from a ciliopathy mutation for defects in anterograde trafficking using a kymograph. First explain what anterograde trafficking refers to. Then, propose an experimental setup that will allow you to do this with a kymograph. Sketch kymographs showing the predicted phenotype in the control as well as in the mutant (make sure you label the base and tip).
Anterograde trafficking refers to proteins moving from the base to the tip of the cilia.
To monitor defects in anterograde trafficking in the particular ciliopathy, I will measure the trafficking trajectory of a labelled protein (or fusion protein – can’t use an antibody for live imaging) that is known to be involved in anterograde trafficking using live imaging on a Kymograph comparing the movement on primary cilia in wildtype and mutants. Sketch could also just show retrograde movement (tip-base)
You identify two different individuals with homozygous mutations in a gene (gene X). One individual is homozygous for a missense mutation and the other has a nonsense mutation for the same gene. This gene is predicted to be expressed in the cilia and you generate stable lines of cells from samples provide by each individual (assume you have access to additional control cell lines).
Describe an experiment that will allow you to determine 1) if this protein is normally expressed in the cilia; and 2) if the mutant variants are also expressed in the cilia.
I will perform Immunofluorescence (IF) with two different antibodies. I will use an Arl13b antibody to identify cilia and an antibody for Protein X that is encoded by Gene X
You identify two different individuals with homozygous mutations in a gene (gene X). One individual is homozygous for a missense mutation and the other has a nonsense mutation for the same gene. This gene is predicted to be expressed in the cilia and you generate stable lines of cells from samples provide by each individual (assume you have access to additional control cell lines).
Then explain the different between a missense and nonsense mutation. Based on this difference, try to predict what expect to see in your experiment for each of the two individuals with mutations? Be specific and explain why you can or cannot make a prediction.
A nonsense mutation will lead to a premature stop codon and typically a loss of protein. This mutation is predicted to not be present in the cilia since the protein will be degraded.
A missense mutation leads to an amino acid substitution. This would be present in the cilia unless it is a pathogenic variant that affected protein stability/localization and without knowing this, it is hard to make a prediction.