3D GIS Lecture 3 (Geoproccesing Tools)
1/11
There's no tags or description
Looks like no tags are added yet.
Name | Mastery | Learn | Test | Matching | Spaced | Call with Kai |
|---|
No analytics yet
Send a link to your students to track their progress
12 Terms
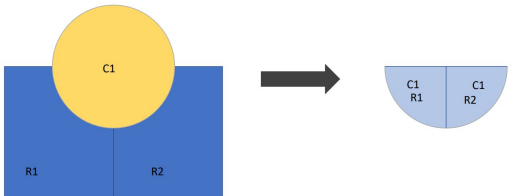
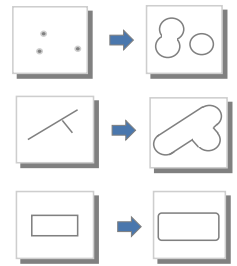
Clip
Output contains areas within both datasets, and only attributes from the clipped layer
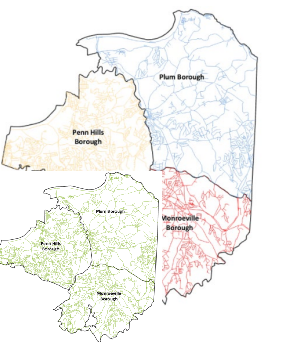
act like a cookie cutter - extract features from a larger dataset using a polygon boundary (ex: can trim contour lines for just one neighbourhood)
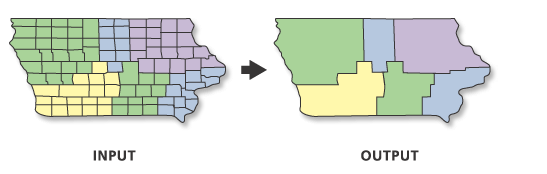
Dissolve
new boundaries and aggregated data’
ex: all US states then dissolved into regional areas (pacific, west south central etc..)
Append and Merge
new feature classes from separate feature classes of the same type
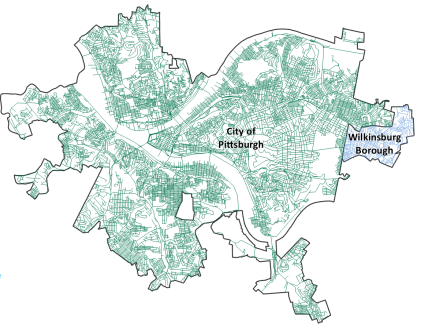
Append
adding features from multiple input data sets into one existing dataset
The input feature and the target feature must have a matching schema (be the same type - point, line, or polygon)
it modifies the target dataset directly, no new file is created
ex: append the wilkinsburg burrough to the city of pitsburgh streets
Merge
Takes two or more features of the same type (e.g., points, lines, or polygons) and combines them into a new feature class that combines the inputs.
Intersect and Union
new feature classes from separate feature classes of different types
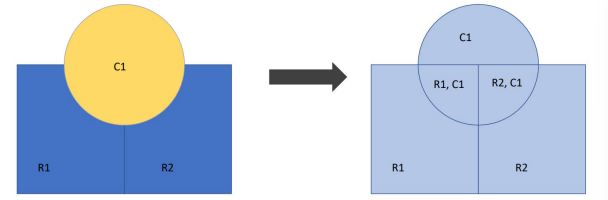
Intersect
outputs contains areas within both datasets, and all attributes
inputs can have different geometry types
Union
output contains all polygons from input datasets, and all attributes
contains all the polygons from the inputs, whether or not they overlap
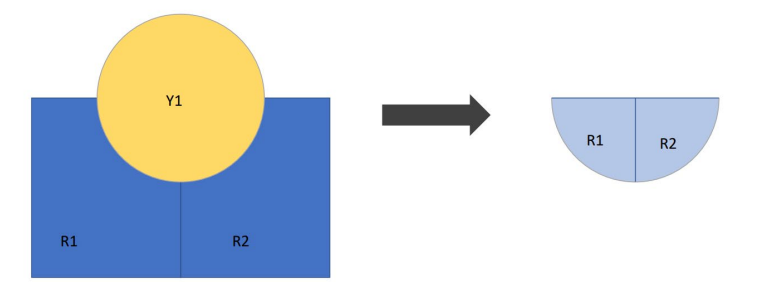
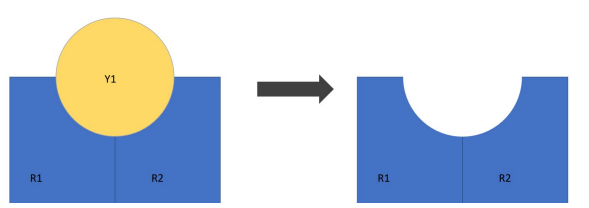
Erase
delete areas that correspond with another layer
Proximity Analysis
point, line, and polygon proximity buffers
often used to delineate zone around features or to show areas of influence
sometimes used to clip features
can be used to select features in another feature class
ex: buffer around lights for a campus safety study
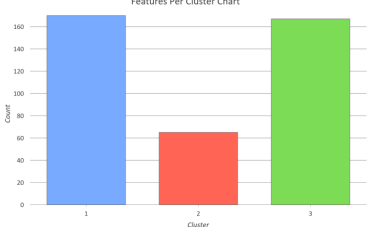
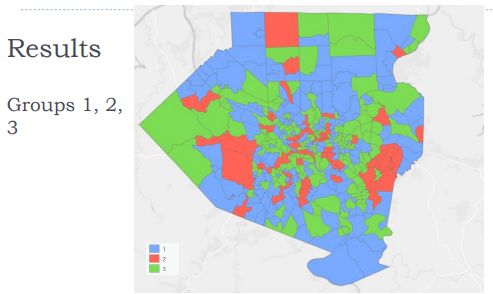
Multivariate cluster analysis
data clustering: finds clusters of data points that are close to each other but distant from points of other clusters.
Exploratory method, no right or wrong clusters
Ex) housing units and young renters '
partitions a dataset with n observations and p variables into K clusters
n = 402 number of observations (census tract polygons)
p = 3 variables for clustering (vacant housing units, renter occupied housing units, population ages 25-29)
k = 3 clusters
Zonal statistics and zonal histrogram
Zonal histogram tool calculates the frequency distribution of values within those zones
zonal statistics tool calculates summary statistics (like mean, median, max etc.) for the values within each zone