Ecology and Population Dynamics Lecture Series (31-33)
1/63
Earn XP
Description and Tags
This set of vocabulary flashcards covers the core concepts of Ecology, Population Ecology, Community Ecology, and Ecosystem Dynamics as presented in Lectures 32-35.
Name | Mastery | Learn | Test | Matching | Spaced | Call with Kai |
|---|
No analytics yet
Send a link to your students to track their progress
64 Terms
Ecology
It is the scientific study of interactions between organisms and their environment, encompassing both biotic (living) and abiotic (nonliving) components.
Key Terms: Population, Community, Ecosystem, landscape, and biosphere
Population - group of individuals of the same species living in an area with the potential to interbreed and interact with one another
Community - group of populations of different species living in an area with the potential to interact with one another
Ecosystem - community of organisms in an area and the physical and chemical environmental factors they have the potential to interact with
Landscape (or Seascape or Meta-ecosystems) - a mosaic of connected ecosystems and their potential to interact (i.e., multiple ecosystems)
Biosphere - the global ecosystem, the sum of all the planet’s ecosystems and landscapes
List the six levels of the Scope of Ecological Research from smallest to largest.
Organismal Ecology
Population Ecology
Community Ecology
Ecosystem Ecology
Landscape Ecology
Global Ecology
Organismal Ecology
A field of study that examines how an organism’s structure, physiology, and behavior meet environmental challenges. (Like how flamingos select a mate in the lake)
Population
A group of individuals of the same species living in an area with the potential to interbreed and interact with one another. ( How environmental factors affect the reproductive rate of the flamingo population?)
Community
A group of populations of different species living in an area with the potential to interact with one another. (Factors that influence the diversity of species that interact with flamingos in the lake)
Ecosystem
Emphasizes energy flow and chemical cycling among biotic and abiotic components. (Questions like what factors control photosynthetic productivity in this aquatic ecosystem the flamingos use?)
Landscape
Studies how land structure (fragmentation, corridors, etc.) affect exchange of energy, material, organisms across ecosystems. Questions like to what extent do nutrients from terrestrial ecosystems affect organisms (including flamingos) in the lake?
Global
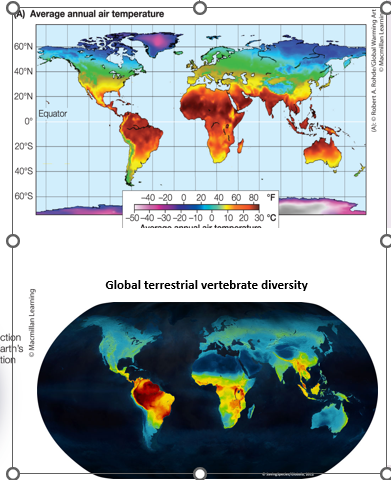
Examines how regional exchange of energy and materials influence the function and distribution of organisms across the biosphere. Question like how do global patterns of precipitation affect the distribution of organisms?
Biotic Factors
Living environmental components that influence the distribution and abundance of living organisms.
Abiotic Factors
Non-living physical and chemical environmental components that influence the distribution and abundance of living organisms such as temperature, water, sunlight, wind, and salinity. (both factors abiotic and biotic impact geographic distribution of organisms)
Climate (abiotic factors)
The long-term prevailing weather conditions in a given area, distinct from short-term weather.
Multiple scales: global, regional, and local levels.
Four Physical features: temperature, sunlight, air circulation (wind), and precipitation/humidity.
Solar Radiation & Latitudinal Variation
Reflected: 30% is reflected back into space by clouds, the atmosphere, and Earth’s surface.
Absorbed by Atmosphere: 20% of incoming radiation is absorbed by the atmospheric gases.
Absorbed by Surface: 50% is absorbed directly by Earth's surface, which moderates average surface temperatures.
Latitudinal Variation in Sunlight Intensity (Equator vs. Poles)
At the Equator: Sunlight strikes more directly, resulting in more heat and light per unit of surface area.
At Higher Latitudes: Sunlight strikes at an oblique angle, spreading the same amount of energy over a larger surface area.
Atmospheric Interference: At the poles, sunlight travels a longer distance through the atmosphere, leading to more absorption and scattering before it reaches the surface, which results in less heat and light.
Describe what is happening in these graphs
This graph shows the direct hit of sunlight on the earths surface and the varying intensity of solar radiation across different latitudes. The higher the latitude, the more oblique the angle of sunlight, resulting in lower energy concentration at the poles compared to the equator. They travel more longer distances through the atmosphere and when they hit Earth at an oblique angle and are spread over a larger area so that their energy is diffused.
Atmosphere
Thin layer of gases surrounding Earth, composed of nitrogen, oxygen, argon, carbon dioxide, and traces of hydrogen, helium, ozone, methane, and other gases.
Moderates Earth’s surface temperatures by trapping heat energy. Without it the average surface temperature of the Earth would be -0.4F rather than 62.6F
Global Climate
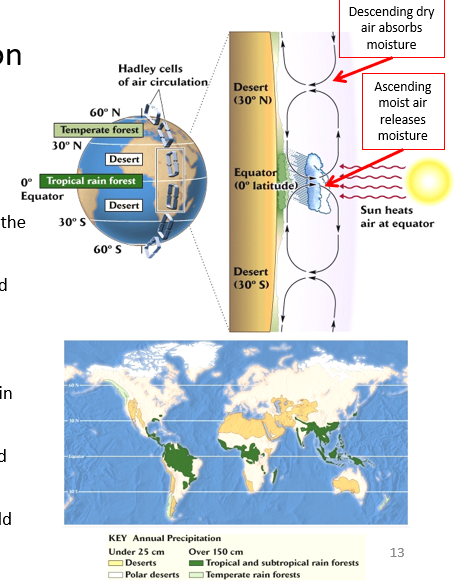
Air Circulation and Precipitation: Latitude (North-South)
1st: High Temperature in tropics leads to evaporation
2nd: warm/ wet air rises to poles
3rd: Rising wet air expands and cools, releases water in the tropics
4th: Newly dry air masses descend (30 Deg N and S) and absorb water from land
5th: Land becomes arid (Desert)
6th: Air continues to flow (60 deg N and S) air rises again and releases water *not as much as tropics
7th: Cool, dry rising air continues to pole, descends and flows back to the equator.
8th: Absorb moisture making poles rainless and very cold
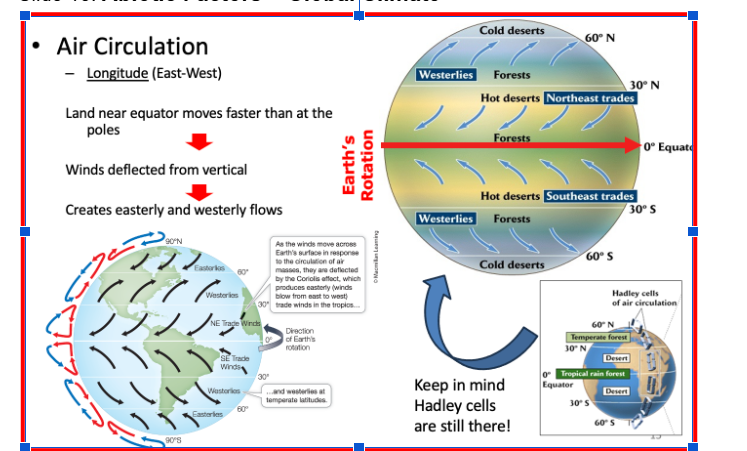
The Coriolis Effect and Earth's Rotation
Earth is a sphere so velocity of rotation around axis is fastest at the equator, where diameter is biggest, and slowest at the poles where diameter is smallest. This makes the Coriolis effect (you don’t need to know the name), which is the deflection of air or water (see next slide!) as a result of differences in the Earth’s rotational speed at different latitudes (self check, what is latitude?)
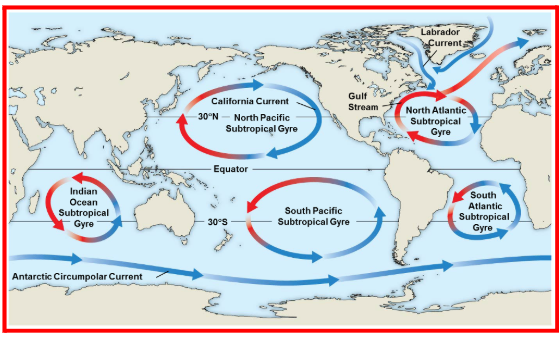
The Role of Longitude in Ocean Currents
Obstruction: Longitude and the arrangement of continents impact the flow of ocean currents by acting as physical barriers.
Path: Currents generally travel along lines of longitude until they hit a continent, which then forces the water to deflect.
What is seasonality?
Predictable changes in climate patterns every calendar year
Includes day length, solar radiation, temperature
Wet and dry seasons
Wind patterns
Upwelling in oceans
Upwelling
A process where offshore winds and oceanic currents push warmer water away from the shore, allowing deep, cold, and nutrient-rich water to rise to the surface.
Why does the equator have a very little variation in temperature and day length?
This is because it receives more direct sunlight throughout the year, resulting in minimal seasonal changes.
What is a Equinox and Solstice?
An equinox occurs when day and night are approximately equal in length, happening twice a year during spring(march) and autumn(september. This means that neither pole tilts toward the sun and all regions have 12 hr day/light cycle.
A solstice marks the longest and shortest days of the year due to the tilt of the Earth's axis, occurring in summer and winter.
December Solstice is when the northern hemisphere tilts away from the sun (days are shorter and nights are longer) and in the southern hemisphere tilts toward the sun (longest day and shortest night).
June Solstice is when the northern hemisphere tilts toward the sun (longest day and shortest night) and the southern hemisphere tilts away from the sun (shortest day and longest night).
The "Rain Shadow" Effect (Mountains)
Mechanism: When moisture-laden air from the ocean hits a mountain range, it is forced to rise.
Windward Side: As air rises, it cools and releases its moisture as precipitation, supporting lush vegetation. Creates a wet climate.
Leeward Side (Rain Shadow): The now-dry air descends on the opposite side of the mountain, absorbing moisture from the land and creating arid or desert conditions.
Example: This effect is a primary driver for specific species distributions in mountainous regions like Costa Rica and due to its high concentration in mountain ranges this causes it to be a wet climate.
Temperature Inversions in Valleys
Standard Condition: Usually, air cools as it rises in altitude.
A phenomenon where warmer air traps cooler air near the ground, occurring when air near the ground cools faster than the air above it.
Ecological Impact: This traps moisture and pollutants near the surface, affecting the local microclimate and the organisms living within the valley floor.
Marine Topography: The Coastal vs. Intertidal Zones
Water is 70% of Earth surface: Water depth (zonation) impacts include light penetration, water temperature, water pressure, water movement (waves, tides), and nutrients
Coastal Zone: Located over the continental shelf; it is highly diverse and productive due to high nutrient levels and sunlight (lots of plankton/fish).
Intertidal Zone: The area between high and low tide; it is extremely dynamic, requiring organisms to tolerate mechanical wave action, varying temperatures, and shifting between land and water predators.
Estuaries: Unique transition zones where rivers meet the ocean, characterized by fluctuating salinity, sediment, and light.
The Photic Zone and Aquatic Life
Definition: The upper layer of water where sunlight is sufficient for photosynthesis.
Significance: Approximately 90% of all aquatic life is found here because primary production depends on sunlight penetration.
Comparison: The Pelagic zone refers to the open water column, while the Benthic zone refers to the very bottom (sediment/floor).
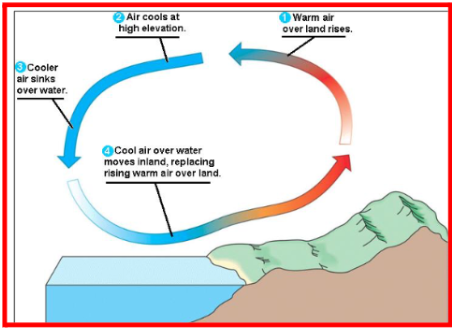
How do oceans influence nearby land climates through air movement?
Hot Land (Day): As land heats up, hot air rises and pulls in a "sea breeze" of cool air from over the water.
Cool Land (Night): As land cools faster than water, the relatively warmer air over the water rises, pulling a "land breeze" of cool air from the shore out to sea.
Lake vs. River Abiotic Profiles
Lakes: Hold less than 3% of Earth's freshwater but support 10% of all aquatic species; temperature and nutrients vary seasonally.
Rivers (Headwaters): Characterized as cool, fast-flowing, and rich in oxygen.
Rivers (Downstream): The channel widens and slows, leading to warmer water and reduced oxygen/light levels due to high sediment accumulation.
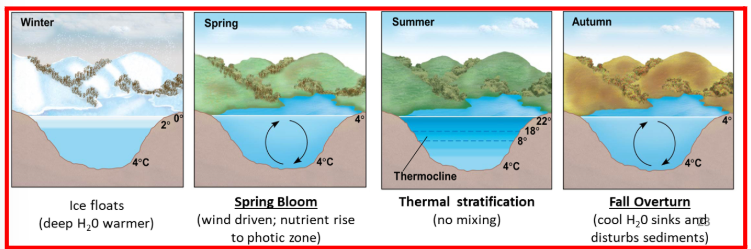
Regional/Local climate explain the diagram
Winter Ice floats, however, the deeper in the lake or river the H20 is warmer
Spring Bloom: Wind driven, nutrient rise to photic zone so the temperature is the same at the top and bottom.
Summer: Thermal stratification meaning the water is not mixing at all so going deeper into the water means its colder compared to the top.
Autumn: Fall overturn meaning the cool H20 sinks and disturbs sediments so temperature is the same from bottom and top.
Microclimates and Thermal Boundary Layers (Science News Alyssa Stark)
Microclimate Definition: Very small-scale variations in climate, such as shade under a log or moisture levels in a specific patch of soil.
Example (Tropical Ants): Ants in the canopy experience extreme heat (up to 50°C) on dark branch surfaces.
Boundary Layers: The thin layer of still air right next to a surface (like a branch); it can be significantly hotter than the surrounding air, creating a "micro-environment" that dictates where an insect can survive.
Biomes
Divisions of ecological communities characterized by distinctive vegetation and annual patterns of temperature and precipitation.
Hierarchy: In all biomes, biotic conditions (living organisms) generally follow and are determined by the abiotic conditions (non-living factors).
Primary Characteristics of Terrestrial Biomes
Defining Feature: Terrestrial biomes are categorized primarily by their vegetation type.
Abiotic Drivers: The specific vegetation that grows in a region is driven by the interaction between temperature and precipitation.
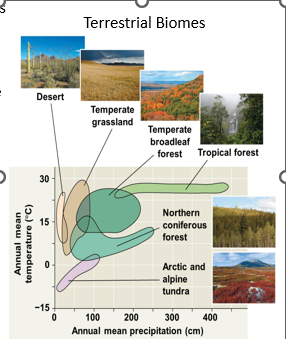
Visual Representation: These are often mapped on a climograph to show how moisture and heat determine whether a region becomes a desert, grassland, or forest.
1. Reading the "Ingredients" (The Axes)
The Bottom (X-axis): Precipitation. This is the amount of water an area gets per year. It moves from Dry (left) to Wet (right).
The Side (Y-axis): Temperature. This is the average heat per year. It moves from Frozen (bottom) to Tropical (top).
2. The Biomes: Finding the Balance
Each colored shape shows the specific "sweet spot" where a biome survives.
Desert (The Hot & Dry Spot): Located on the far left. It can be very hot, but because there is almost no rain, you only see specialized plants like cacti.
Tundra (The Cold & Dry Spot): Located at the very bottom. It is too cold for trees to grow, resulting in a low-growing, frozen landscape.
Tropical Forest (The Hot & Wet Spot): Look at the top right. This area has high heat and high rainfall (up to 400 cm!). This combination creates the most diverse life on Earth.
Primary Characteristics of Aquatic Biomes
Defining Feature: Unlike terrestrial biomes, aquatic biomes are characterized by physical and chemical environmental factors.
Key Abiotic Factors: These include salinity, water depth, light penetration, and nutrient availability.
Biotic Response: The types of aquatic life present (e.g., coral, specific fish, or phytoplankton) are a direct result of these physical and chemical constraints.
Ecotone
An area of integration between different biomes.
Definition of a Population
A group of individuals of a single species living in the same geographic area.
Characteristics: Members of a population rely on the same resources, experience similar environmental pressures, and have the potential to interbreed.
Key Factors Influencing Populations
Dispersion: The specific pattern of spacing among individuals within the boundaries of the population.
Density: The total number of individuals measured per unit area or volume.
Demography: The study of the vital statistics of a population and how they change over time, specifically regarding growth and decline.
Intraspecific vs. Interspecific Interactions
Intraspecific: Interactions that occur between individuals of the same species.
Interspecific: Interactions that occur between individuals of different species.
Context: Both biological interaction types, along with the physical environment, are primary drivers of population dynamics.
Density vs. Dispersion (Distinction)
Density is a count (e.g., 50 oak trees per square kilometer).
Dispersion is a map of where those individuals are located relative to one another (e.g., are they all huddling near a stream or spread out evenly?).
Environmental Drivers of Population Change
Physical Environment: Abiotic factors like temperature, sunlight, and precipitation that limit where a population can exist.
Biological Pressures: Interactions within or between species (competition, predation, etc.) that influence the birth and death rates of the population.What is Dispersion in population ecology?
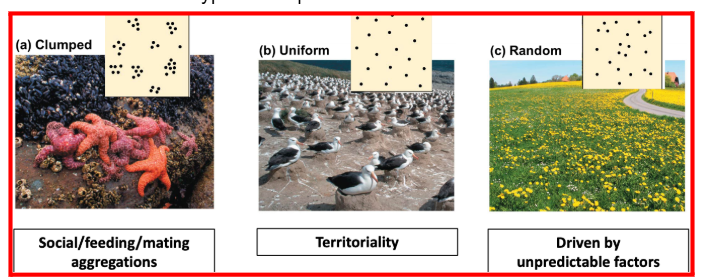
What is Dispersion in population ecology?
Definition: The specific pattern of spacing among individuals within the geographic boundaries of a population.
Key Drivers: Spacing is influenced by both environmental factors (like resource availability) and social factors (like territoriality or mating behaviors). Their could be passive or active dispersals.
Examples: Clumped: Social/feeding/mating aggregations, Uniform: Territoriality, and random: Driven by unpredictable factors
Density
The number of individuals per unit area or volume.
Interplay between processes that add and remove individuals from the population
Aka births and immigration, and deaths and emigration
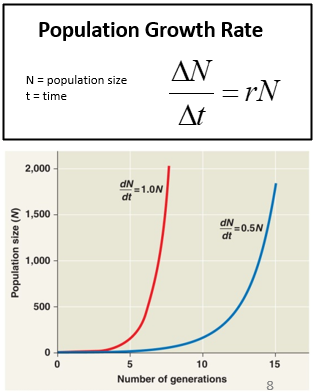
Population Growth
Rate of Increase: r= birthrate per capita (b) - death rate per capita (d)
•Population growth rate – change in number of individuals in population over time
•Per capita rate of increase (r) – how quickly a population grows per individual already in the population
Big R faster, smaller r a little slower
Exponential Growth Model (Characteristics)
Nature: This is density-independent growth, meaning the rate of growth is not limited by the current population size.
Conditions: It occurs when populations have unlimited resources or are rebounding from a drastic reduction.
Dynamics: The population size (N) increases at a constant rate (r); as N gets larger, the number of individuals added per unit of time increases.
Equation: dN/dt = rN
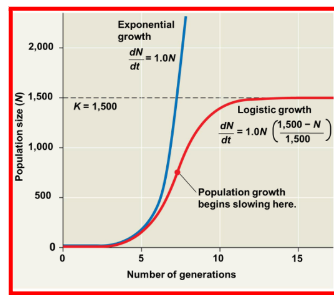
Logistic Growth Model (Characteristics)
Nature: This is density-dependent growth, which is a more realistic model for most natural populations.
Constraints: Growth is limited by factors such as limited resources, predators, and pathogens.
Key Concept: Incorporates Carrying Capacity (K), the maximum population size that a specific environment can sustain.
Behavior: The per capita rate of growth approaches zero as the population size (N) nears K
Equation: dN/dt= rN (K-N)/K
Definition of Demography
Definition: The study of the vital statistics of a population and how they change over time.
Key Metrics: Primarily focuses on births and deaths, though it can also include immigration (individuals entering) and emigration (individuals leaving).
Purpose: To understand the specific factors driving the growth and decline of populations.
Cohort vs Life Table
Cohort: A specific group of individuals who are all born within the same time frame.
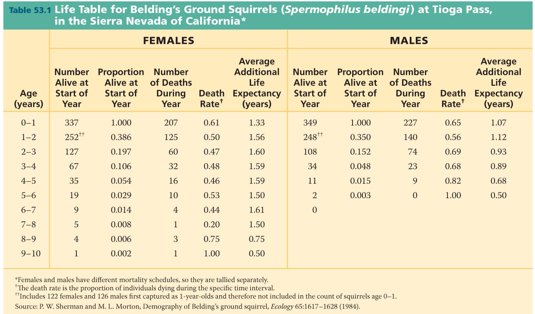
Life Table: A summary of the survival and reproductive patterns of a population; it is best measured in years.
Dynamic Life Table vs. Static Life Table
Dynamic Life Table: Summarizes the survival patterns of a single cohort followed from their birth until the death of the last individual.
Static Life Table: Summarizes the survival patterns of an entire population at one specific moment in time.
Measurement: Survival patterns and vital statistics in these tables are best measured by years.
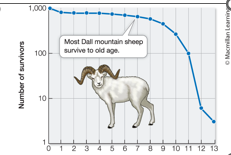
Type I Survivorship Curve
A curve representing high survivorship at most ages, typically associated with parental care followed by senescence.
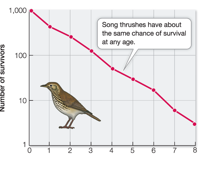
Type II Survivorship Curve
A curve that represents a constant rate of survivorship across all ages and most deaths from predation so at any age they are equally likely to die.
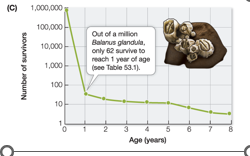
Type III Survivorship Curve
Low juvenile survivorship with high mortality early in life, followed by increased survivorship for those that survive past a certain age, often seen in species that produce many offspring but provide little parental care.
Definition of Life History
Definition: The specific traits that affect an organism’s schedule of reproduction and survival.
Key Parameters:
Survivorship: Represented by Type I, II, or III curves.
Reproduction: Includes breeding age, the number of offspring per event, and the total number of reproductive events in a lifetime.
Survivorship vs Reproduction = Tradeoff
Natural selection favors traits that improve an organism’s chance of survival and reproductive success.
The Cost of Reproduction (Red Deer and Kestrel Examples)
Trade-offs: Reproduction often comes at the expense of survival.
Red Deer: Observations show higher mortality rates in reproductive females compared to non-reproductive ones.
European Kestrels: In studies where offspring were artificially added to nests, parents worked significantly harder to provide food, which decreased the parents' survival for the following winter.
What is Fitness (Biological Definition)?
Definition: An individual's relative contribution to the gene pool of the next generation.
Measurement: It is not about physical strength, but rather the success of an organism in surviving and reproducing viable offspring.
Maturity and Fecundity in Life History
Maturity: The specific age at which an organism reaches breeding age and first reproduces.
Fecundity: The number of offspring produced per individual breeding event.
Trade-offs: These parameters are often balanced; for instance, species with very high fecundity (many offspring) often provide less parental care per individual offspring.
What is parity?
Number of breeding events
Iteroparity
A reproductive strategy where an organism reproduces many times during its lifetime, such as humans or chimpanzees.
Semelparity
A reproductive strategy where an organism reproduces only once during its lifetime, such as salmon or the ‘century plant’.
Definition of Life History Strategies
Definition: The specific ways individuals allocate limited resources to survival and reproduction based on genetic and environmental factors.
Evolutionary Driver: These strategies are shaped by the predictability and stability of the habitat.
Characteristics of K-strategists
Primary Goal: Thrive in populations living near the carrying capacity ($K$).
Habitat: Predictable, stable environments where individuals must compete for high-quality resources.
Reproductive Strategy: Typically iteroparous (reproduce more than once) with greater allocation to growth, resulting in fewer offspring.
Survivorship: Long lifespan with density-dependent mortality (Type I or II curve).
Population Growth: Slowly rising population growth that stabilizes at or near $K$.
Specific Traits: Large adult size, large eggs/babies, small clutch size, and slow maturation.
Examples: Trees (e.g., oak), birds (e.g., bluebirds), and polar bears.
Characteristics of r-strategists
Primary Goal: Maximize the per capita rate of increase ($r$).
Habitat: Unpredictable or unstable environments where they use a wide variety of resources.
Reproductive Strategy: Often semelparous (reproduce once) with a greater allocation to reproduction, resulting in large numbers of offspring.
Survivorship: Short lifespan with density-independent mortality (Type III curve).
Population Growth: Periods of exponential growth followed by periodic or seasonal declines.
Specific Traits: Small adult size, small eggs/babies, large clutch size, and rapid maturation.
Examples: Dandelions, flies, and rabbits.
Why are K-strategists often larger in size?
Competition: $K$-selection occurs in environments where competition for resources is high.
Benefit: Being larger is often more beneficial in highly competitive conditions, allowing individuals to better secure resources and invest more in the survival of each offspring.
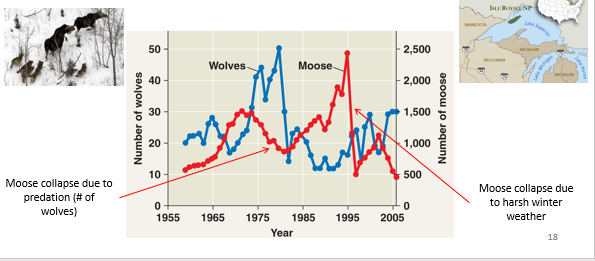
Population Dynamics
Population fluctuations from year to year or place to place
Depends on biotic factors or abiotic factors that interact with each other, including birth rates, death rates, immigration, and emigration.