Business Tools
1/31
There's no tags or description
Looks like no tags are added yet.
Name | Mastery | Learn | Test | Matching | Spaced | Call with Kai |
|---|
No analytics yet
Send a link to your students to track their progress
32 Terms
Ansoff Matrix: what is it used for and how does it look like?
Used to: analyse and plan growth strategies & aid in decision making on growth strategies.
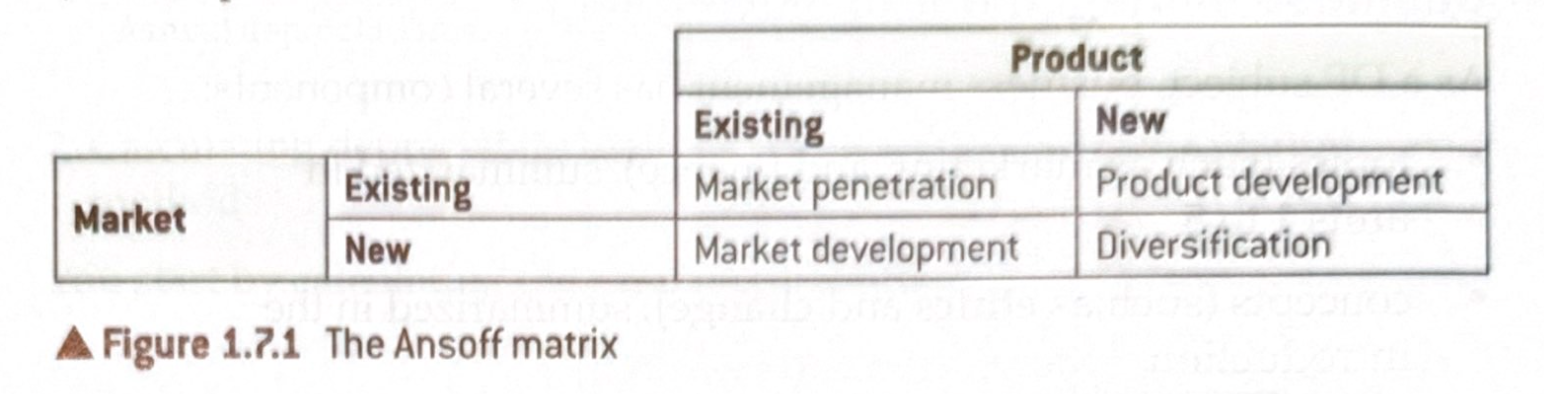
Ansoff Matrix in detail
Market penetration: growth by increasing market share
Safest option, limited opportunities by competitors, relies on promoting brand loyalty.
Market development: looking for new markets or market segments in the existing market.
Biz may not understand the new markets, success requires good market penetration — effective distribution channel, market research, and local knowledge
Product development: new product for the existing market.
Sometimes only upgrades, depends on loyalty of customers to the OG, success improves with strong R&D and first-mover advantage.
Diversification: A new production introduced to a new market.
Risky: untested product and unfamiliarity, to increase success: due diligence testing (research and risk eval.), recognition of existing biz, collaborations
Ansoff limitations
Does not include competitors
Ignores internal resource constraints
Does not account for rapid market shifts
Over simplified
Boston Consulting Group (BCG) Matrix, what is it used for and how does it look like?
Used to: Evaluate different products sold by a company (product portfolio)
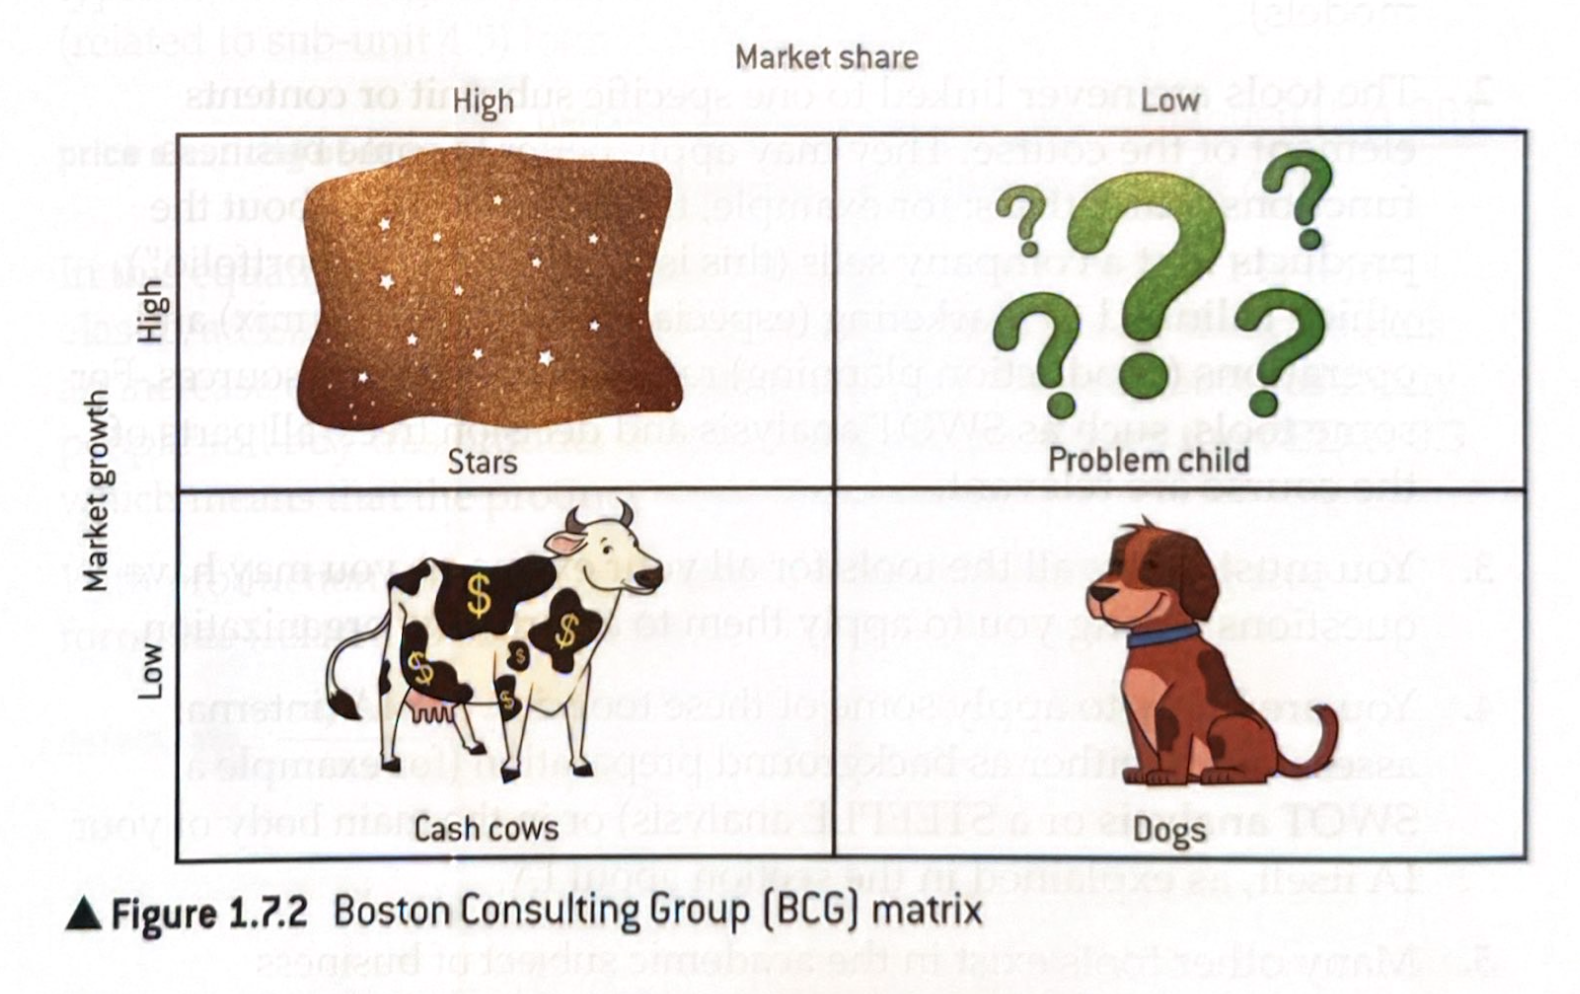
BCG in detail
Stars: Successful products that generate high income but require high levels of investment to sustain their growth.
Lots of competition to gain market share as it is a rapidly growing market.
Cash Cows: Well-established products in a mature market, with high profitable sales.
Because of the strong market presence, higher prices can be charged without influencing sales.
Problem Child/?: a concern as high amount of money needed to increase their low market share
A competitive market so needs a strong market strategy to succeed — opportunity cost.
Dog: generate little income and have little future prospects
need to be replaced, biz with a lot of these usually have cash flow issues.
BCG Matrix strategies to implement
Holding: high market share products need to be maintained
Building: turn problem child into stars (using cash cow money) through promotion and distribution.
Harvesting: using the positive cash flow of products to invest in other portfolio products
Divesting: dos are removed/sold, freeing up reources that will bosst other products.
BCG matrix limitations
only focuses on the current market
vigourus grouping — no flexibility
time consuming and complex to categorise all products for a business with a large product portfolio.
high market share does not mean high profits
Marketing Mix: 7Ps
The key elements of a marketing strategy that ensure a successful marketing of a product.
Price: indicated the value customers perceive the product to have
Promotion: way costumers are informed and persuaded to purchase the product.
Place: the products location or channels of distribution used to get the product to the customer
Product: the good/service offered to the market to satisfy their needs and wants.
People: the human capital (skills, attitudes and abilities) involved in the production of goods or provision of services.
Process: the procedures and policies followed to how the product/service is delivered.
Physical evidence: the tangible points that observable by customers, to provide good-quality evidence of a service.
Product Life Cycle Diagram
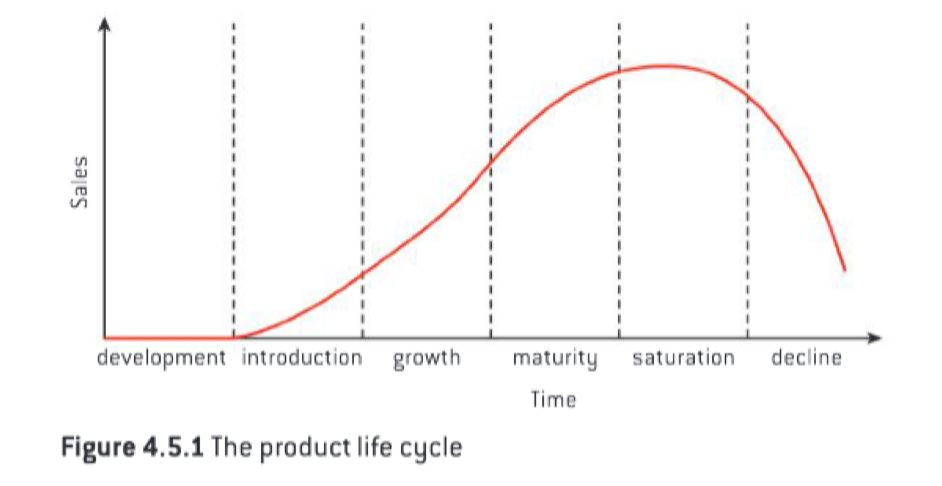
Product Life cycle in detail
Development
High R&D costs, lots of time and effort invested
Negative cash flow
Introduction/launch
Low sales (customers unaware of product existence), high promotional costs
Negative cash flow, no profit.
Growth
Sale volume and revenue increase, Rising profits and positive cash flow — Possible economies of scales
Advertising for brand loyalty, more distribution channels, product improvements
Maturity
Slow sales rise, positive cash flow, highest profits
Promotional pricing strategy (temporarily reduce price)
may introduce extension strategies
Saturation
sales begin to fall, positive cash flow, too much competition
Decline
product may be withdrawn from the market, new models introduced.
Extension strategies for product
Market development
finding new uses for the product
changing product packaging
new promotional strategies
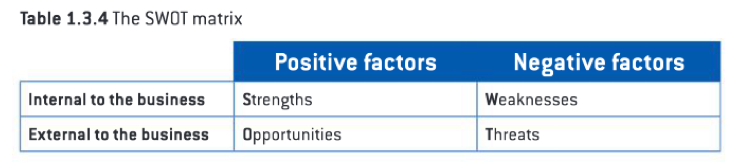
SWOT analysis
Used to: help a business set and develop objectives and make decisions.
Internal: from business functions
External: From STEEPLE
SWOT limitations
Based on perceptions
Less sources means less reliable data and weaker analysis
Not using it to implement change after having taken the time to write it
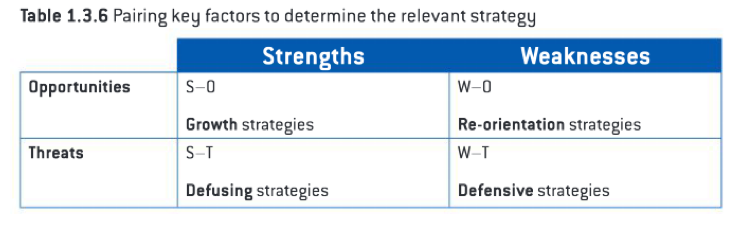
Using the SWOT analysis to determine the relevant strategy
Growth strategies: best achieved by S.O., produce positive short term strategy — pursue only if no other big issues.
Defensive strategies: adopted when at most vulnerable (T.W. exist in combination) so biz need to act quickly — negative short-term
Re-orientation strategy: Addresses the weakness to use them for the opportunities in the market — positive and Long term.
Defusing strategy: Eliminate threats in the market to focus in the strengths — neutral, medium short term .
SMART objectives
Used to: assess wether objectives are realistic
Specific
Measurable
Achievable
Relevant
Time-bound
Business Plan
Used to: address all the issues that need to be planned before operations begin, covering the four business functions (marketing, operations, finance and human resources)
Start-up costs and break even point are essential
The organisation, aims, objective, mission and vision statements
Important for stakeholders: shareholders and financial institutions to provide capital.
Economies Vs Diseconomies of scale graph
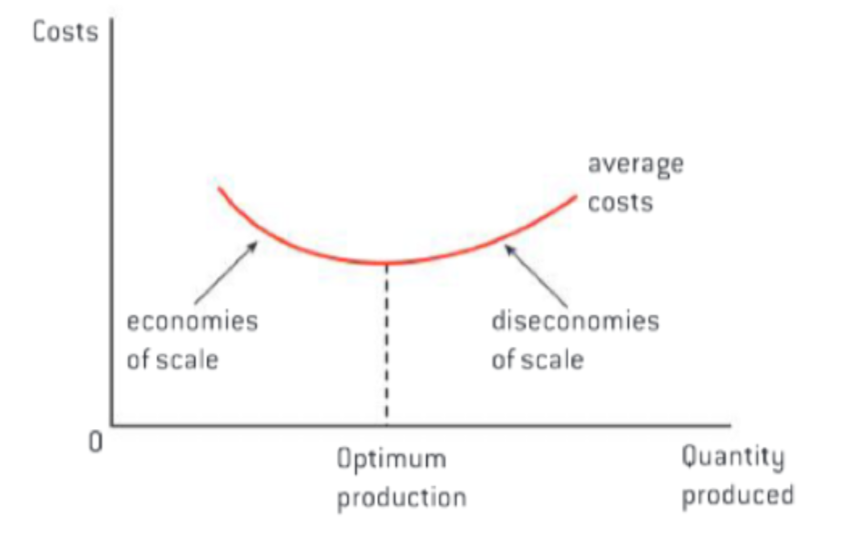
Internal Economies of Scale
Efficiencies that the business itself can make:
Financial - bigger businesses are less risky than smaller (eg. lower interest rates if more financially stable)
Managerial - Bigger businesses can afford specialised mangers, which typically has grater efficiency.
Marketing - Bigger can run more effective marketing campaigns such as sponsoring major events
Technical - Bigger units of production reduce costs due to the law of variable proportions
Purchasing - Discounts by bulk buying
Risk bearing - bigger bizs have widening product range, thus spreading their risks.
External Economies of Scale
Efficiencies that a business achieves because someone else expanded:
Consumers - Infrastructure building that can house many businesses attracts more customers and thus gives an easier access to industry.
Employees - labour concentrations in geographic areas (eg. Hollywood or science parks) mean businesses benefit from lower recruiting and training costs
Internal Diseconomies of scale
Inefficiencies that the business itself can make:
Managerial - Managers are over-specialised and cannot/will not work outside their area of expertise.
Marketing - Big marketing mistakes leading to high costs or lawsuits.
Technical - Size of units too large to be transported easily
Communication - too complex structure
Geographical - too many location, hard to manage dispersion and communicate.
Purchasing - buying too much stock, wasteful and more expensive than spending less on less stock.
Risk bearing - too high of a risk
External economies of scale
Inefficiencies that a business achieves because someone else expanded:
Employees - when one area is too concentrated on one economic activity there can be a shortage of workers, thus the biz will have to pay higher wages.
Circular Business model
Tools of sustainable development that help create a ‘circular economy’ — a circular production and consumption model.
Circular supply model: using sustainable resources as supplies
Resource recovery model: waste converted to raw materials for another industry
Product life extension model: lengthen lifetime before discarded
Sharing model: Sharing products or processes (eg. carpooling)
Product service system (PSS) model: Paying for the service the product provides without owning the product
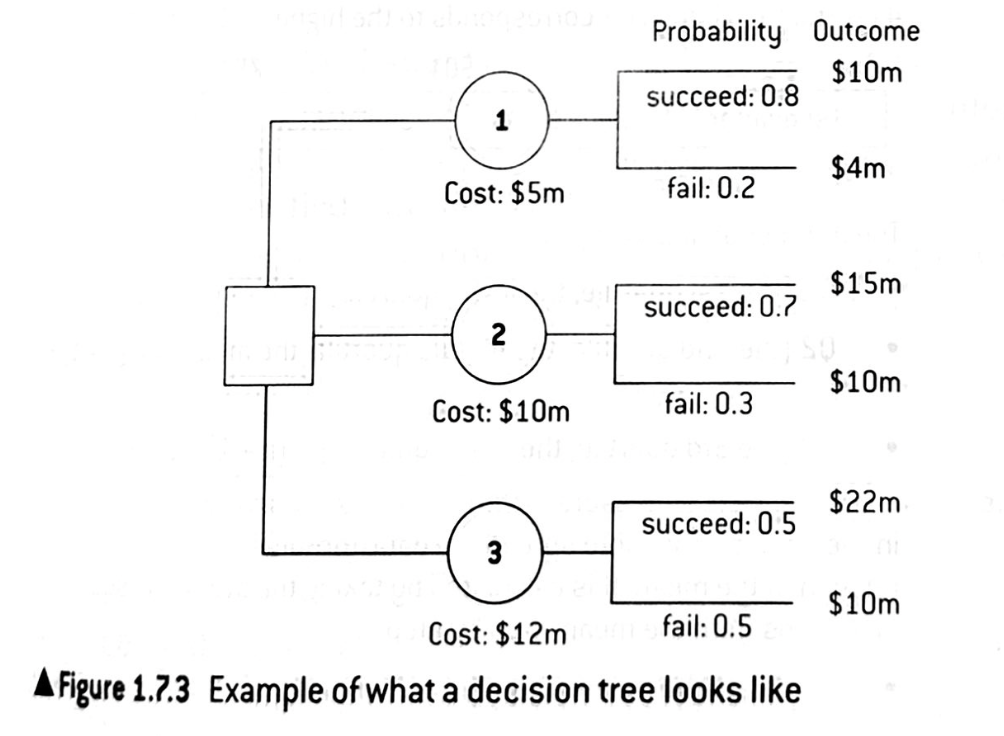
Draw and define a decision tree
Definition: a graphical tool that uses branch modeling to compare and contrast quantitative data for an organisations decison
Key: (Square) decision point, (circle) chance node, // reject lines
Limitations to decision trees
Ignores important qualitative factors
Probabilities are just estimates
Numbers may be prone to bias and mood of the people who make it
Doesn’t reduce the risks
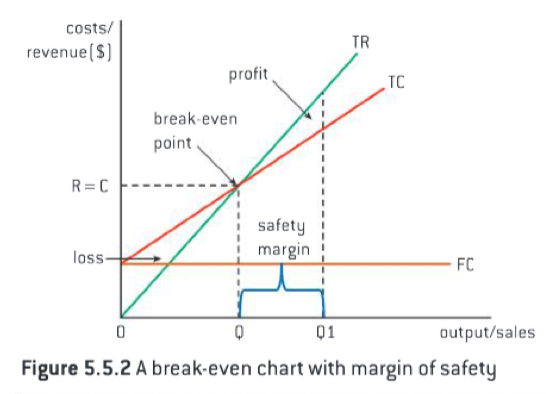
Draw a Break even chart and define brake even point
A measure of output where total revenue equals total costs.
Limitations of a break even chart
Only considers one product
Assumes all units are sold and there is no stock buildup
Assumes price does not change
Does not acount for economies or diseconomies of scale
Does not consider inflation
Assumes the market demand or competition stays constant and sales are constant
Target Profit output (definition and formula)
The level of output that is needed to earn a specified amount of profit

STEEPLE analysis
Gives a detailed analysis of external factors that may influence an organisation and therefore its decisions.
Social
Technological
Economic
Ethical
Political
Legal
Ecological
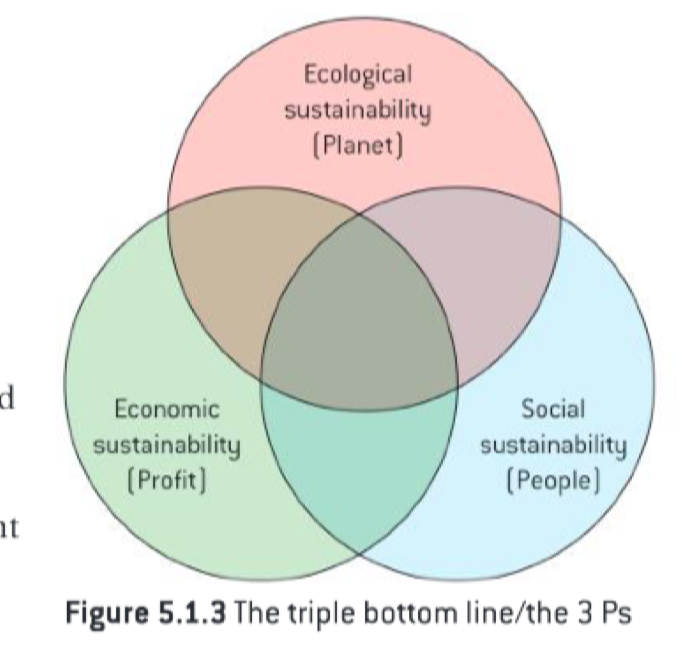
Triple Bottom Line
The need to take economic, social and ecological factors into account wen making business decisions, only once there is a balance can a business be deemed successful.
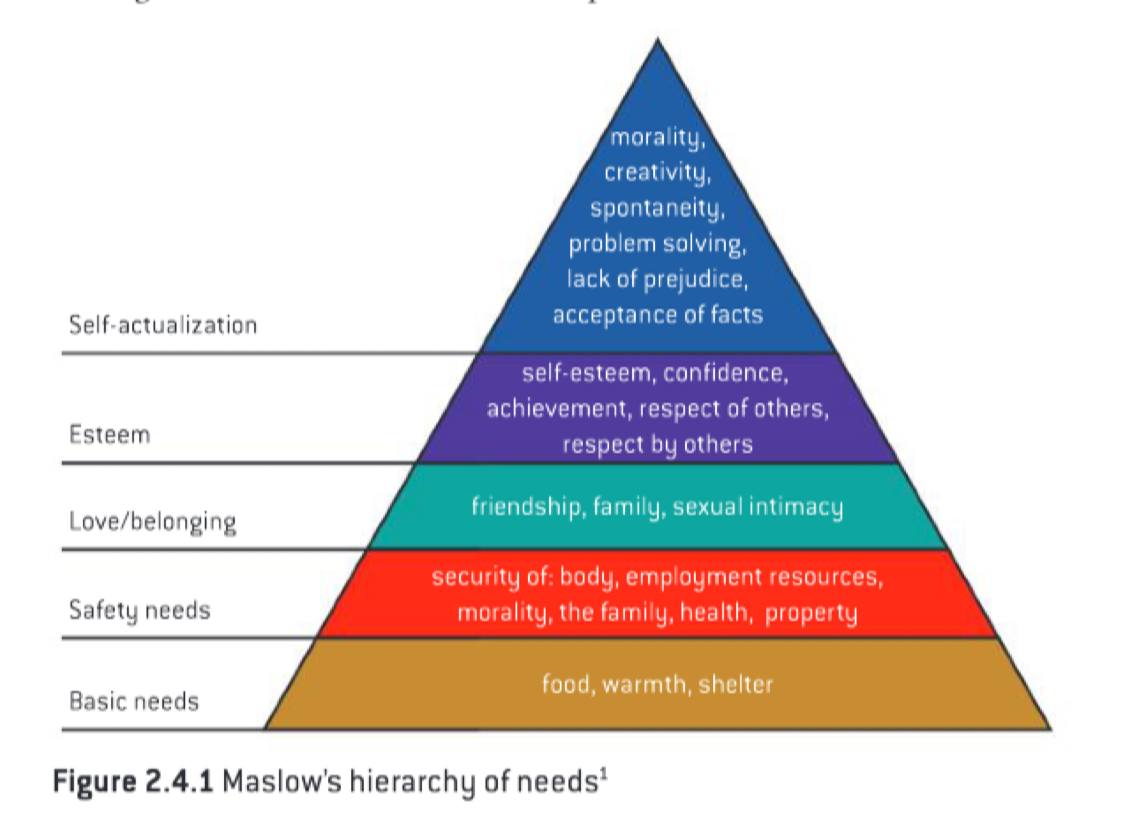
Maslow’s hierarchy of needs diagram
First four levels are considered “basic needs” once those are out of the way, they no longer cause anxiety.
The remaining are growth needs
Taylor’s theory
Enforces the ‘adoption of the best way of working’ which was to ensure that output is maximised in the shortest time possible
Herzberg’s two-factor theory of motivation
Hygiene needs: provide dissatisfaction if not met
Realtionships
Salary
Status
Security
Personal life
Workspace environment
Motivational needs: they get you working because there is an intrinsic reward
Achievement
Recognition
Responsibility
Advancement