ecology exam III (ts is gonna be complete, don't doubt me sophie)
1/42
There's no tags or description
Looks like no tags are added yet.
Name | Mastery | Learn | Test | Matching | Spaced | Call with Kai |
|---|
No analytics yet
Send a link to your students to track their progress
43 Terms
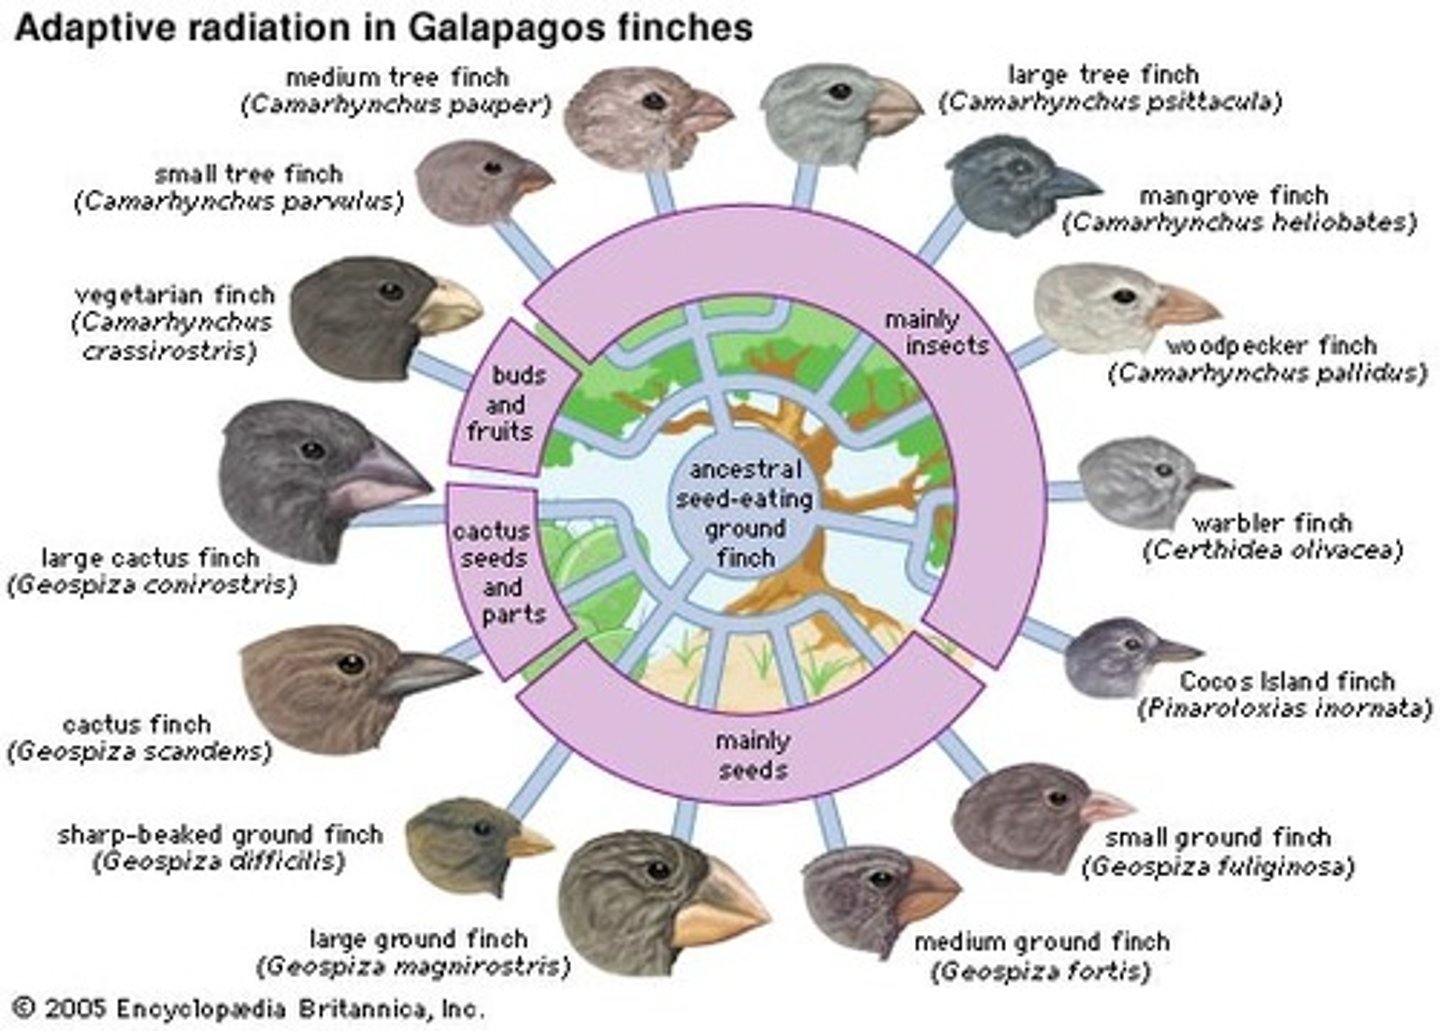
ways to define communities
taxonomic affinity - evolutionary lineage (ex. birds)
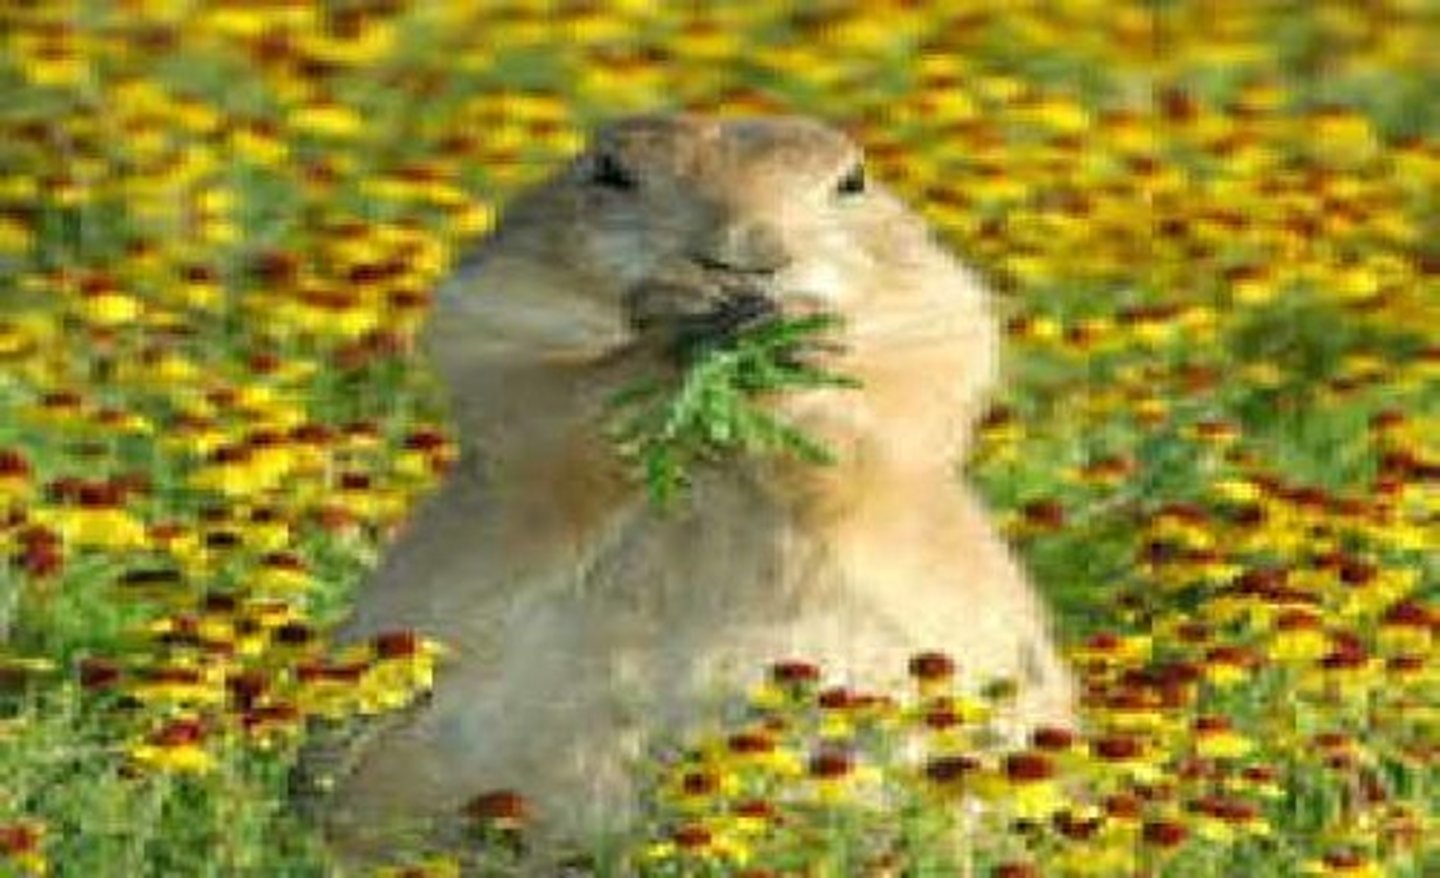
guild - shared resource (ex. prairie grazers)
functional group - similar function (ex. N fixers)
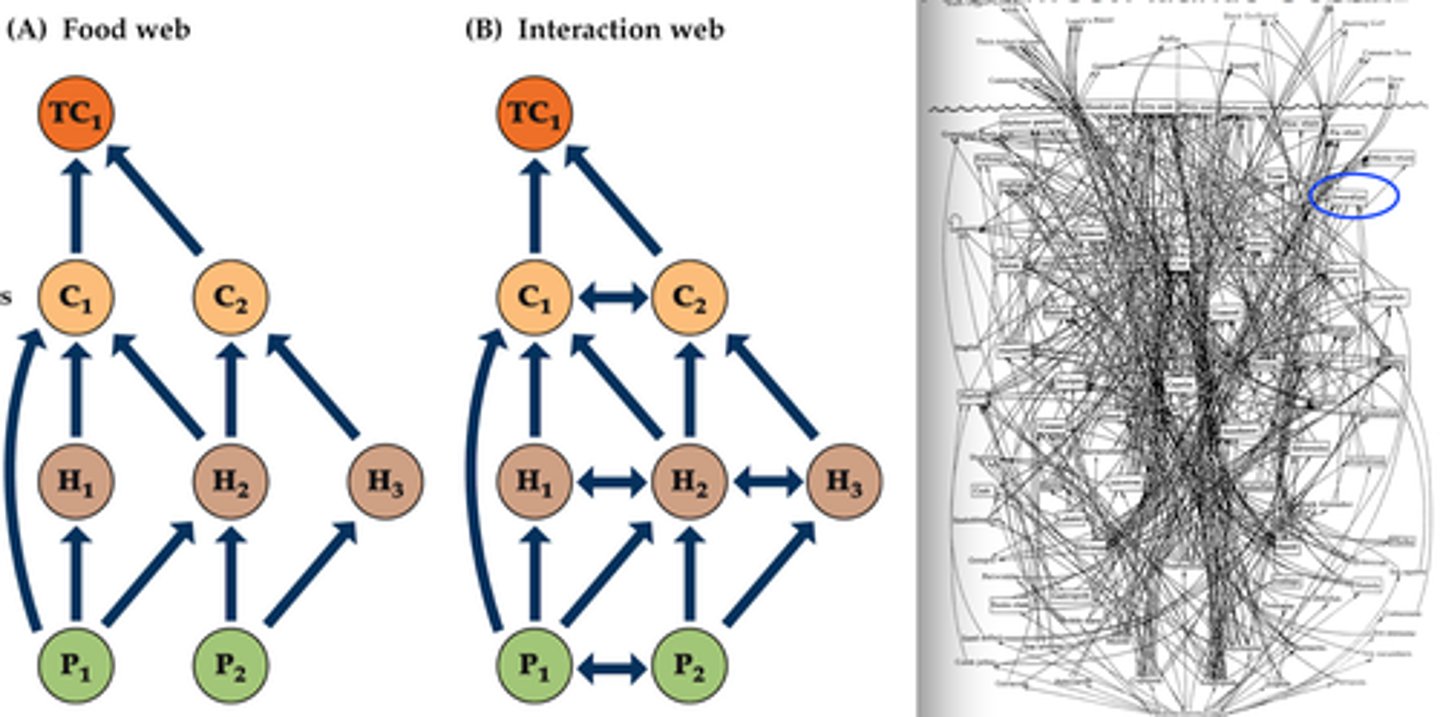
food vs. interaction web
different...but basically food web is a simple interaction web
- food web shows trophic (vertical) level connections (simple but often excludes symbionts/detrivores and interaction strength)
- interaction web shows trophic (vertical) and nontrophic (horizontal) connections (accurate but still no interaction strength
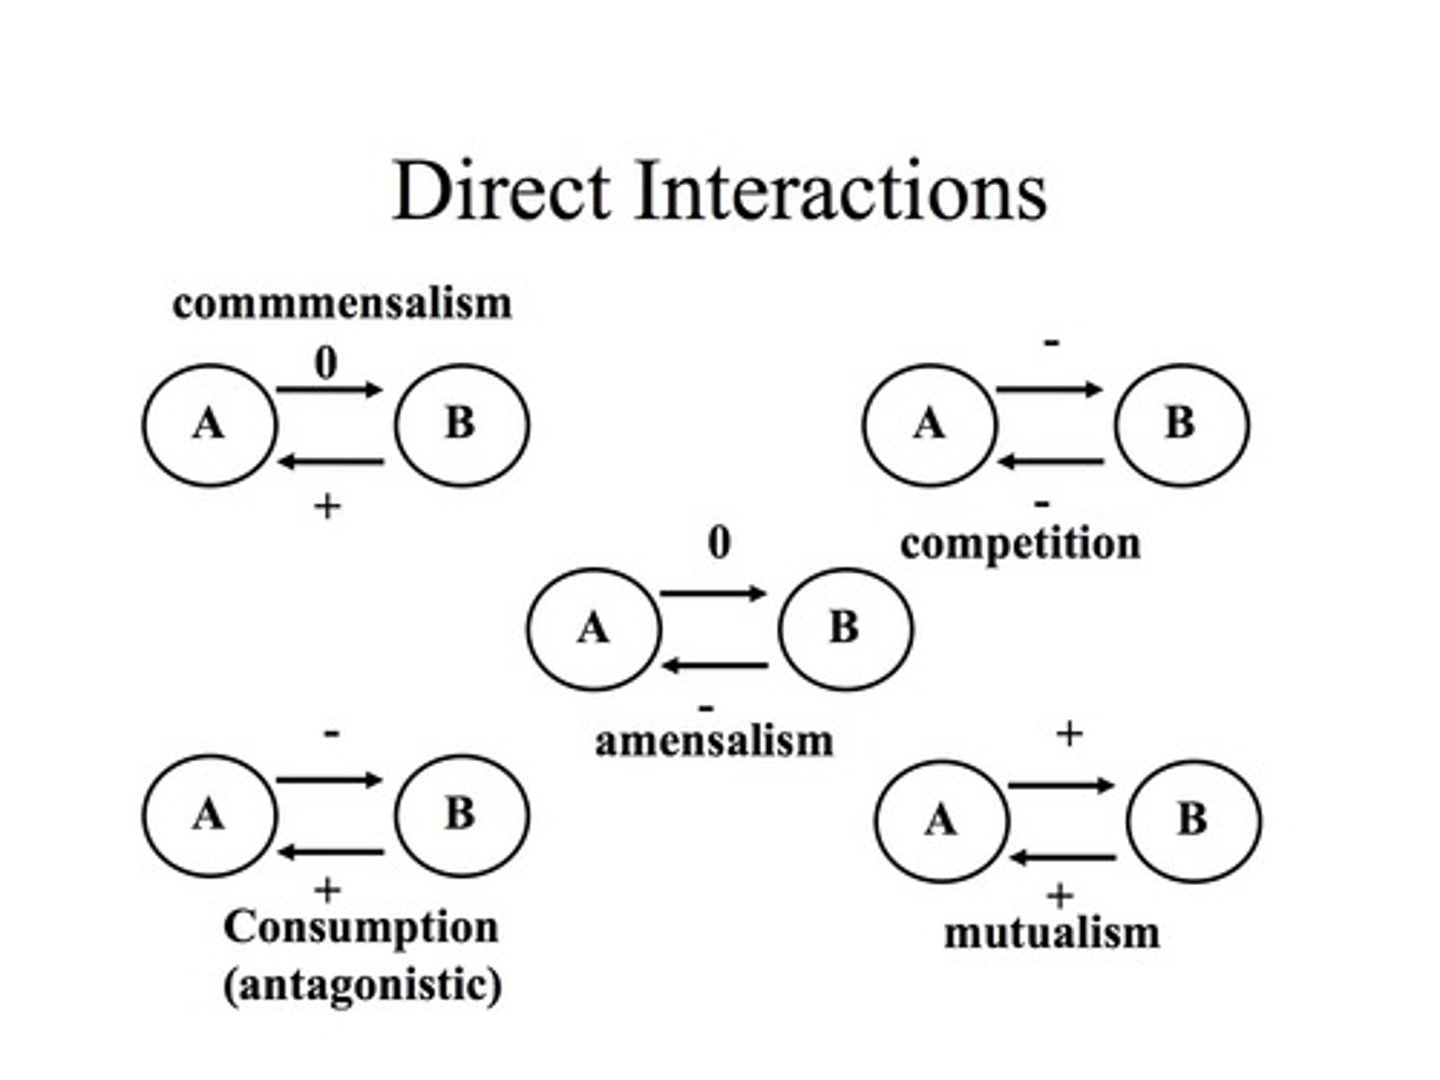
direct species interactions
direct, that's all the definition is lowkey (ex. competition, predation, facilitation, etc.)
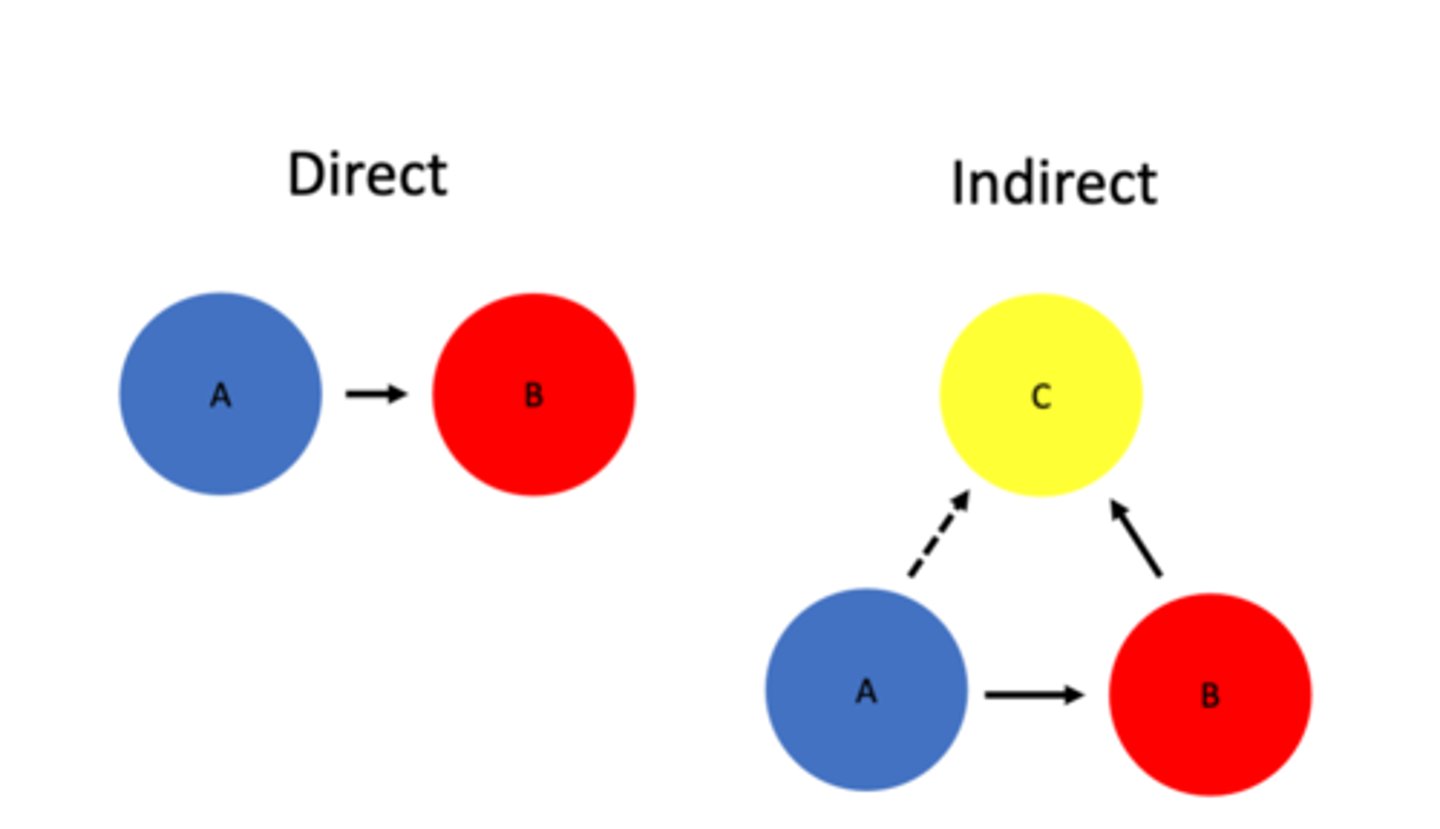
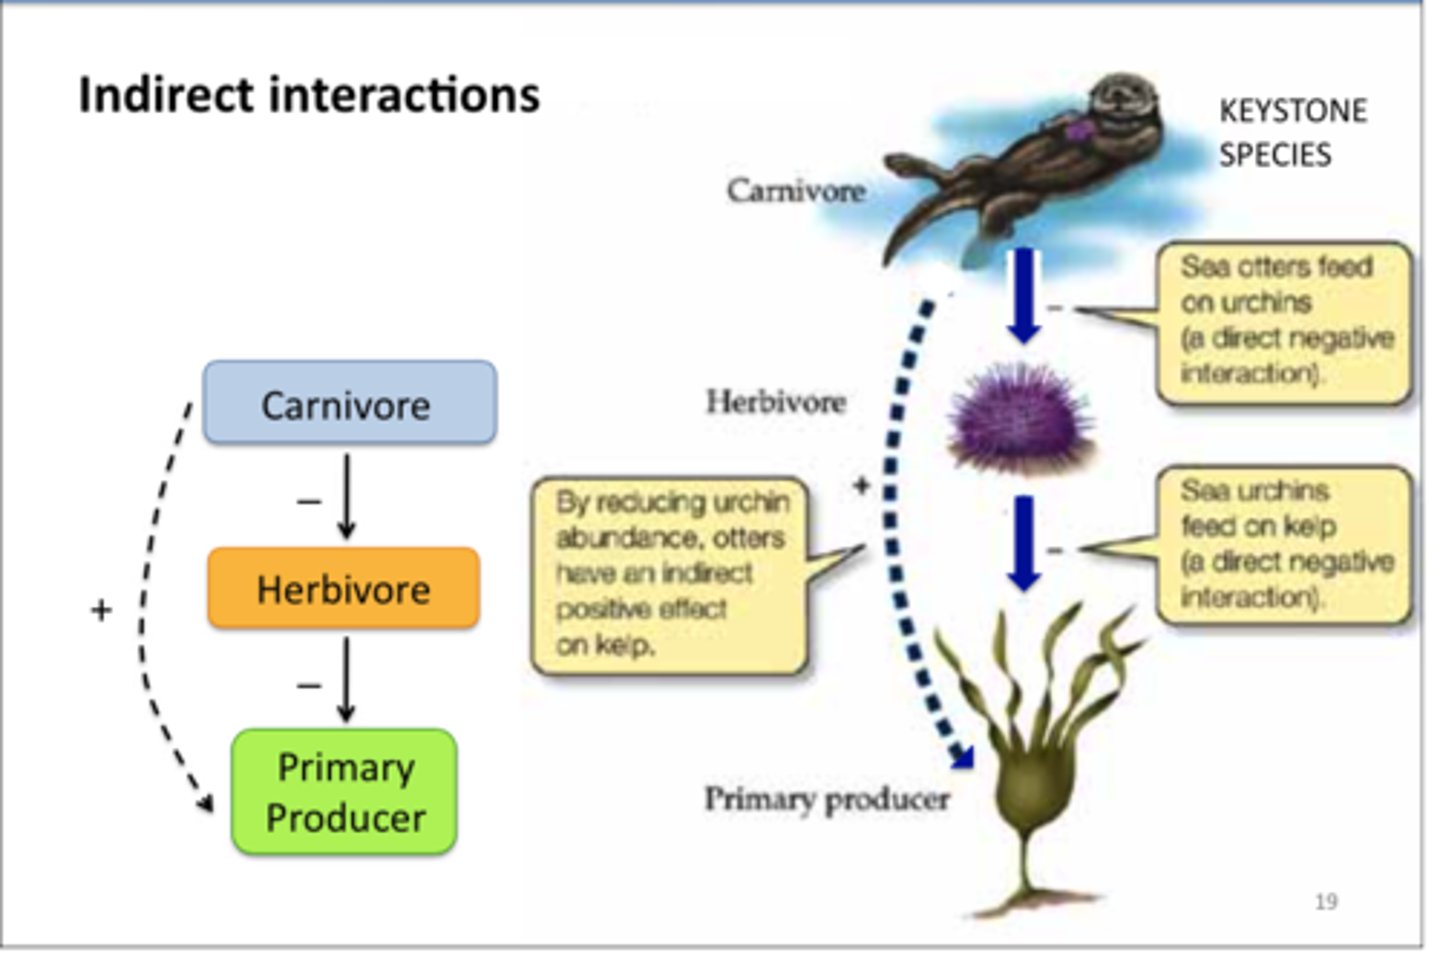
indirect species interactions
relationships btw 2 species mediated by a third
trophic cascade
idea that change at one higher trophic level trickles down and impacts species abundance/composition at lower levels (otter/urchin/kelp scenario)
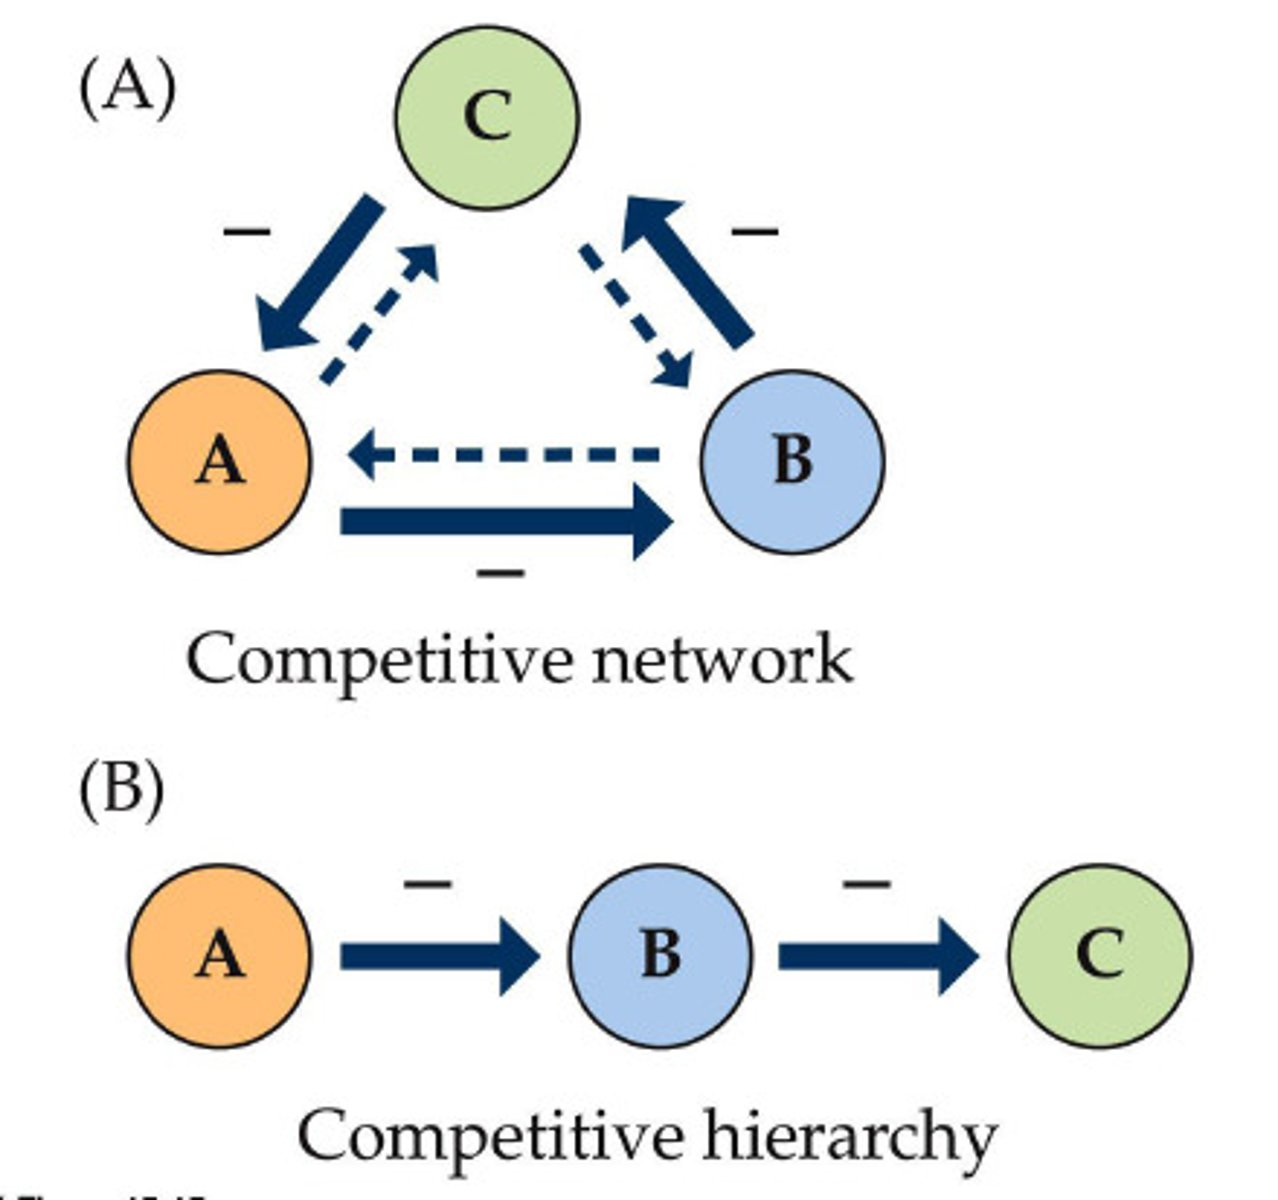
competitive networks vs hierarchy
networks - multiple species check one another (maintains diversity!)
hierarchy - one species dominates relationship
RII
relative interaction intensity (range -1,1)
basically, removing one species and observing the effect on a target species (if removal means large decrease or increase in target, strong positive or negative effect)
calculation (he said we don't need to calculate lol) = (# target w interactor - # target w/out interactor)/(# target w interactor + # target w/out interactor)
foundation species
large, abundant species with strong, community-wise effects as habitat or food providers (also good competitors, think trees)
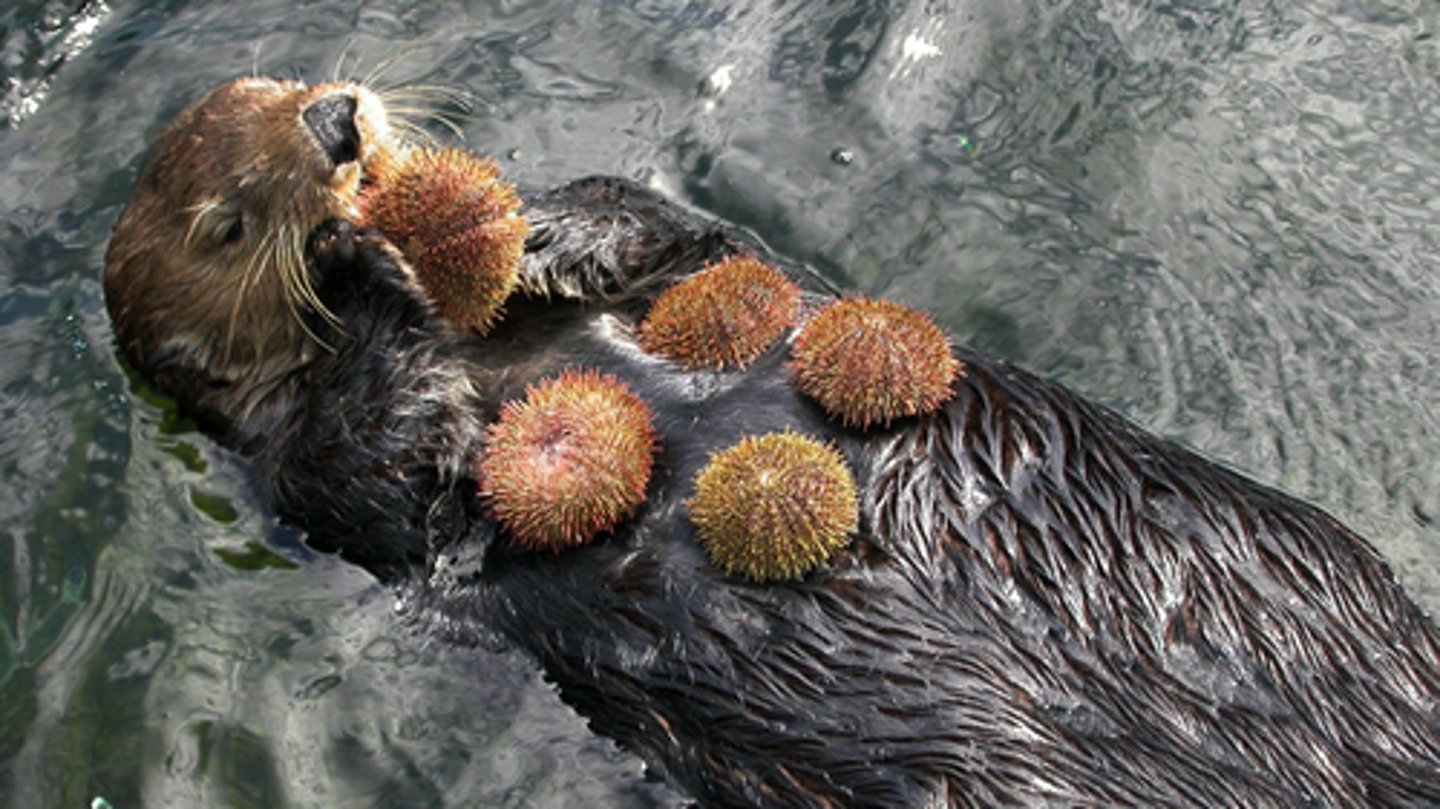
keystone species
greatly albeit indirectly influences community structure (often via trophic relationships)
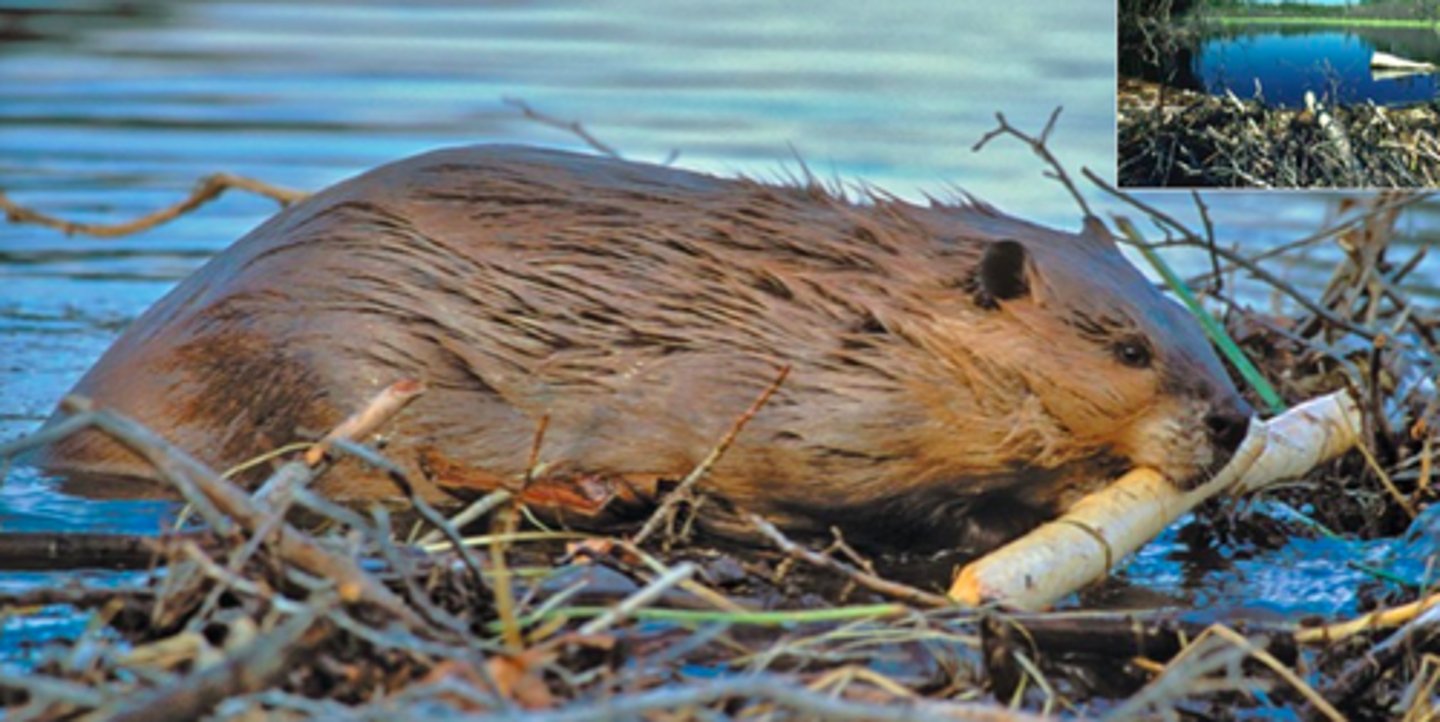
ecosystem engineers
modifies, creates, destroys habitats; indirectly modulates availability of resources for other species
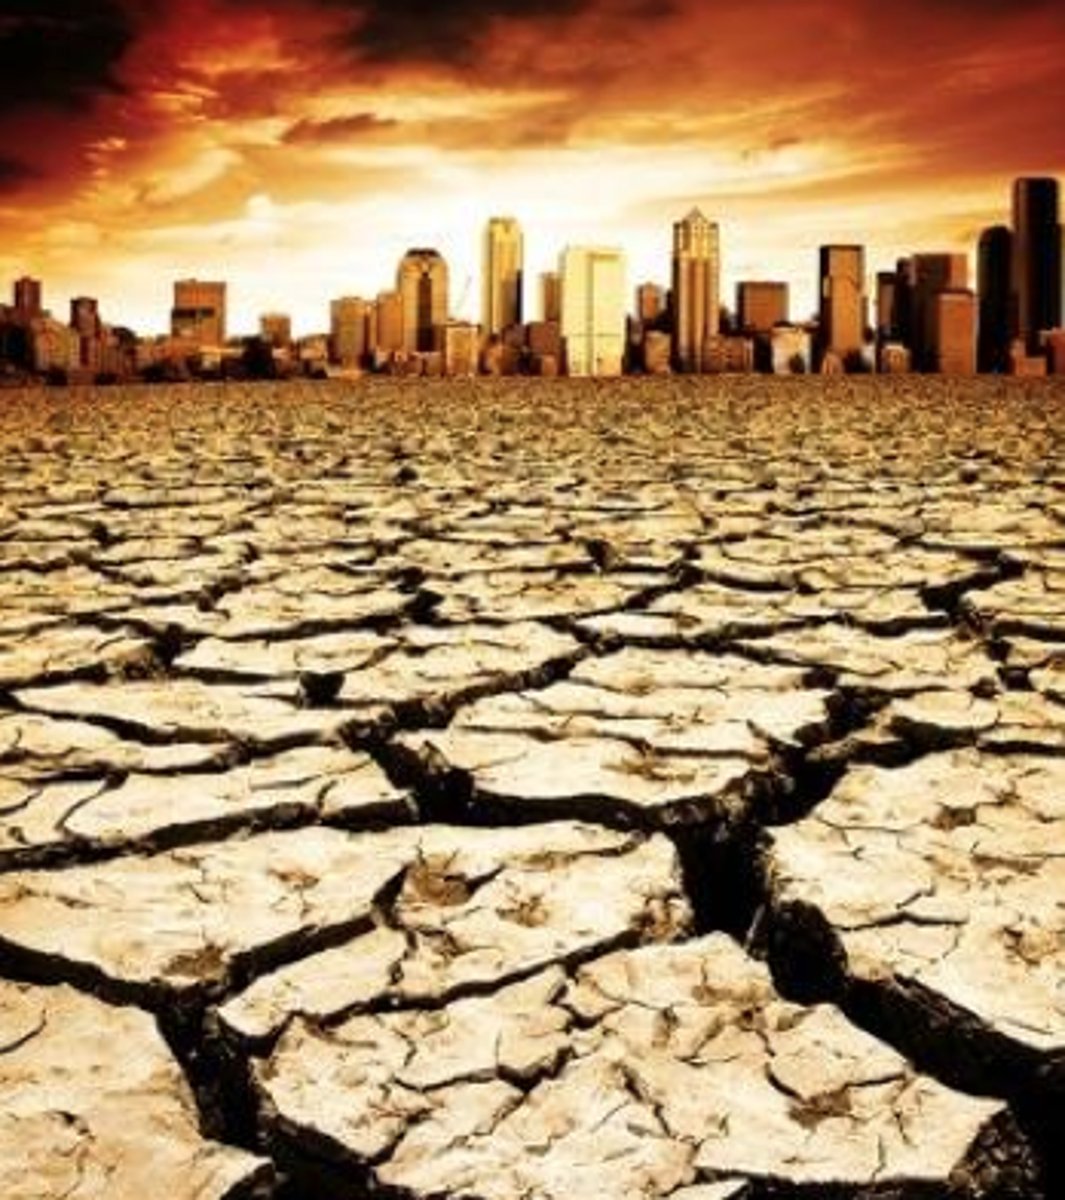
environmental change
affects species interactions by increasing and decreasing abundance of certain species
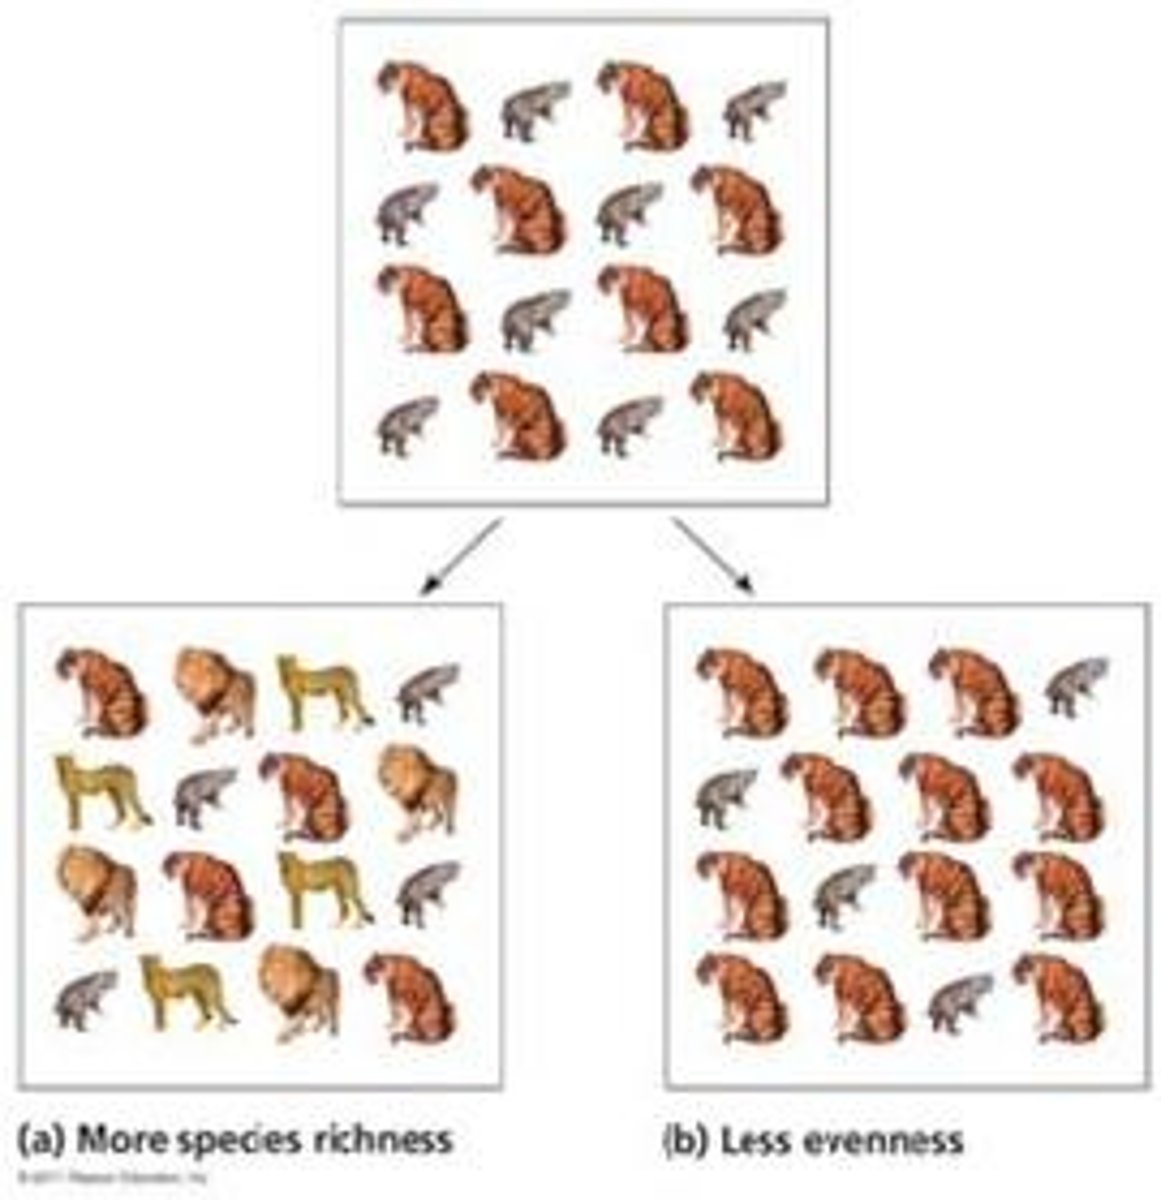
species richness vs evenness
richness # of different species, evenness balanced relative abundance of each species
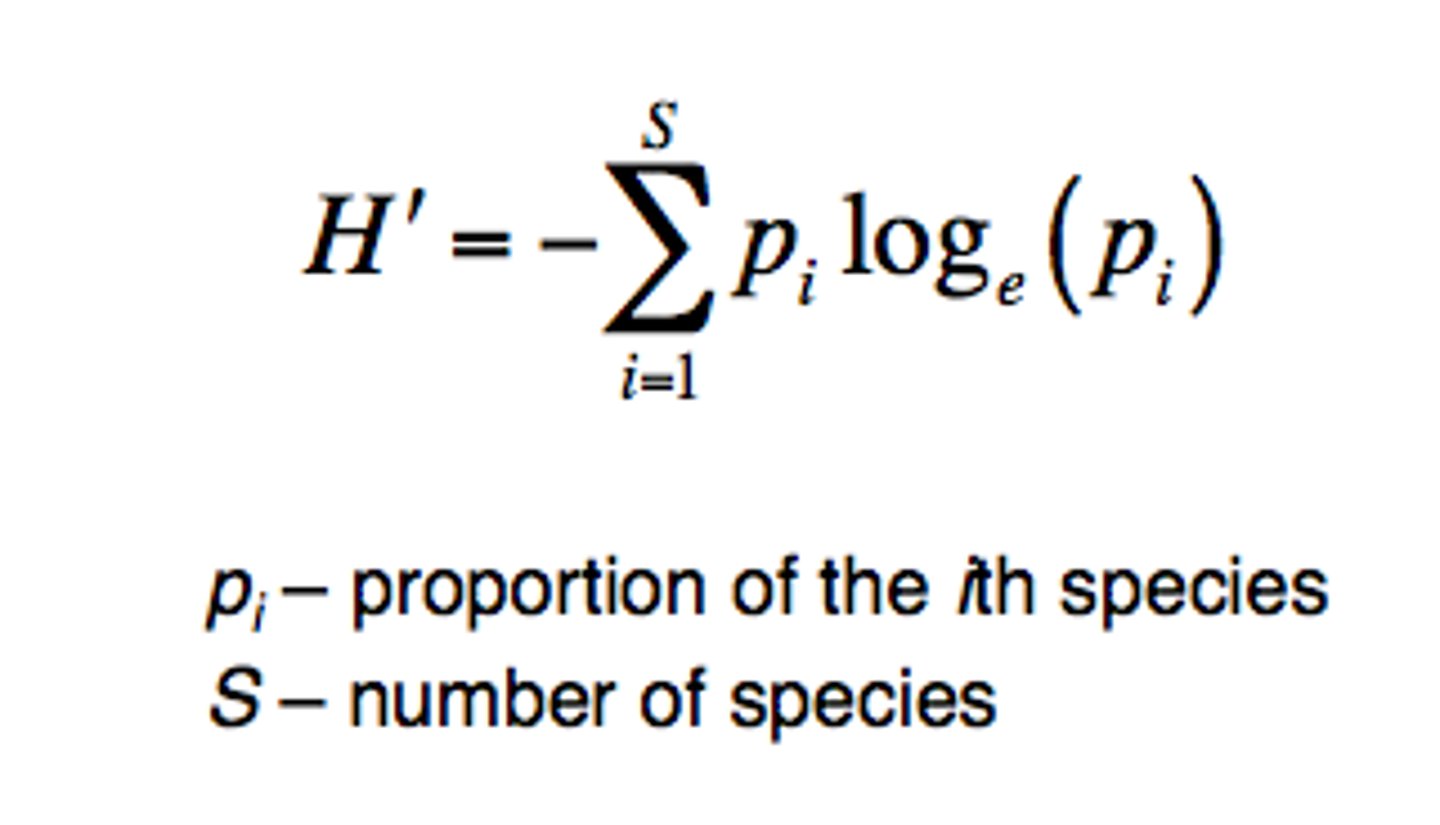
Shannon Index
measure of species diversity (kinda just taking proportions of each species within a community, higher values mean higher diversity) (rank abundance curve plots species abundance, grouped by community, and therefore richness and evenness too...species accumulation curves are a function of this and can simplify)
biotic agents of change
living; species interactions resulting in replacements, diseases, ecosystem engineers/keystone species
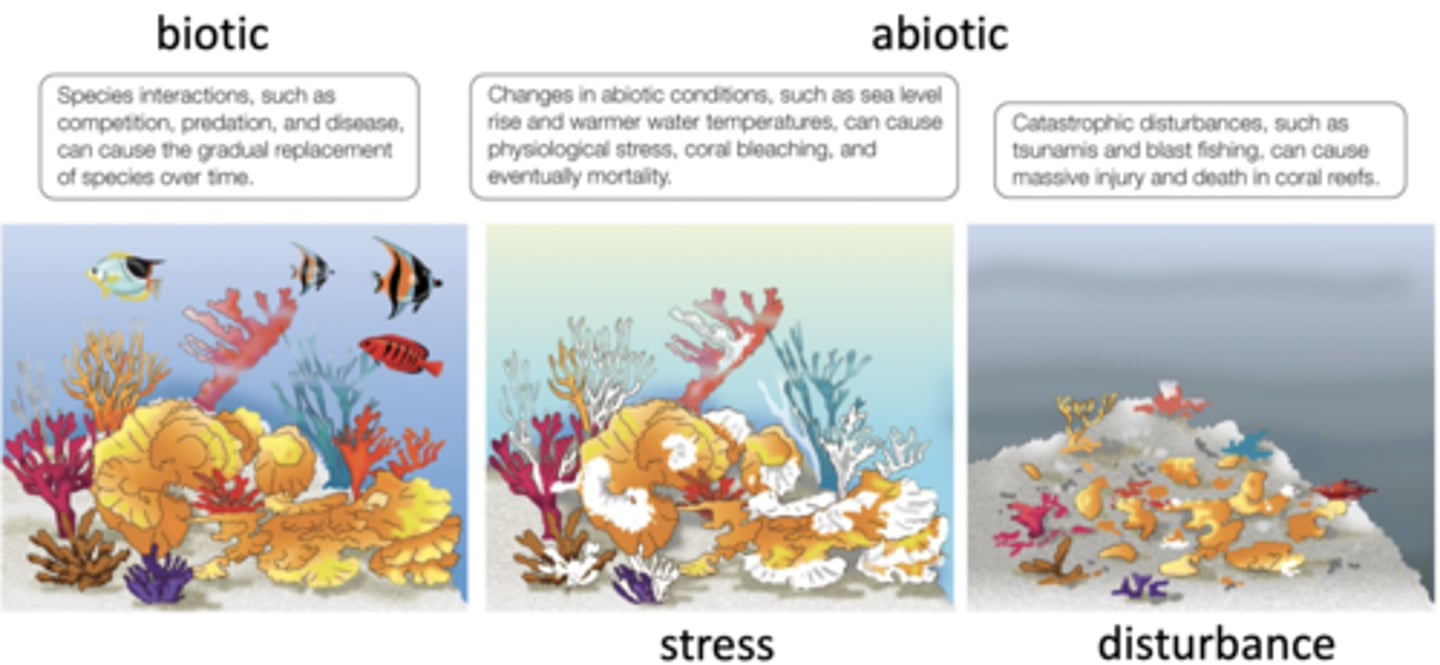
abiotic agents of change
nonliving; tend to vary over longer time scales, either disturbance (catastrophic events that injure/kill some and create opportunities for others) or stress (factors that reduce growth, reproduction, survival)

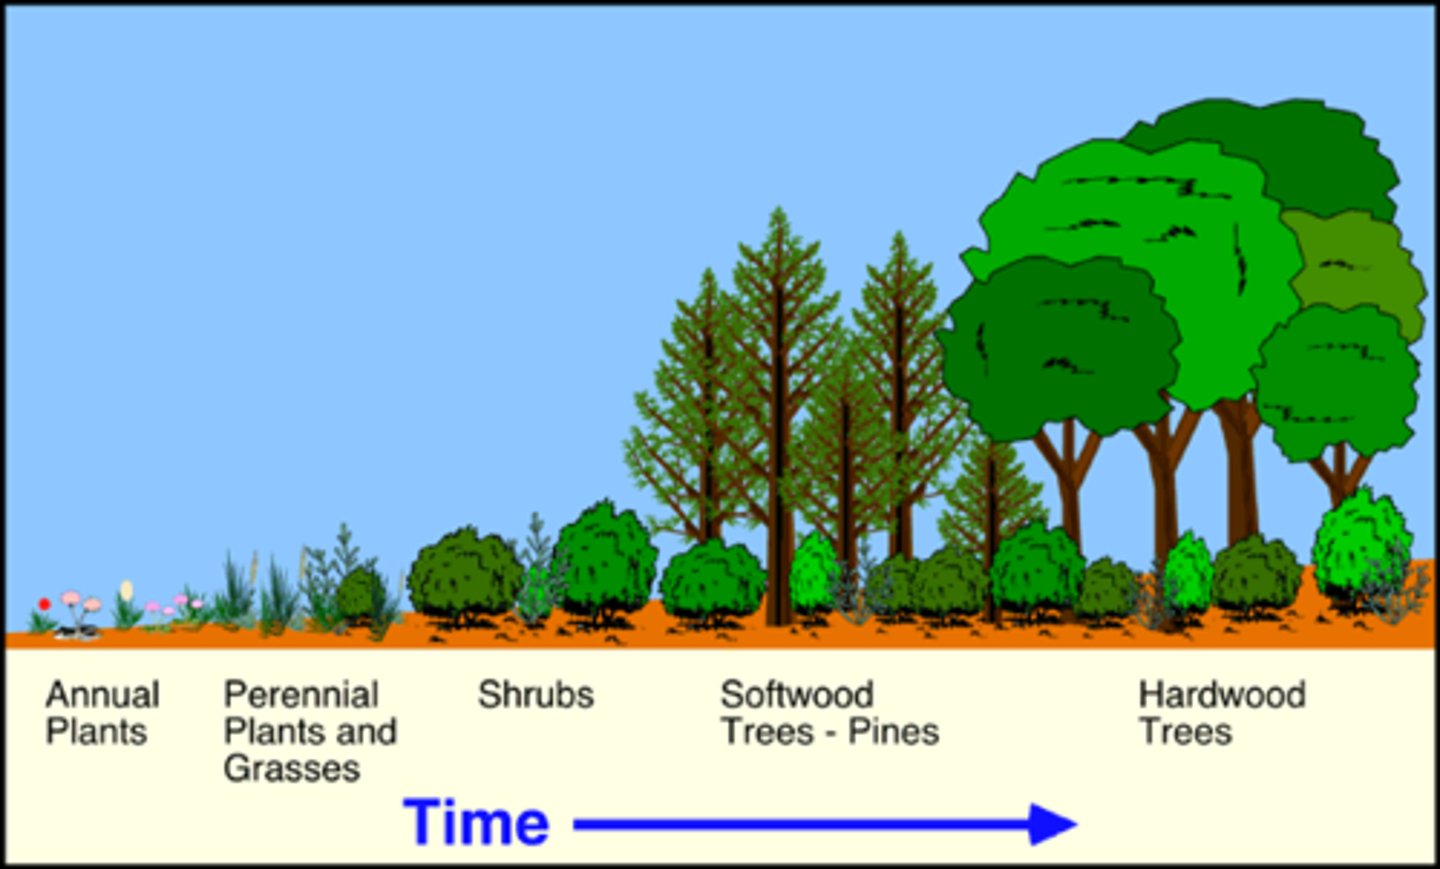
succession
change in species composition over time, from both biotic and abiotic factors, involving colonization and extinction (in theory a system will progress through primary -> secondary -> stable climax stage)
Clements vs Gleason
Clements: "superorganism" with single stable final state, sucession = predictable, predetermined process
Gleason: communities result of chance and various interacting species requirements, there is no predetermined "end state," but rather fluctuating assemblages of species coexisting
most modern ecologists say Clement's theory doesn't make sense bc ecosystems are always changing

alpha (α) diversity
local scale species diversity (driven by physical conditions and species interactions)
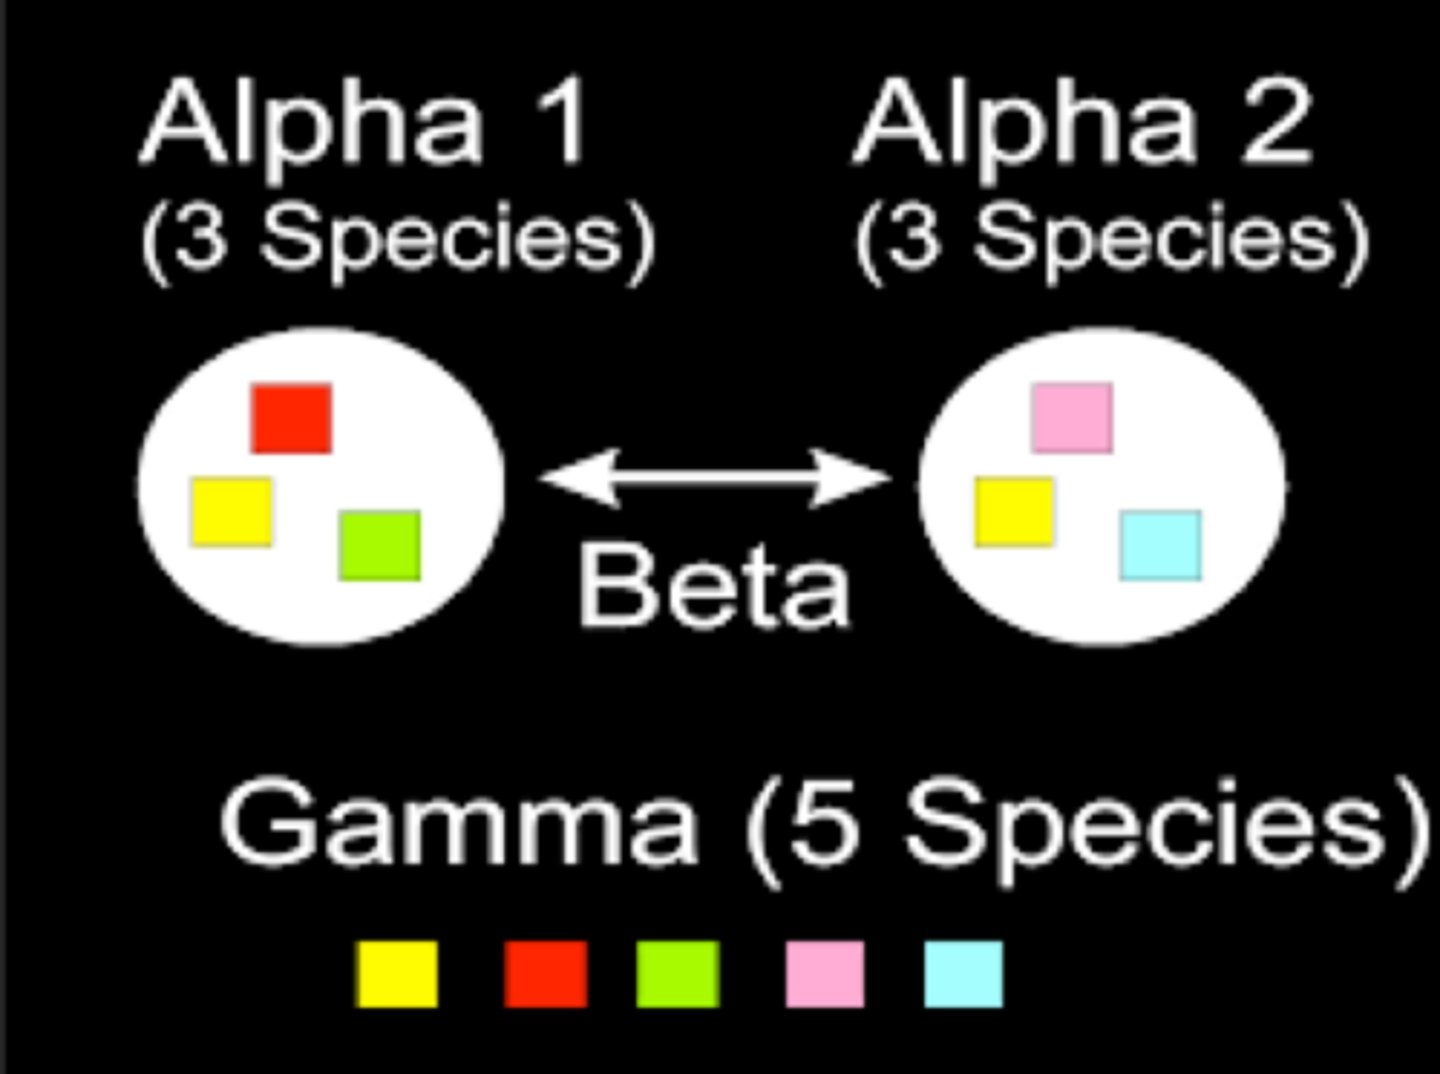
gamma (γ) diversity
regional patterns of species diversity and composition (driven by dispersal across the landscape)
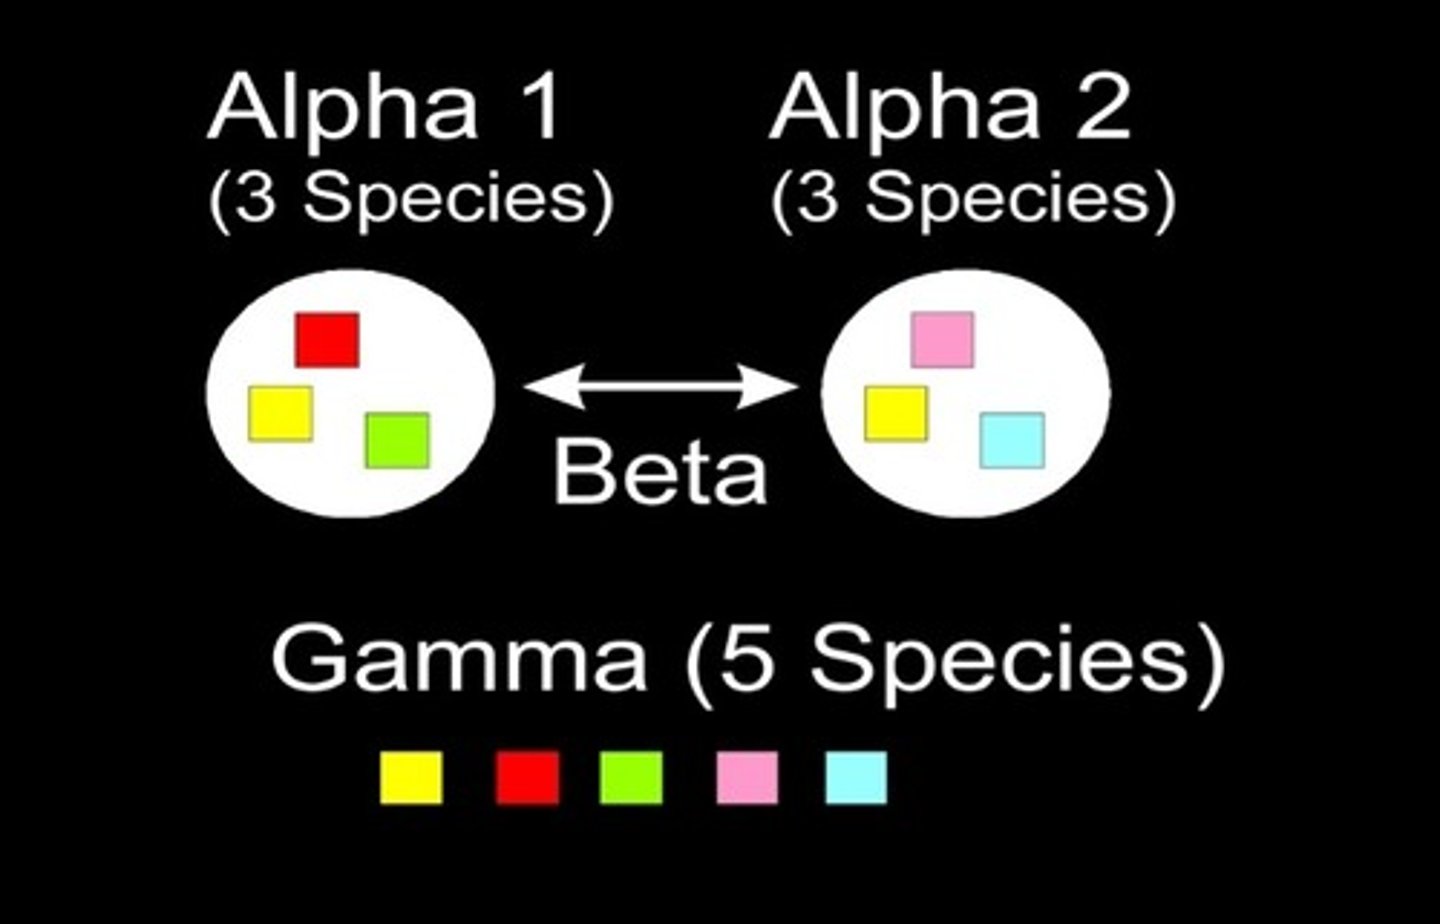
beta (β) diversity
difference in species diversity and composition between local and regional scales (turnover) from one community type to another across the landscape (relationship btw α and γ diversity)

global patterns in Wallace's book (geographical dist. of animals 1978)
#1. land mass can be divided into 6 biogeographic regions corresponding roughly to earth's major tectonic plates
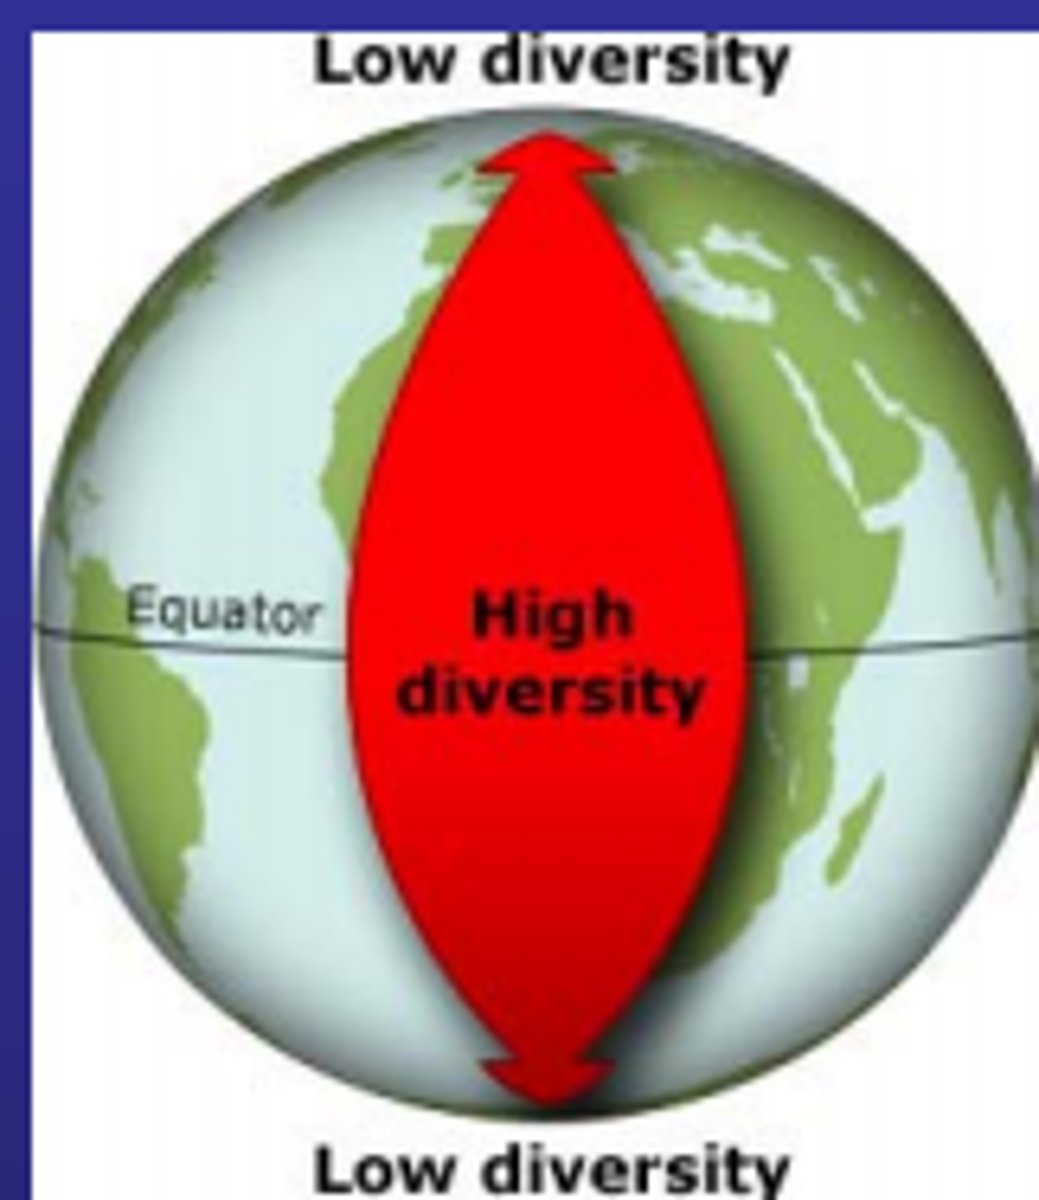
#2. species diversity gradient along changing latitude (high in tropics, low in poles)
latitudinal pattern of species diversity
strong negative relationship between species diversity and latitude (higher latitude = lower diversity, lower latitude = higher diversity) (seabirds are an exception, instead correlating w ocean productivity)
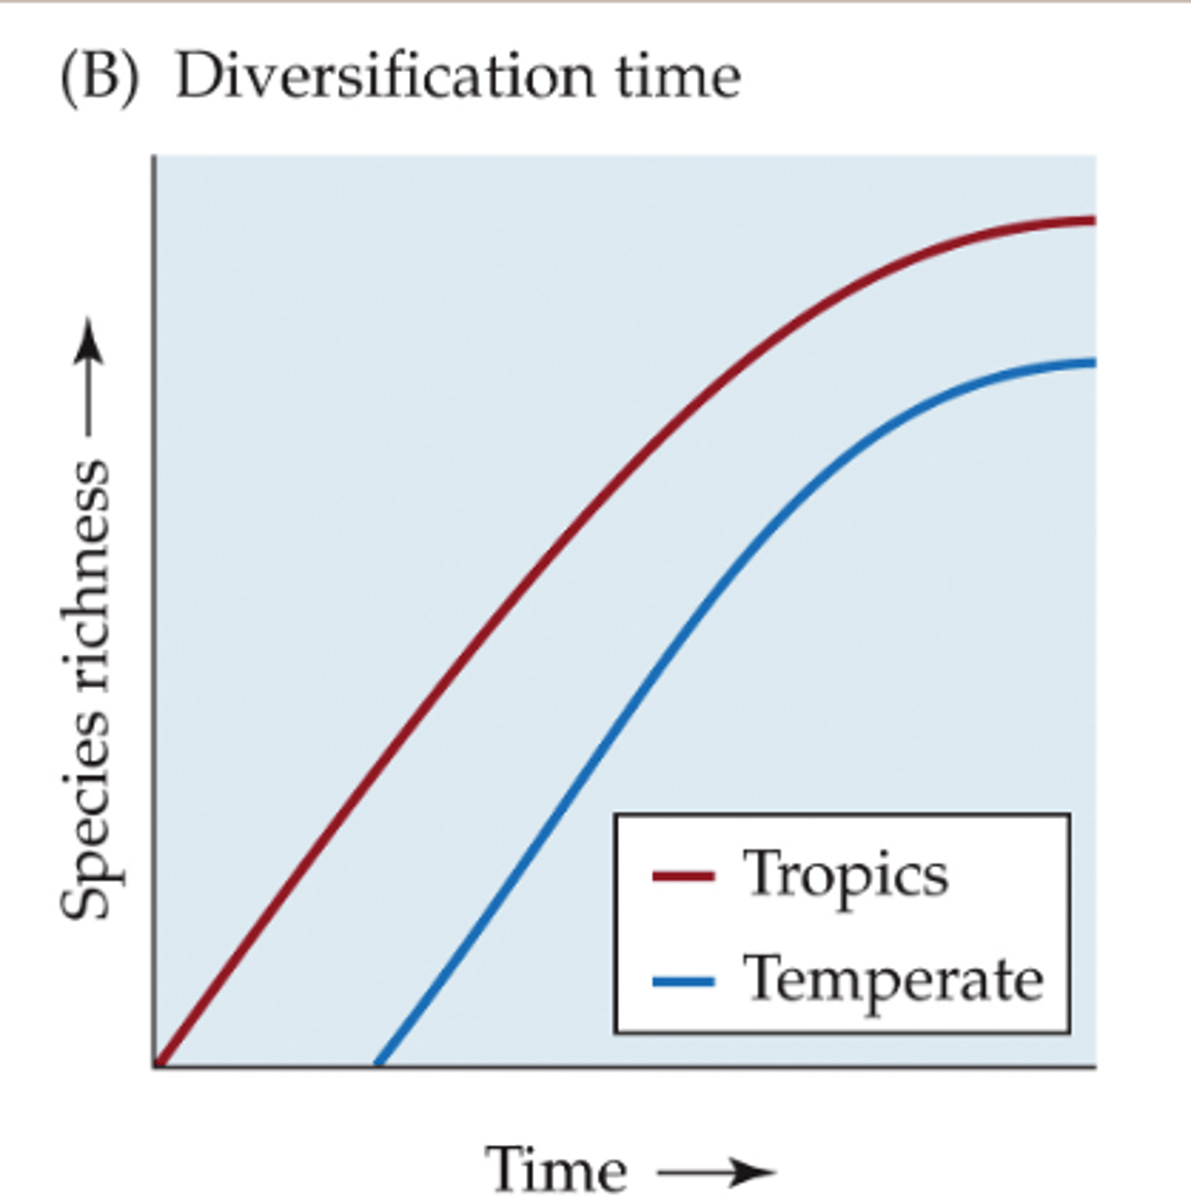
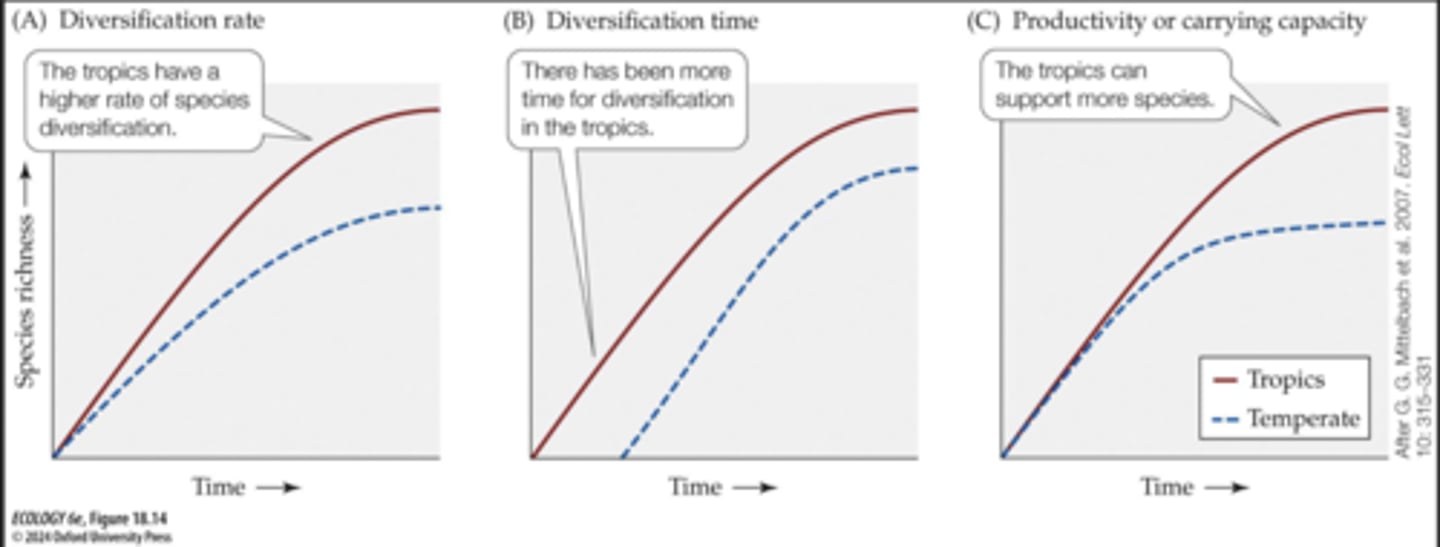
species diversification hypothesis #1
tropics have higher rate of species diversification
- large land masses and stable climates increase speciation, dec. extinction
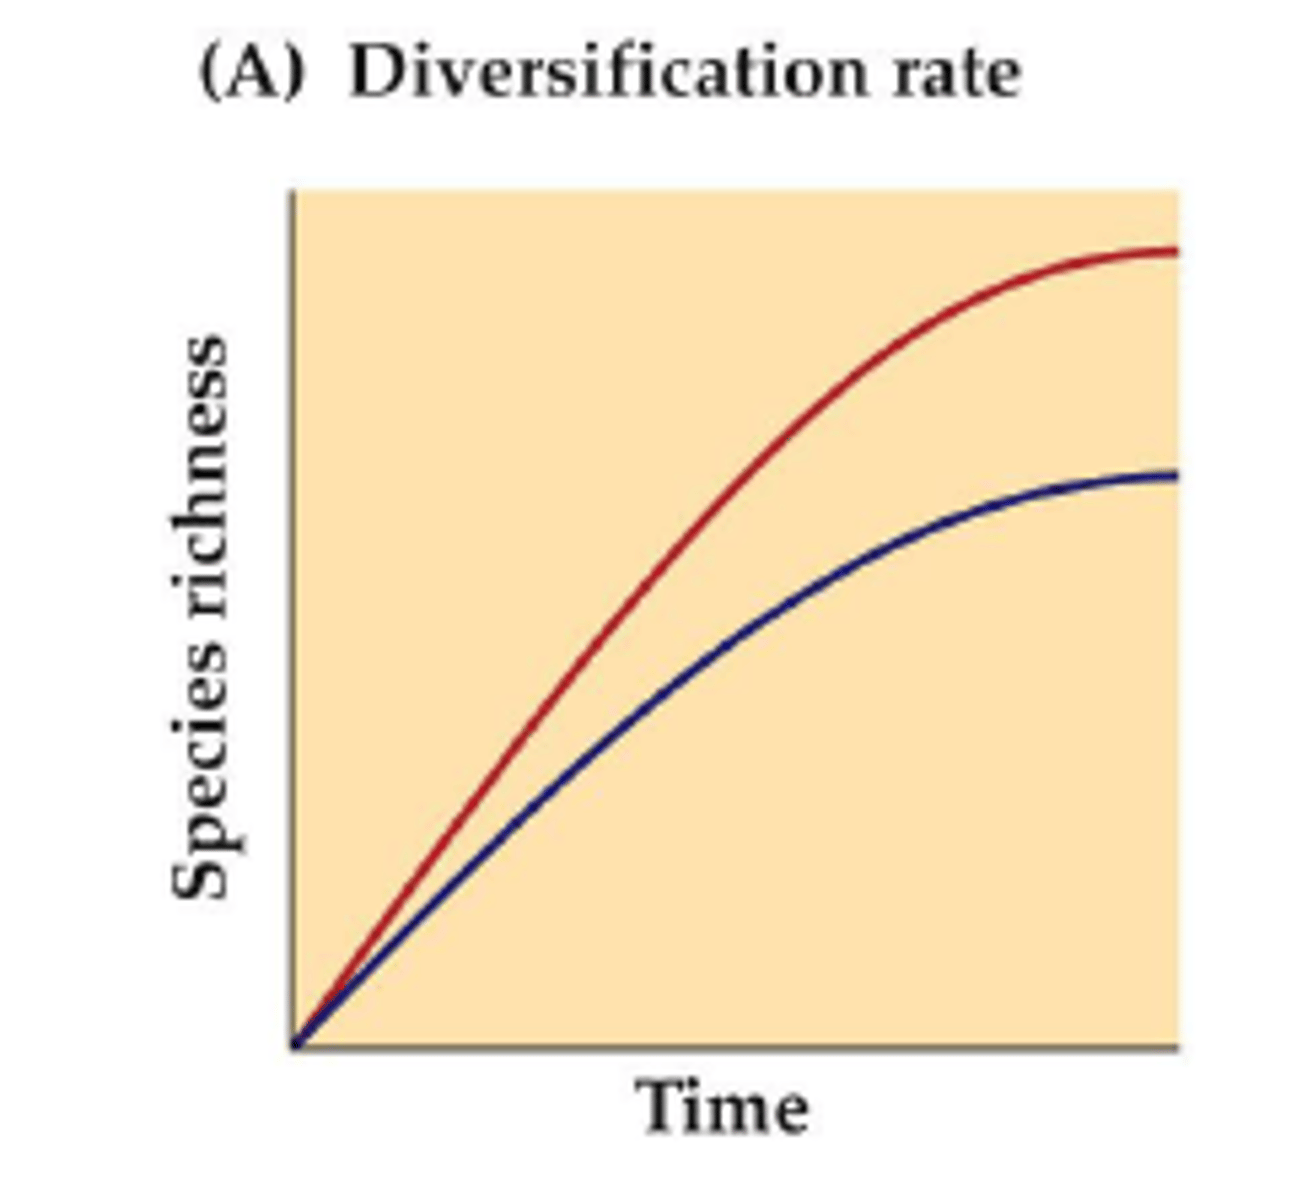
species diversification hypothesis #2
tropics have had more time for diversification
- more climatically stable over time (no glaciation), potentially most species originate their and migrate to poles
species diversification hypothesis #3
tropics have higher productivity/carrying capacity
- lower extinction rates, coexistence, and higher overall richness contribute to higher terrestrial productivity
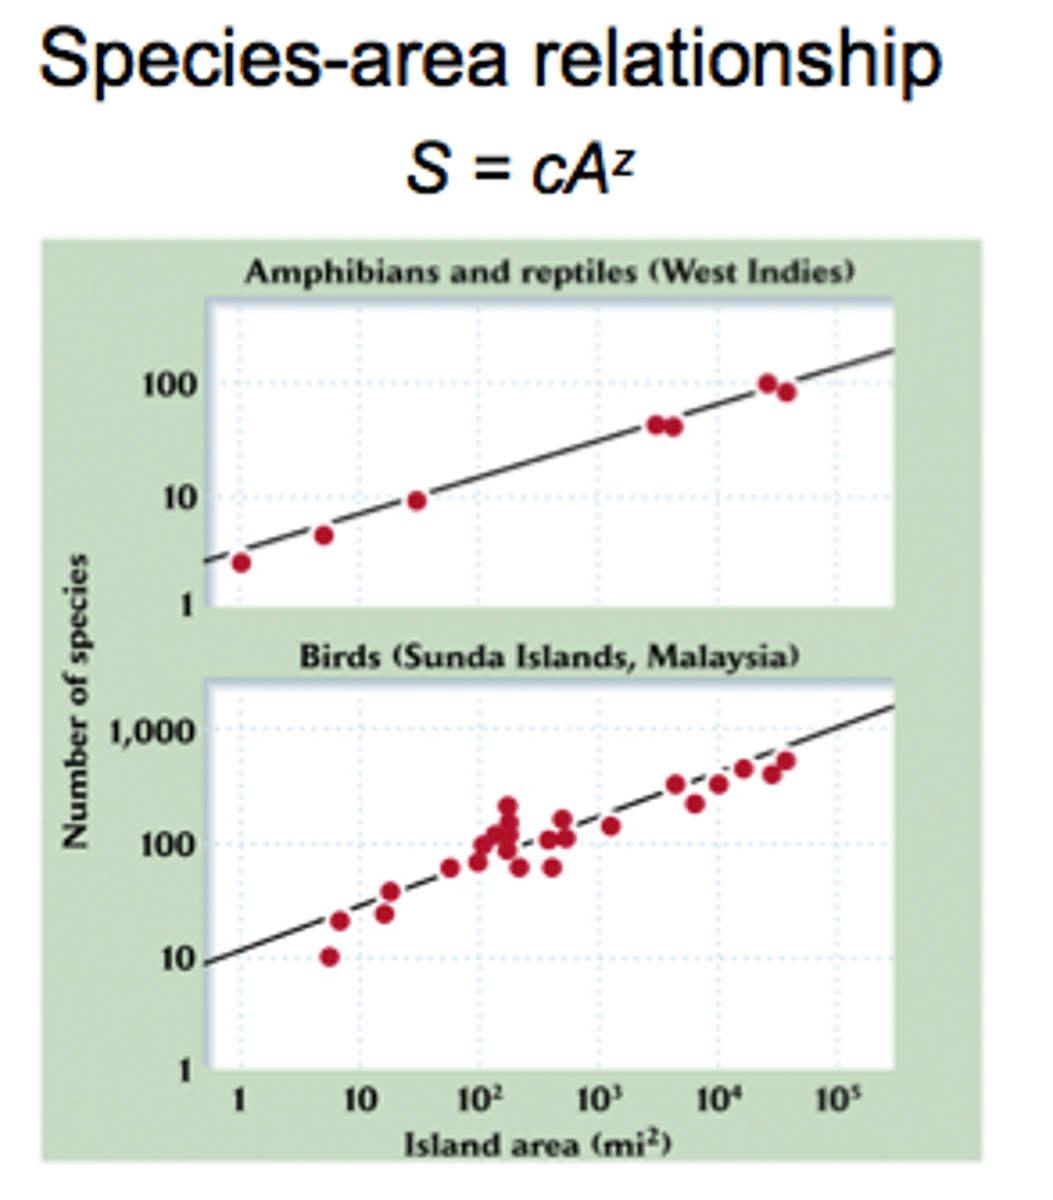
species area relationship
richness inc. with area sampled, S = zA + c which means linear relationship, with steeper slopes indicating a greater difference in species richness among the sampling areas
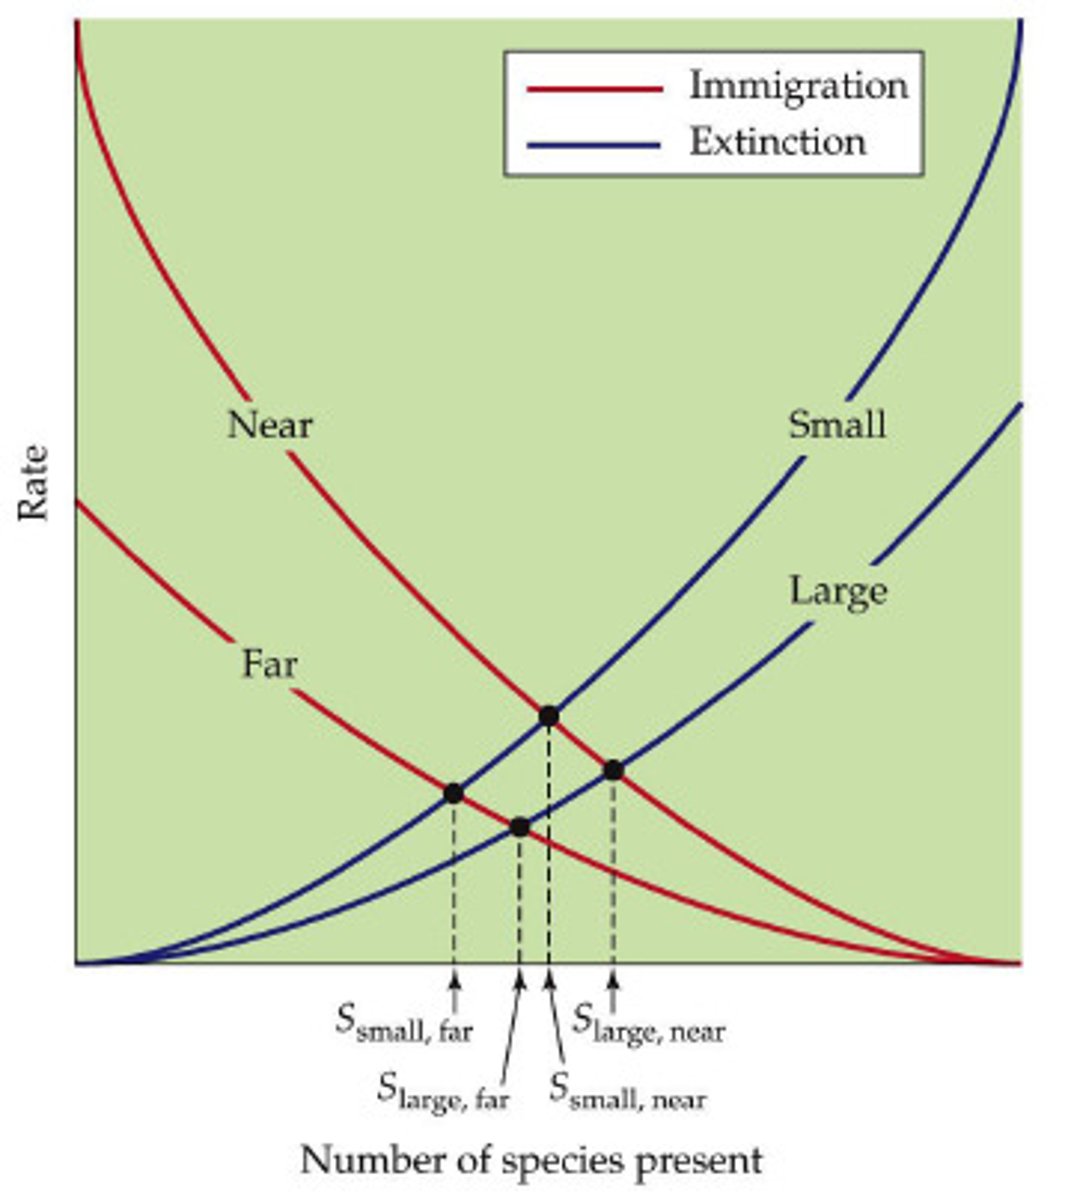
equilibrium theory of island biogeography
the number of species on an island reflects a balance between immigration/dispersal rates and extinction rates
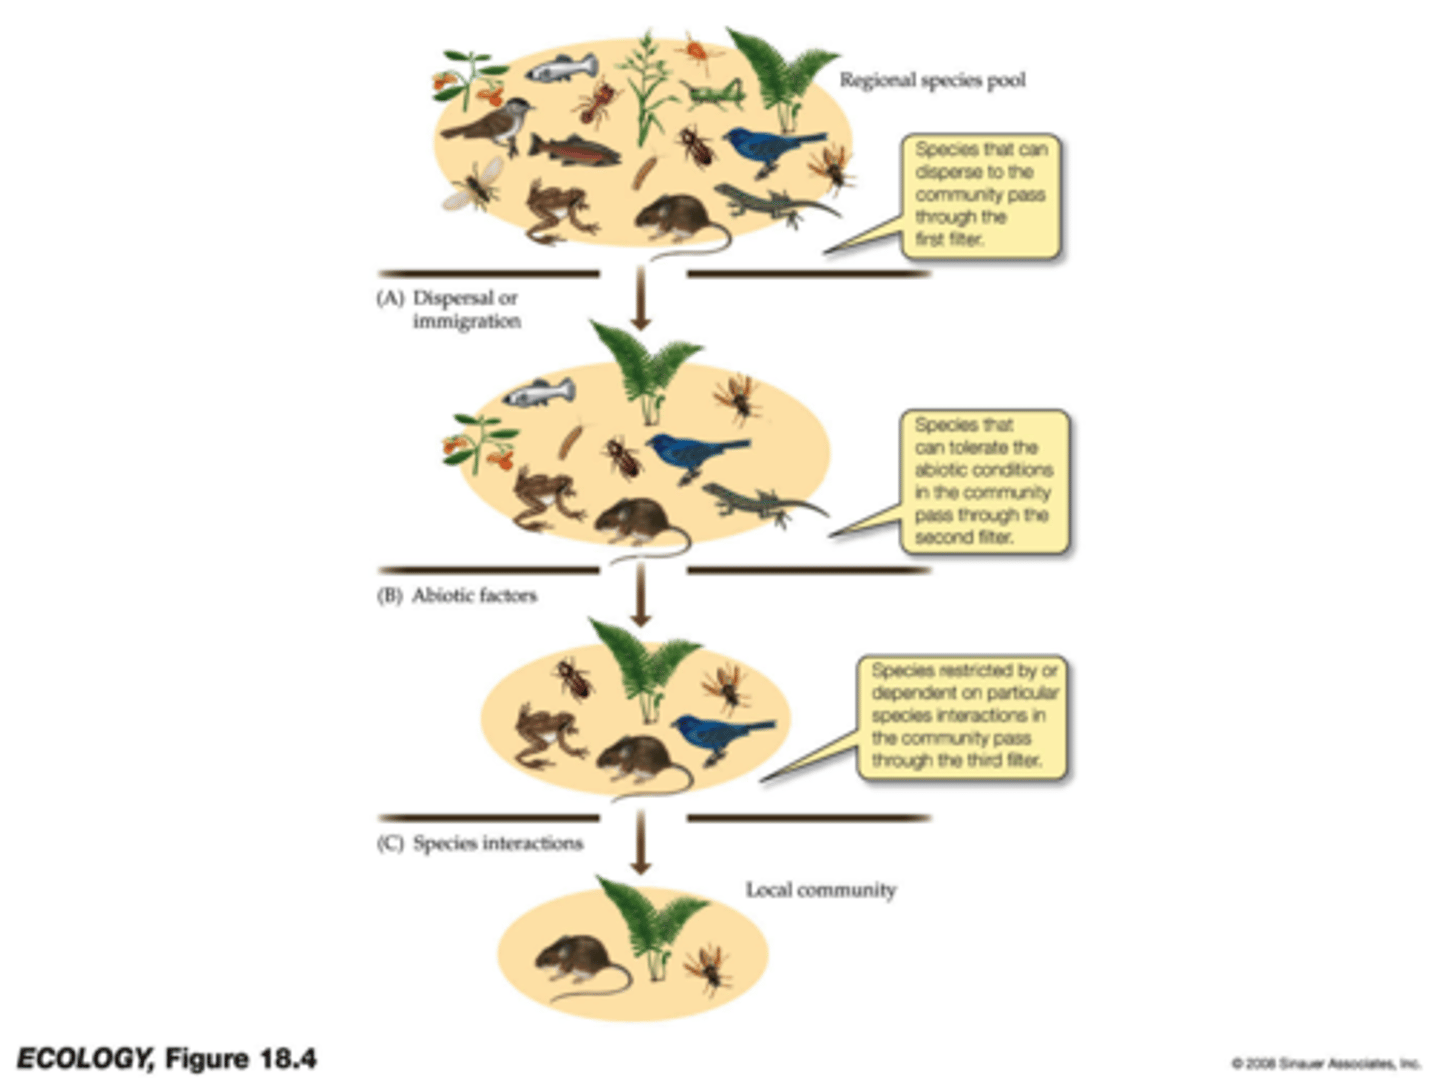
constraints "filters" on local species diversity
dispersal and immigration (limits species supply), environmental conditions (abiotic factors), and species interactions (biotic factors)
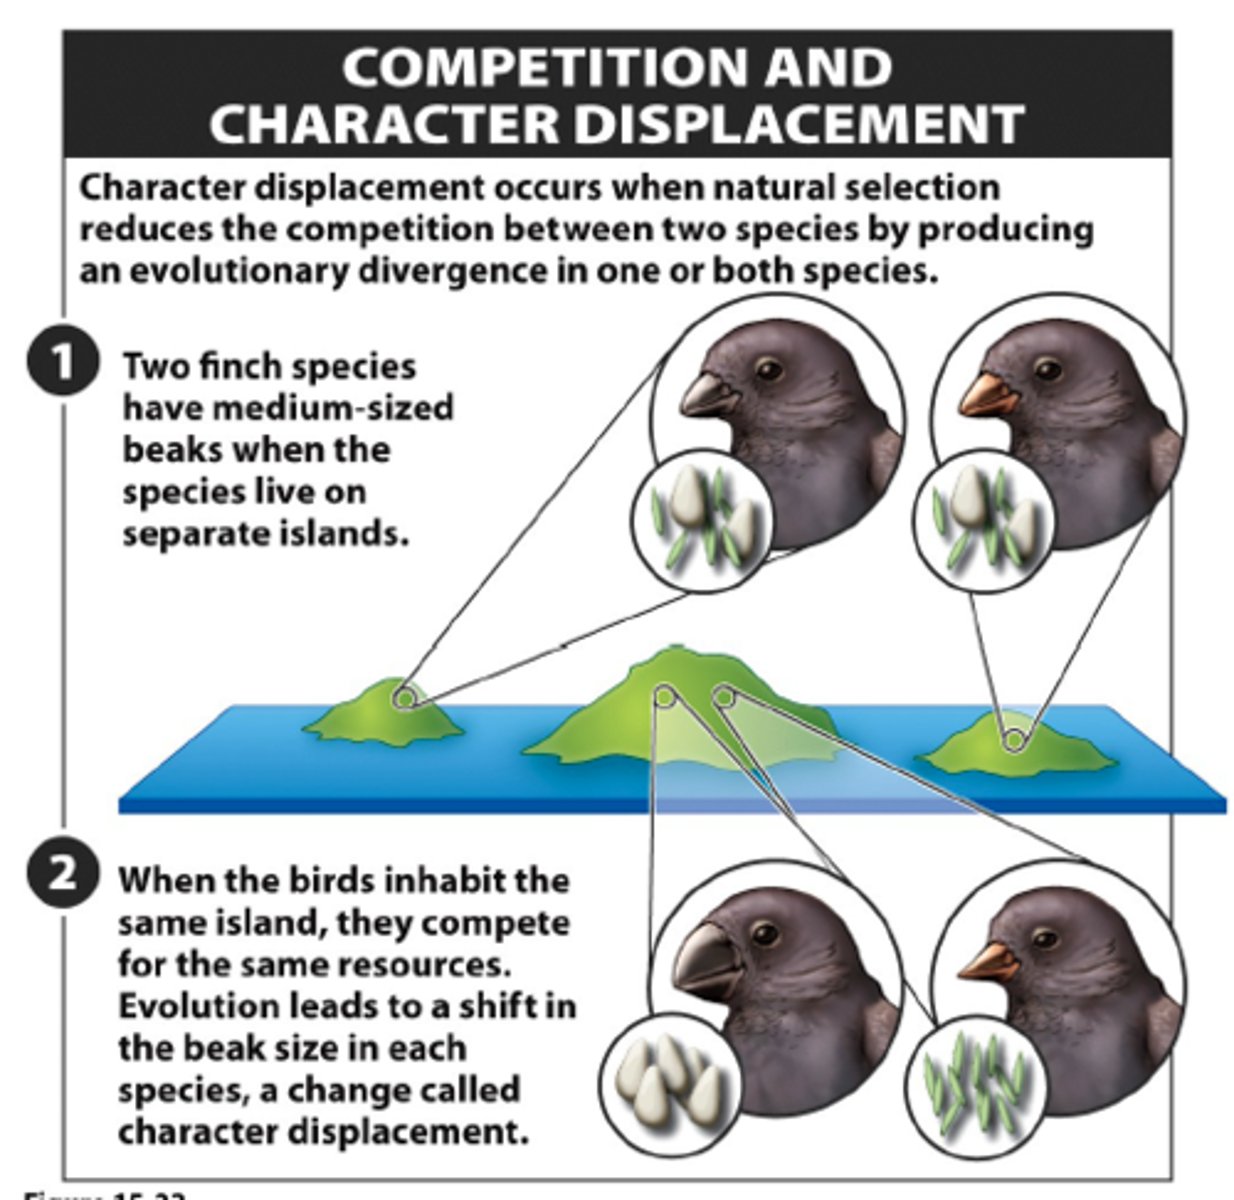
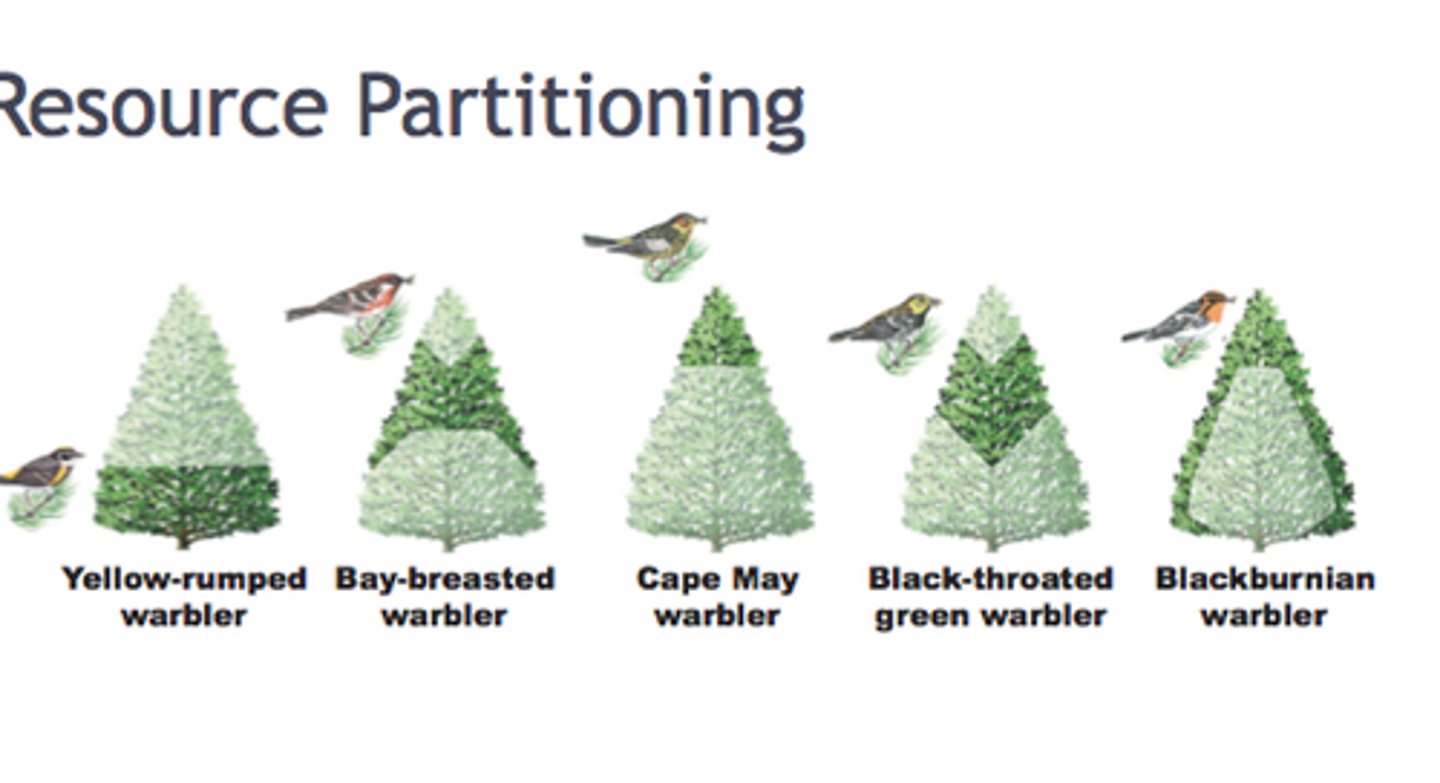
niche theory
niche = fundamental role of species within a community (like resource use, habitat, interactions), partitioning by niche within ecosystems (aka "resource partitioning") drives diversity via character displacement, esp. narrow niches which allow for less overall resource use
MacArthur and bird diversity
looking at NE warblers in 1958, concluded that greater foliage height diversity (complex and multi-layer canopy) meant a greater bird species diversity
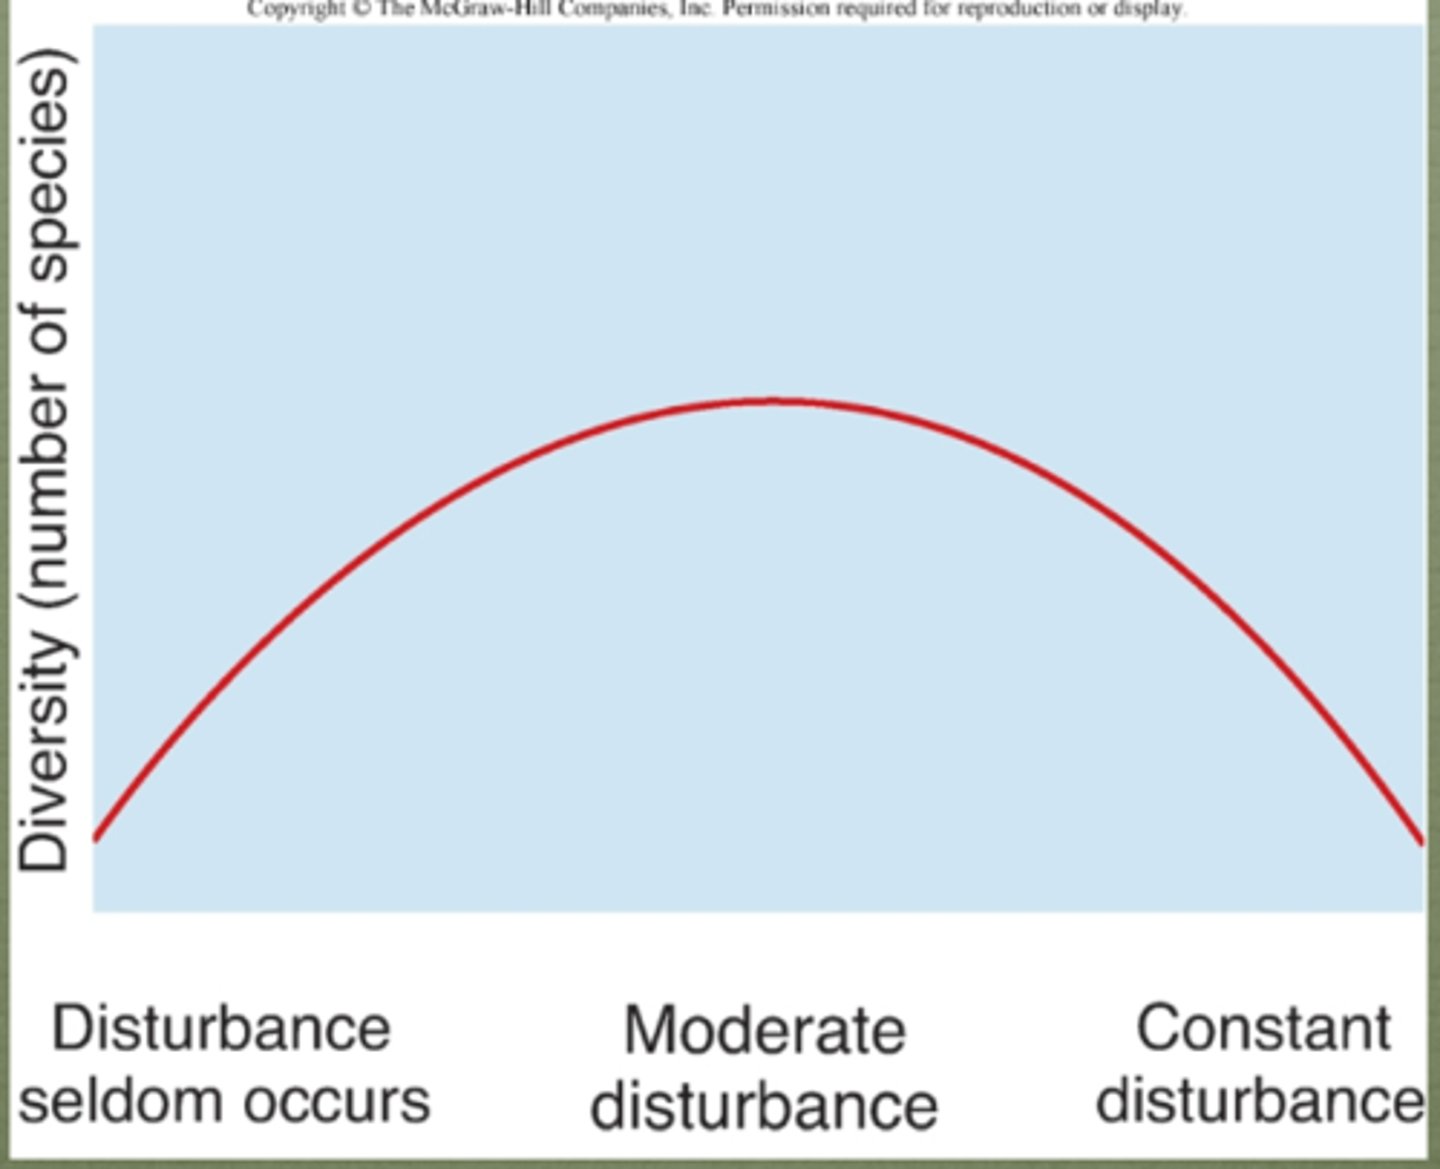
Intermediate Disturbance Theory
species diversity greatest at intermediate levels of disturbance (where there is a balance between disruption of competition-preventing competitive exclusion-and mortality); positive interactions aka "facilitation" btw species enables higher species diversity even in higher disturbance conditions
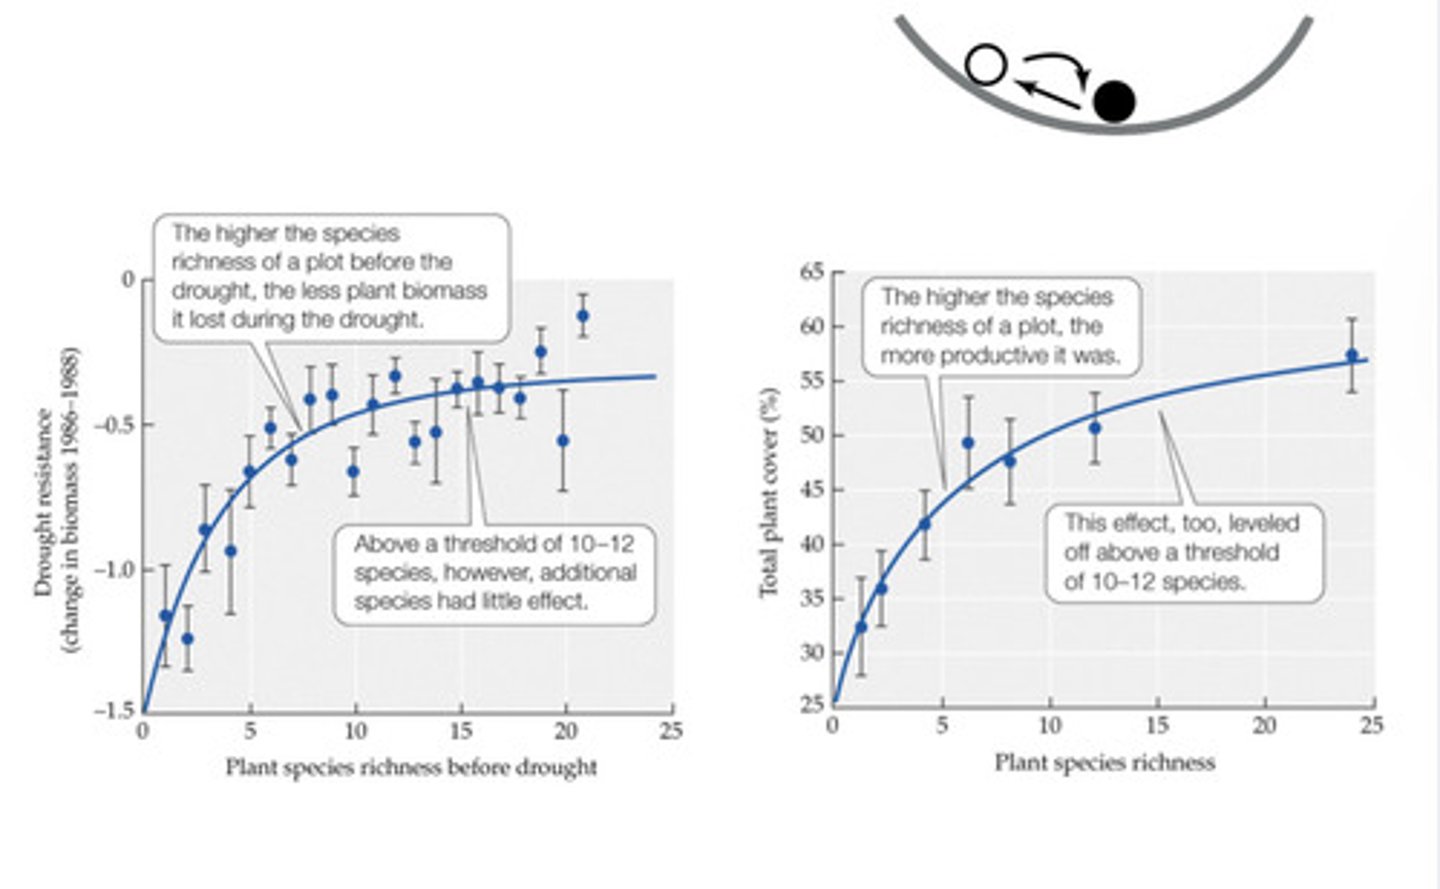
diversity-stability theory
community stability and species diversity positively correlated, more diverse communities tend to withstand imbalance better
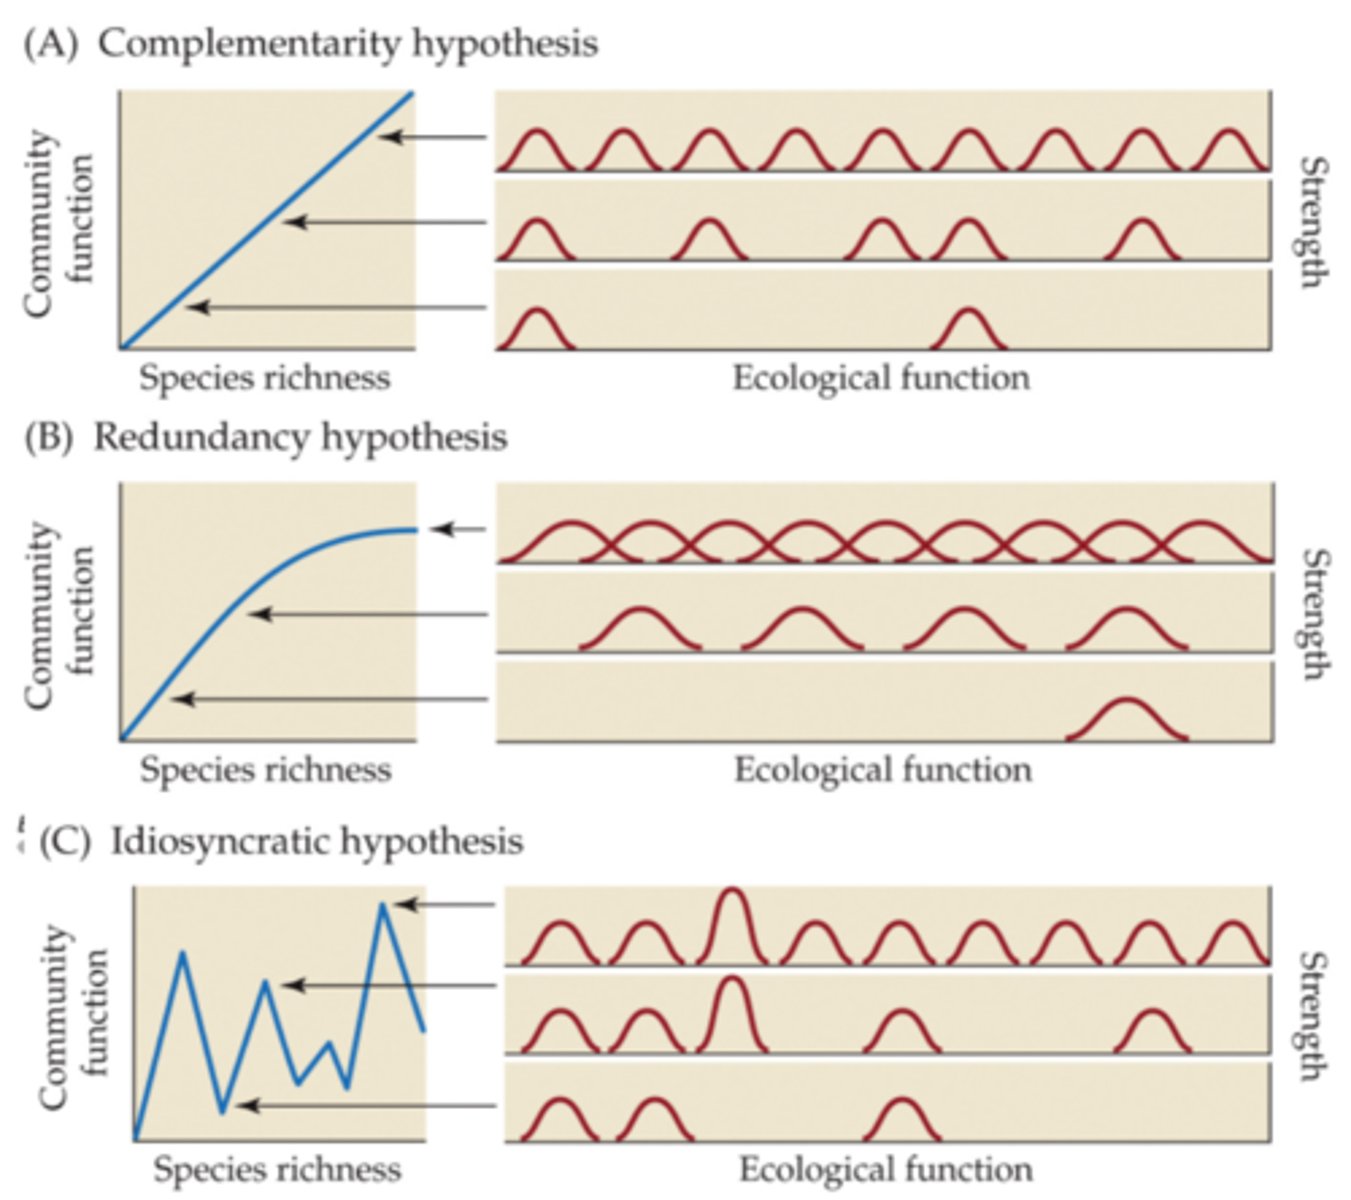
diversity and ecosystem function
complementarity hypothesis - inc. diversity means linear inc. in community function (no limit)
redundancy hypothesis - threshold of community function after a certain point of species addition
idiosyncratic hypothesis - big variety in ecological function such that community function depends heavily on types of species being added
drivers of variability in atmospheric CO2 cycle
terrestrial ecosystems✴️, photosynthesis, respiration
GPP
gross primary productivity: total amount of C fixed by autotrophs, often equated to photosynthesis at ecosystem scale (largest CO2 flux on Earth, ~11x fossil fuel combustion each year!)
GPP = NPP + Ra
GPPP = NEE + Ra + Rh
direct controls: leaf area, N, season length (higher leaf area, higher N, longer growing season -> higher GPP)
indirect controls: environmental drivers like temp, precip., CO2, light

NPP
net primary productivity: net carbon gain by plants (nrg left over for plant growth and consumption by detrivores and herbivores), over time will dec. as respiration inc., varies with succession stages (peaks in intermediate stages, can dec. significantly in late states)
driven by: climate (ex. length of growing season), nutrient (esp. N) availability
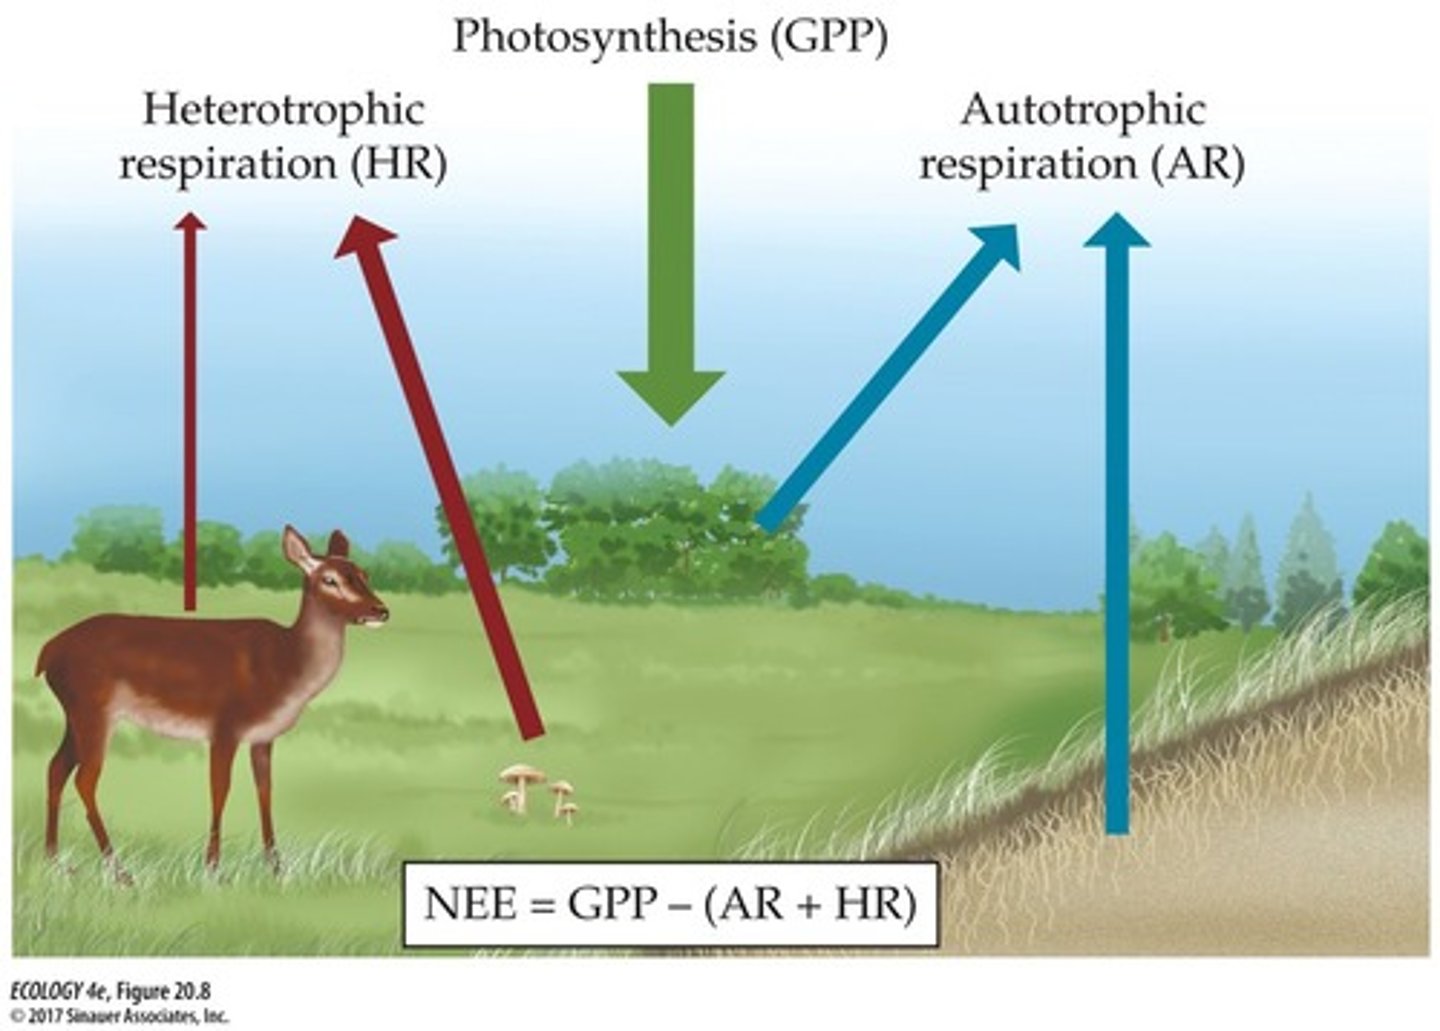
NEE
net ecosystem exchange: net carbon gain or loss by entire ecosystem
NEE = NPP - Rh
NEE = GPP - (Rh + Ra)
Ra
autotrophic respiration, uses up ~1/2 of C fixed in photosynthesis, result of maintenance or growth in plants (inc. rate with more nonphotosynthetic tissue and inc. temp)
Rh
heterotrophic respiration
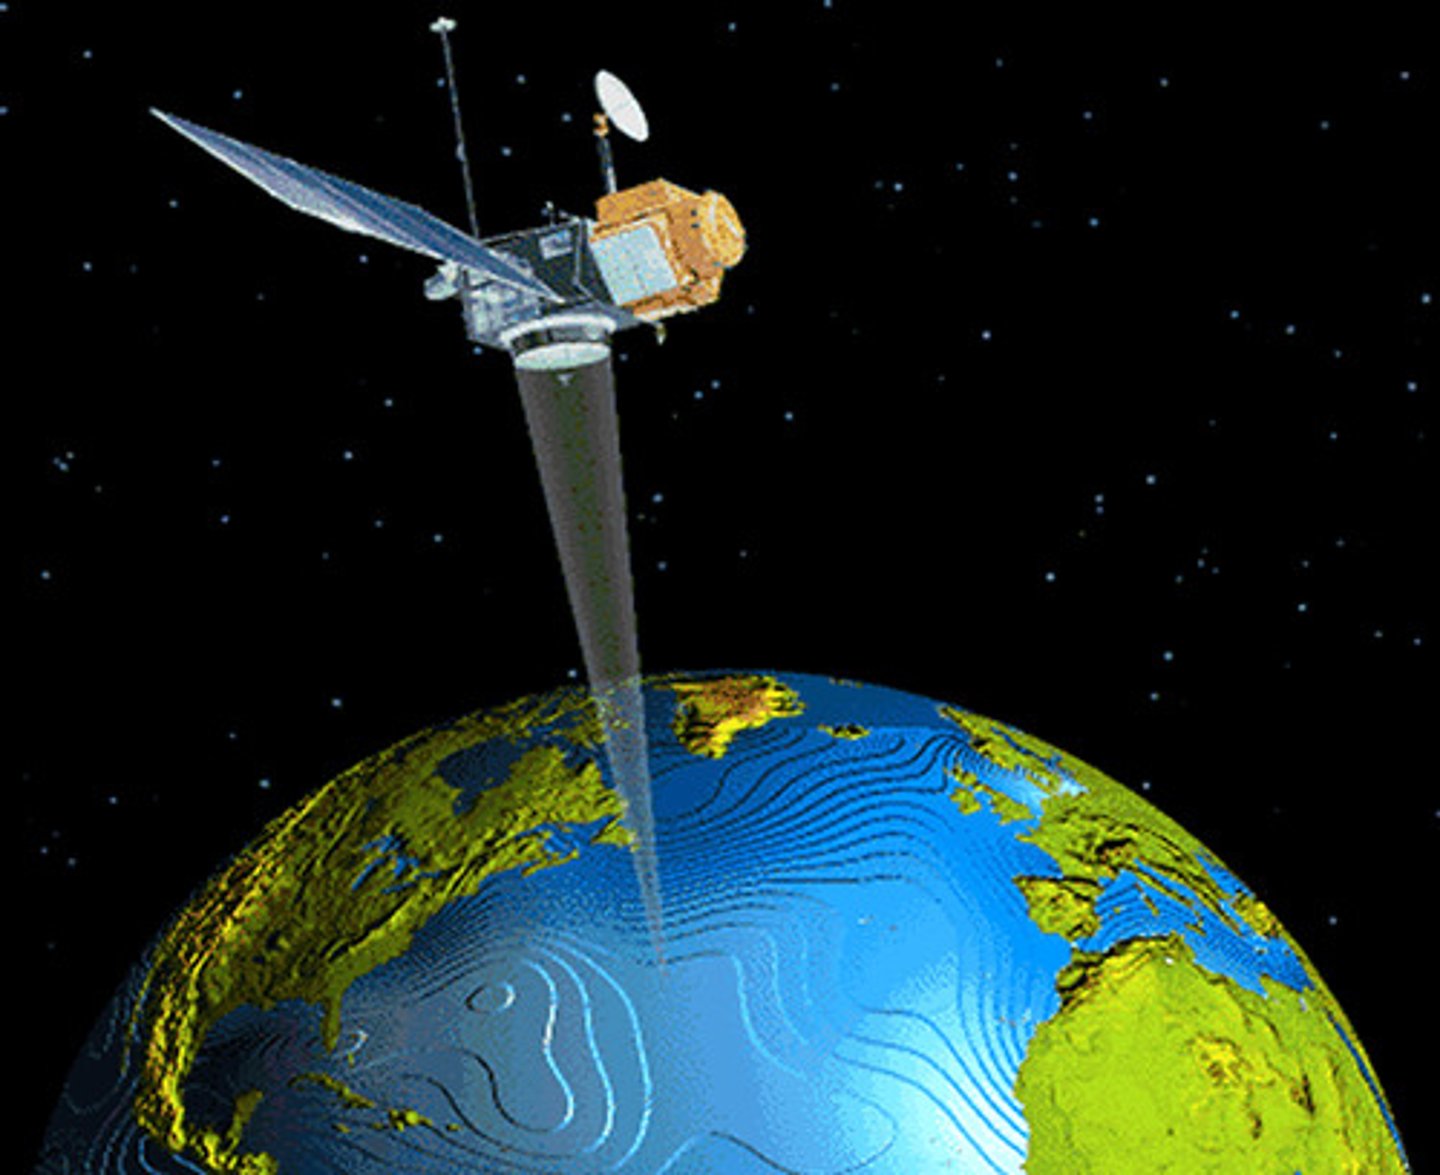
remote sensing
measures properties without physically touching the object (ex. scanning for reflection of solar radiation to assess chlorophyll conc. as proxy for GPP and NPP)
measuring aboveground NPP
in terrestrial ecosystems can be done during growing seasons; easy for grass or crops (just harvest everything), challenging for forests (much NPP contained belowground, aboveground estimates of leaf/stem/branch content used)
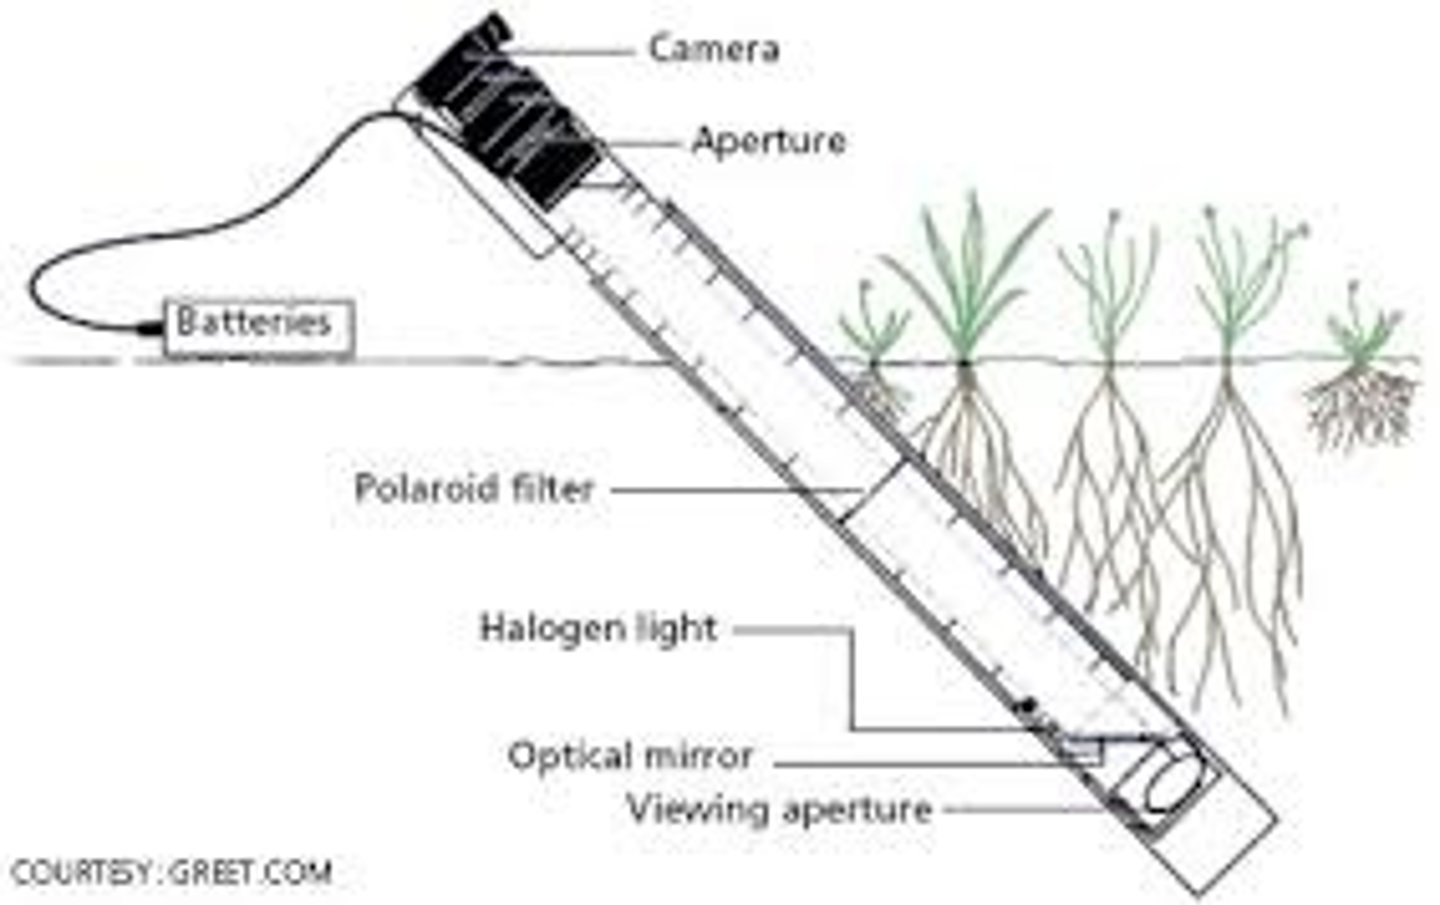
minirhizotron
films root growth
NEE measurement
to get NEE (net CO2 flux btw atmo. and ecosystem), Eddy Covariance method used by measuring [CO2] + wind direction + wind speed at high frequency, then GPP and ecosystem respiration can be partitioned by day and night data (no GPP factored in at night since there's no sun for photosynthesis!)
![<p>to get NEE (net CO2 flux btw atmo. and ecosystem), Eddy Covariance method used by measuring [CO2] + wind direction + wind speed at high frequency, then GPP and ecosystem respiration can be partitioned by day and night data (no GPP factored in at night since there's no sun for photosynthesis!)</p>](https://knowt-user-attachments.s3.amazonaws.com/aa09d254-c87f-4934-a591-42fd6878a3a1.jpg)