Mundell-Flemming model
1/12
There's no tags or description
Looks like no tags are added yet.
Name | Mastery | Learn | Test | Matching | Spaced | Call with Kai |
|---|
No analytics yet
Send a link to your students to track their progress
13 Terms
Assumptions
Small open economy
Static model
Fixed Price
Demand for domestic goods equation
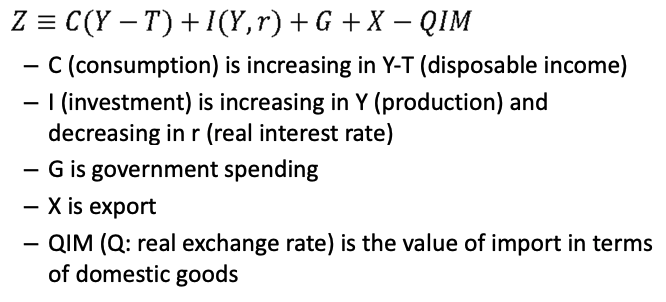
Net exports (NX) equation
3 channels Real ER (Q) affects NX
Real exchange rate
Q increase → QIM rising → NX falls
Output in H
Depreciation (Q increasing) → X increasing → NX increase
Output in F
Q increases → M fall (QIM (Y, Q) term) → NX increase
Ambiguous effect as channels are both positive & negative
Marshall-Lerner condition
Depreciation of a currency leads to increasing net exports
assume condition satisfied
When is Goods market in equilibrium
when Domestic output = Demand for domestic goods
Y = Z
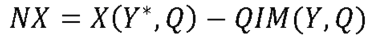
Demand for domestic goods and net exports - graph
DD =/ ZZ → includes F & H goods
ZZ - Demand for dom (H) goods only
M an increasing function of Y so slope becomes flatter (DD -> AA) when taking M out and focusing on H goods
Including X shifts curve up as doesnt depend on Y (AA → ZZ)
NX = 0 when DD = ZZ
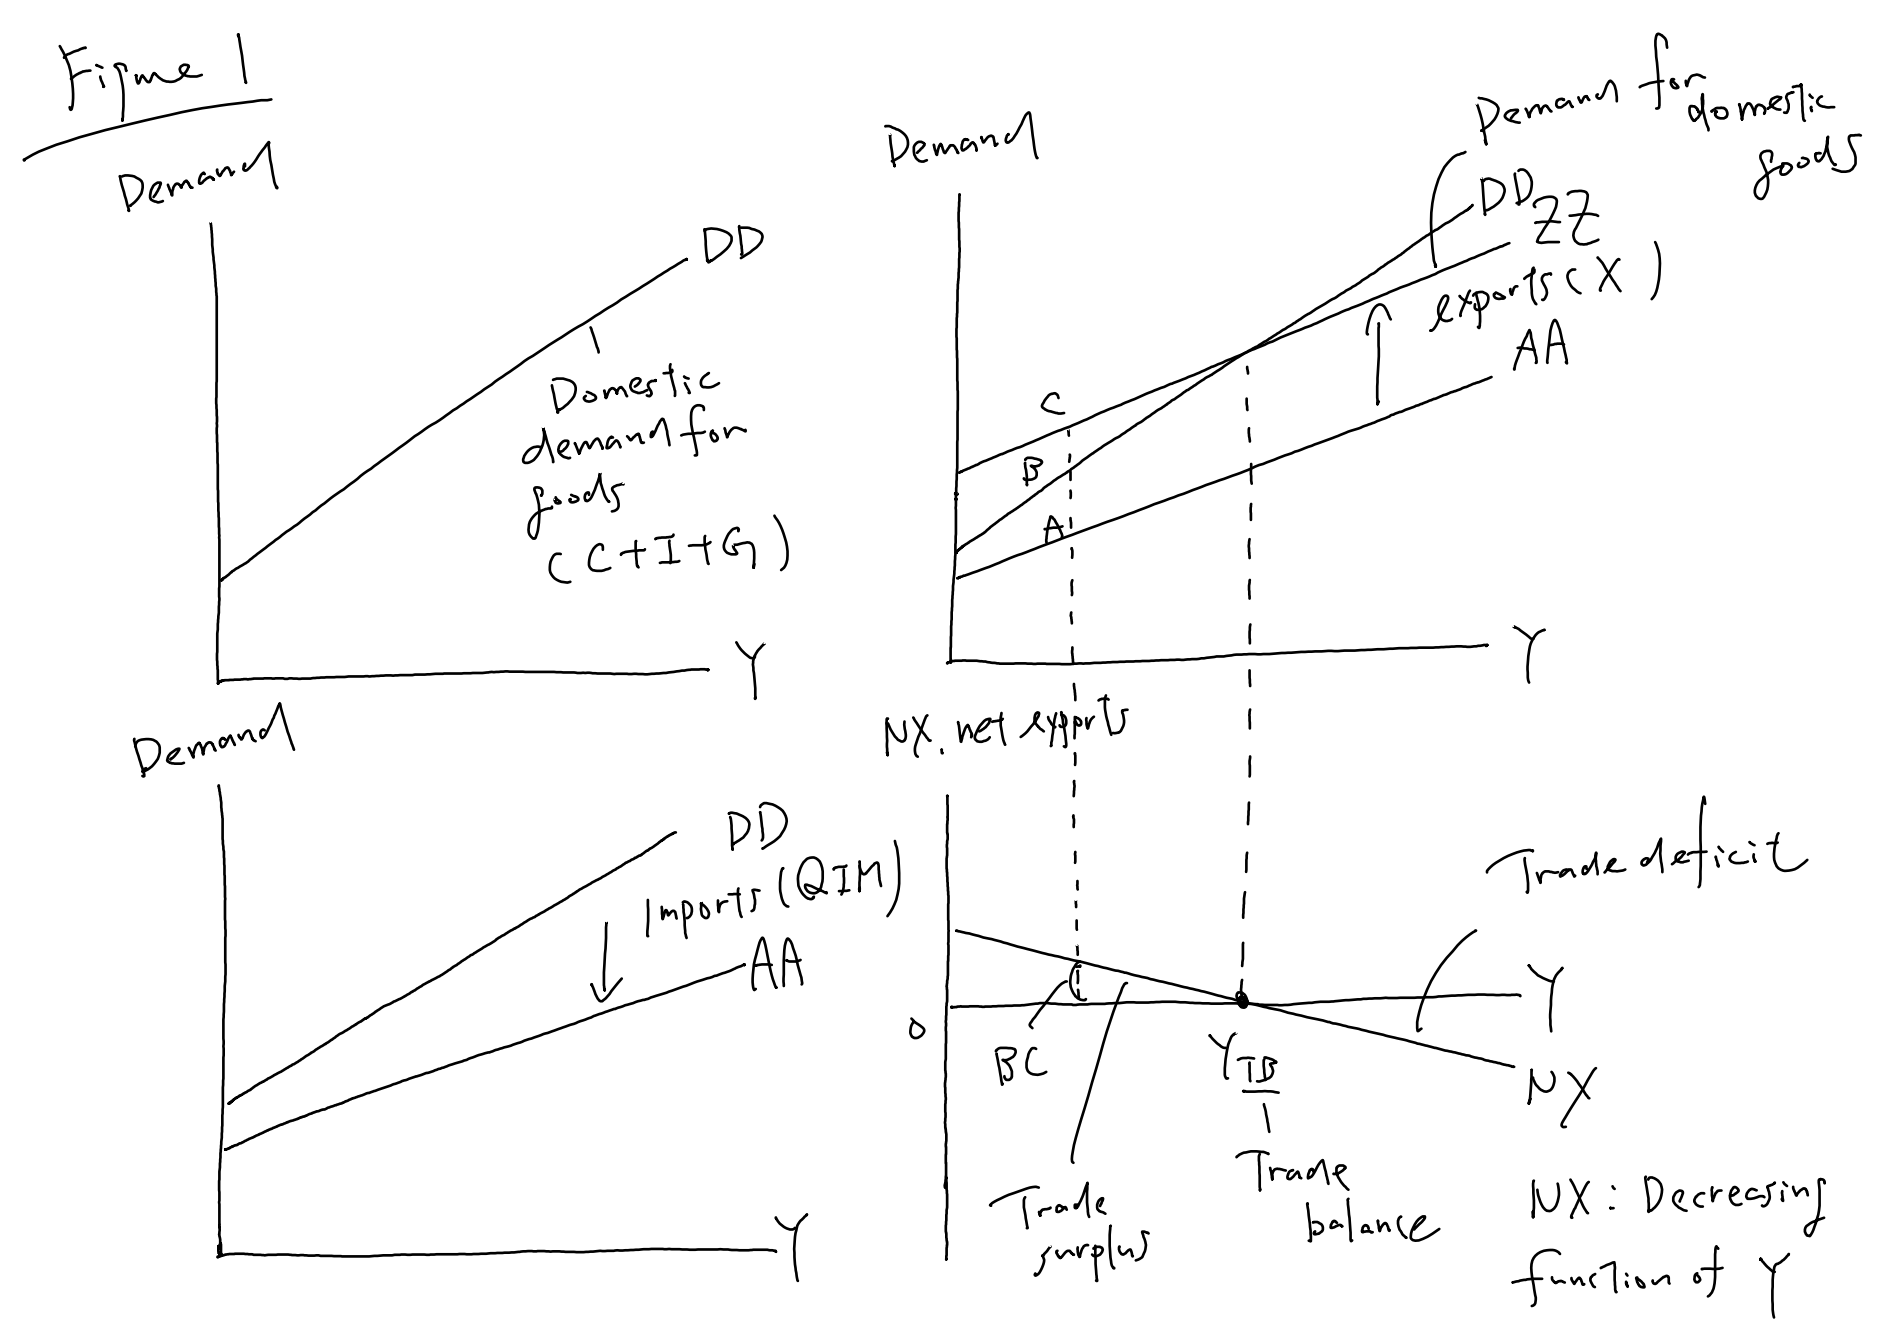
Goods market equilibrium graphically
Equilibrium can be in trade surplus or deficit
Y = Z in equilibrium
Effect of a real depreciation
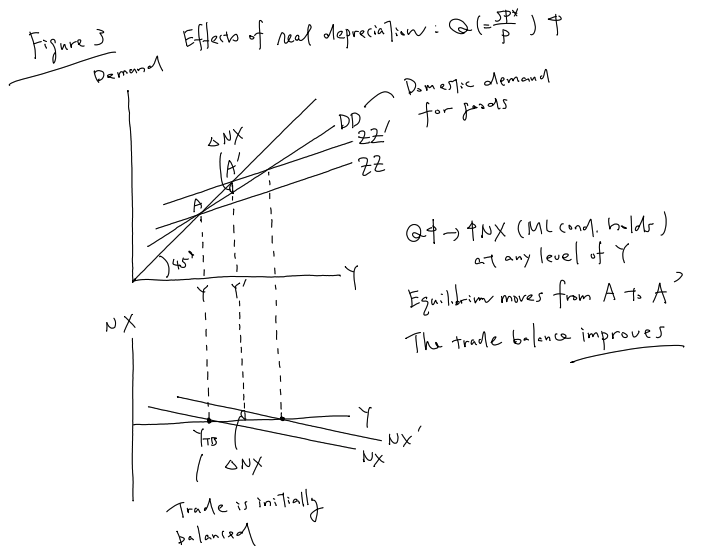
Trade initially balanced
Q increases -> NX increase
ML condition holds at any level of Y
Equilibrium moves from A -> A’
Trade balance improves (now in surplus)
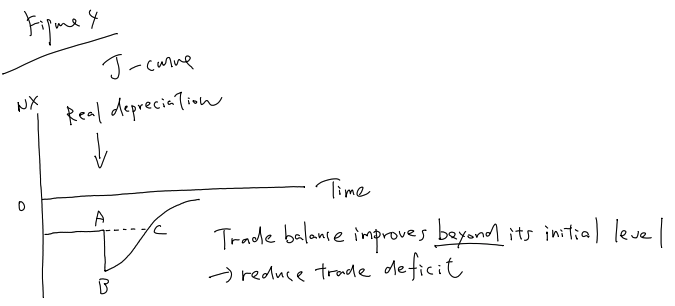
J-curve
When Q increases (depreciation), it takes time for the quantity of imports and exports to adjust
NX initially declines (Immediate fall in X value and rise in M value)
Over time, X increases and M falls
NX eventually exceeds the level before depreciation
People realise over time that in relative terms H goods are now cheaper
J-curve grpah
J-curve empirically
Real ER opposite way round in data
- Appreciation is followed by an initial decrease in trade deficit
- Followed by a lagged increase in deficit
Opposite for depreciation
Real depreciation equation
Q = SP* / P
increases