PHSC midterm 2
1/42
There's no tags or description
Looks like no tags are added yet.
Name | Mastery | Learn | Test | Matching | Spaced | Call with Kai |
|---|
No analytics yet
Send a link to your students to track their progress
43 Terms
Why ¼ factor for solar radiation flux in one layer model
S is the insolation that hits the Earth at any given moment, but the Earth is spherical and so as radiation hits one given spot its spread over ¼ of the Earths surface; earth a sphere account of per time per area units
Atmosphere emits both upwards and downwards in one layer model
The reason it emits both upward and downward is that the Stefan-Boltzmann law tells us how much energy a blackbody will radiate per area per time. A layer of atmosphere has area that can emit both on its top and on its bottom.
Negative feedback
regulatory process caused by perturbation of system that functions to return system to stable state
Positive feedback
intensification of deviation, as perturbation only sets into motion more reactions that push system further from stable state
Ice-Albedo Feedback
It describes how changes in ice cover affect the planet's temperature. Ice and snow have a high albedo, meaning they reflect a significant amount of incoming solar radiation back into space. This self-reinforcing climate process can in rising temperatures melt white ice and snow (high albedo), exposing darker ocean or land (low albedo) underneath. These darker surfaces absorb more solar heat, causing further warming and melting, creating a cycle that accelerates polar warming and sea ice loss. Or cause snow ball earth with high albedo.
Water-Vapor feedback
The fact that water vapor is a strong greenhouse gas means that the more water vapor you have in the atmosphere, the stronger the greenhouse effect, and the more greenhouse warming you get.
Water vapor increases strongly to increase in temp
The temperature doesn’t have to increase by very much in order to cause the saturation water vapor pressure to increase by a lot, which then increases moisture, increasing heat retention, warmer air holds more moisture
Cirrus
high wispy clouds that can precede storms but do not lead to precipitation themselves
Stratus
low clouds that form at a constant layer and stretch for large horizontal distances and can be associated with light rain
Cumulus
low levels, look like cotton balls, are not associated with rain, and often (but not always) come in 1D or 2D patterns
alto-
prefix to mean high (altocumulus, high cumulus)
nimbus
rainstorm fixutre
circostratus
cirrus/ stratus mix
cirrcocumulus
cirrus and cumulus
cumulonibus
rainstorm cumulus
altocumulus
high culumulus
altostratus
high stratus
nimbostratus
rainy stratus
stratocumulus
stratus and culumulus
fog
very low
Shortwave cloud radiative effect
effect of clouds on shortwave radiation at the top of the atmosphere = upward shortwave radiation at the top of the atmosphere when there are no clear
clouds - the upward shortwave radiation at the top of the atmosphere when there are clouds
Cloud albedo
clouds bright and reflect shortwave light, whiteness means they reflect most waves. The tropical convective clouds (deep cumulus and cumulonimbus clouds), which extend to high in the atmosphere. Low clouds (decks of stratus) off the coast of Peru and at high latitudes. These low clouds cover much more of the planet than high tropical clouds. The shortwave cloud radiative effect is much larger over ocean than land because the albedo of ocean is much lower than that of land.
Longwave cloud radiative effect
clouds have strong greenhouse effect, that the longwave cloud radiative effect is positive in all normal situations. radiative effect is that it tends to be larger for high clouds than for low clouds. The reason is that the atmosphere gets colder as you go higher up. No clear disinction between land and ocean as in short waves, still concentrated around tropics
In the global mean, the longwave cloud radiative effect is
+30 W m ́2, bc radiation coming from cloud less than that coming from surface, meaning less radiation lost in space when there is cloud
The net cloud radiative effect
Sum of the shortwave and longwave cloud radiative effects
global mean, the net cloud radiative effect
-20 W m ́2, so clouds have a net cooling effect on the climate.
The main places where clouds have a positive net cloud radiative effect
ice sheets and deserts, both of which have high surface albedos so the shortwave cloud radiative effect is small.
In most places clouds have a cooling effect
especially over oceans. The large stratus deck off the coast of Peru really stands out.
Clouds are the largest source of uncertainty in forecasts of climate.
Clouds are very hard to model in Global Climate Models because they are small relative to the size of the typical model grid, which has a horizontal dimension of about 100 km. Since small changes in clouds cause huge changes in the radative balance and clouds are hard to model
GCM
Global Climate Models (GCMs) are the main tool we use to forecast the climate. Solve the partial differential equations for fluid flow (fluid moving around, which carries heat with it) and radiative transfer for the atmosphere and ocean on a planet like Earth, typically used by specifying some change in greenhouse forcing and seeing how the climate responds
How GCM’s work
break the atmosphere and ocean up into little boxes called gridboxes such that each model variable, like temperature, pressure, and humidity only has values at these boxes. Versions of the equations are then developed that relate the values of variables on each gridbox to each other and can step them forward in time.
What type of computers are GCMs run on
Supercomputers
Why clouds are difficult for GCM
They are comparatively much smaller and more sensitive to smaller things than the GCM can account for, so cloud like variables are put in place instead of clouds based on observation and theory
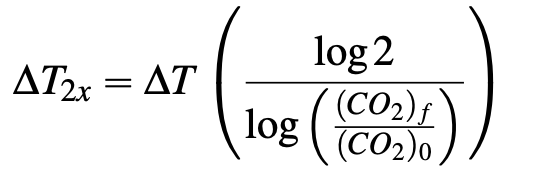
climate sensitivity
the change in global-mean surface temperature
due to some radiative forcing. It is often quantified as ∆T2x
∆T2x
GCM as climate senstivity models
Not completely independent from one another so we might not expect the GCM climate sensitivity estimates to reflect the full possible range of climate sensitivity, could do all possible simulations but still wont reflect real world
Paleoclimate record to estime climate sensitivity
While we have good records for these factors there may be other influencing factors we cant account for
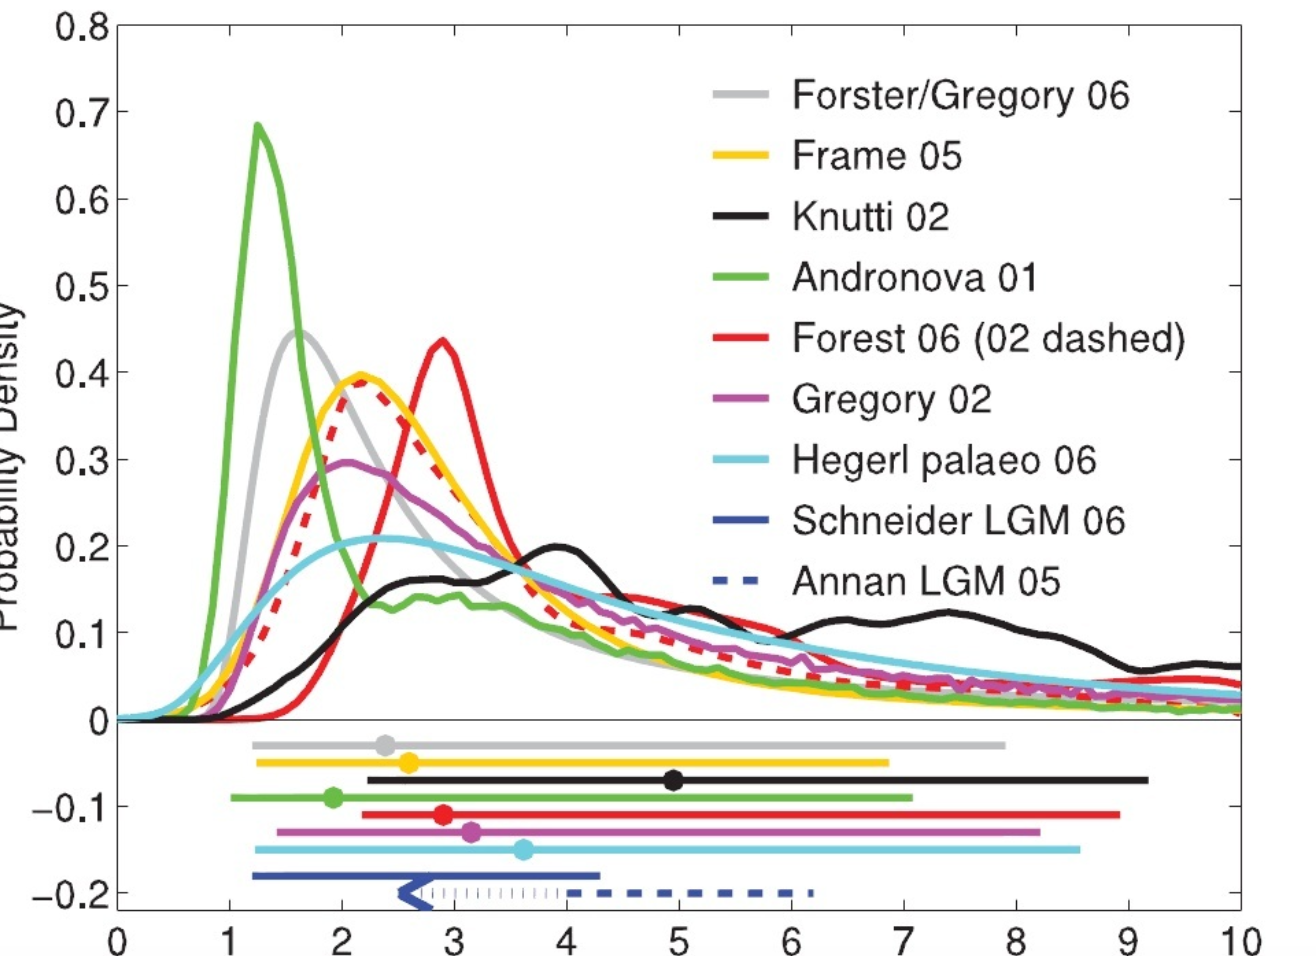
Different estimations of climate sensitivity
The first thing to notice from the figure is that we can’t constrain the climate sensitivity very well!
Cost-Benefit Analysis
C = C0e^λT
The larger the discount rate
the bigger the future cost
Discount rate
λ
low discount rate
the cost is lower than benefit