ap test (aphug)
1/311
Earn XP
Description and Tags
UNIT 1, UNIT 2, UNIT 3, UNIT 4, UNIT 6, UNIT 7 IN PROGRESS
Name | Mastery | Learn | Test | Matching | Spaced | Call with Kai |
|---|
No analytics yet
Send a link to your students to track their progress
312 Terms
tells a story, displays quantitative data, has strengths and weaknesses (1.1)
thematic map
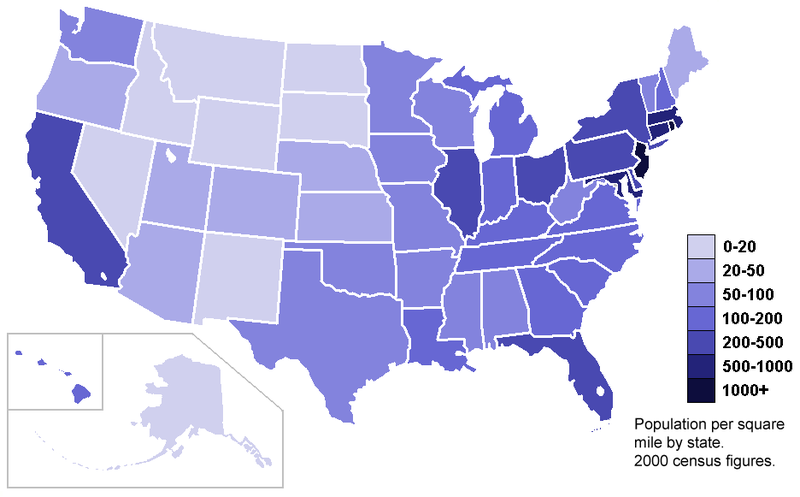
uses colors and shading to represent quantifiable data. generally darker means more. excellent at showing density. (1.1)
choropleth
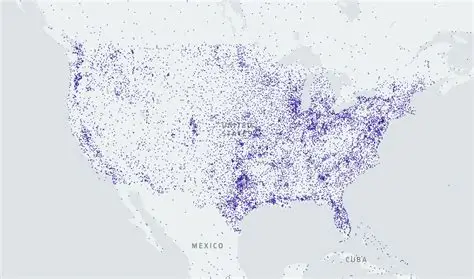
uses dots to represent a value in its approximate location. excellent at showing distribution (1.1)
dot density
if you wanted to show the density of something, what map would you use? (1.1)
choropleth
if you wanted to see the distribution of something, what map would you use? (1.1)
dot density
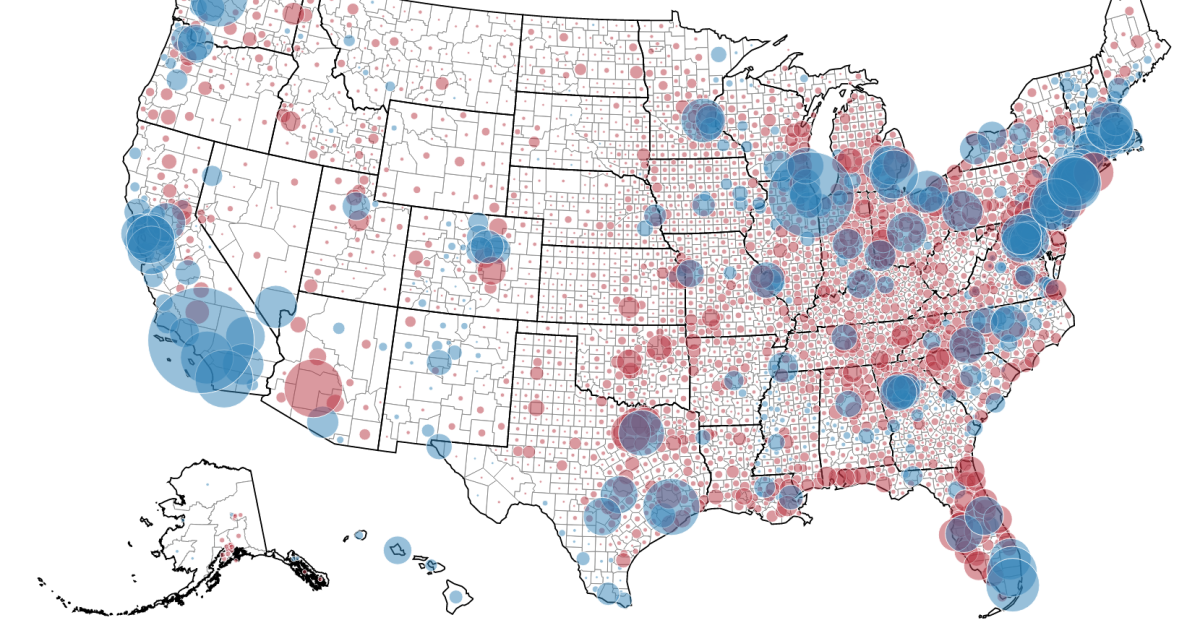
uses symbols that are proportionate in size to the actual value of the data (1.1)
graduated symbol
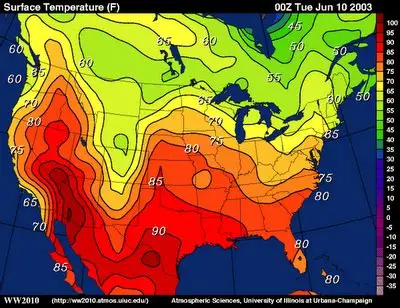
connects areas of equal value with lines (1.1)
isoline
if you wanted a map for elevation or weather, which map is the best choice? (1.1)
isoline
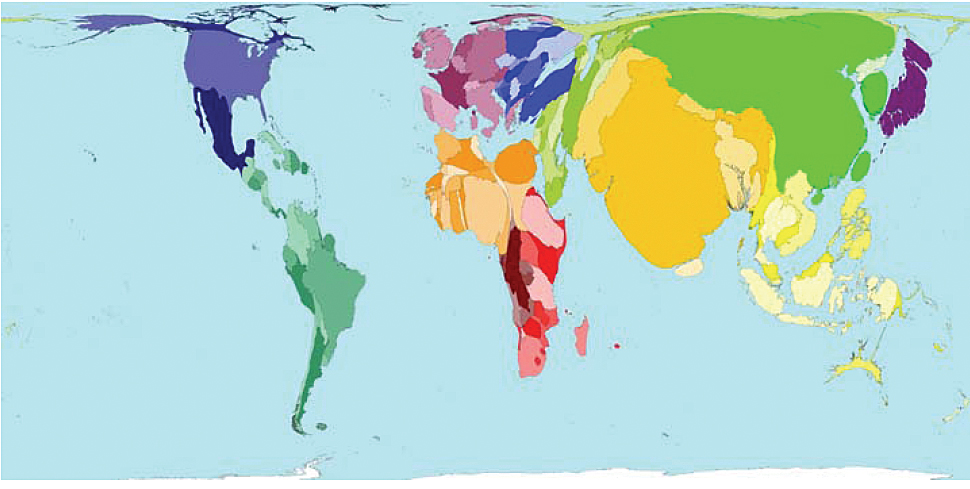
distorts the size of things to represent their value (1.1)
cartogram
the relationship to another place. ex- next to my house, across the river (1.1)
relative location
the exact, precise place where something is, using latitude and longitude (1.1)
absolute location
the exact, precise distance, using miles kilometers, feet, etc. (1.1)
absolute distance
using the cardinal directions to find the directions (1.1)
absolute direction
the spatial interaction- connections, contacts, movements, and flow of things between places. how much they are connected (1.1)
relative distance
using left or right for the directions. ex- turn left at target, then right after the stop sign (1.1)
relative direction
when there is a high density in a certain area and a lot of people are clumped together (1.1)
clustering
the way something is spread out over an area (1.1)
dispersal/ distribution
the process of a cartographer showing the curved surface of the earth on the flat surface of a map (1.1)
map projection
direction
shape
good for navigation
preserves right angles
Mercator map projection advantages
individuals physically visiting a location and taking firsthand information there (1.2 + 1.3)
fieldwork
a computer system for checking, collecting, storing, and displaying data related to positions on the earth’s surface. can show many types on one map (1.2 + 1.3)
GIS
satellites orbit the earth and communicate locational information to receivers. uses absolute location (1.2 + 1.3)
GPS
use of cameras in space that take pictures of the surface. collects data without physical contact. (1.2 + 1.3)
remote sensing
images captured from planes or drones (1.2 + 1.3)
aerial photography
refers to the physical gap/ distance between two things (1.2 + 1.3)
space
factors that contribute to the uniqueness of a location (1.4)
sense of place
a location without a sense of place. no distinct attributes (1.4)
placelessness
a location’s name- usually reflective of the culture and history of the location (1.4)
toponym
the process geographers use to divide and categorize space into smaller areas of analysis (1.4)
regionalization
connections, contracts, movement, and flow of things between places (1.4)
spatical interaction
the interaction between places declines as the distance between them increases (1.4)
distance decay
the increasing sense of accessibility and connectivity which seems to bring humans in distant places closer together (1.4)
time- space compression
the process of which a characteristic spreads across space from one place to another (1.4)
diffusion
the study of how humans interact with their environment (1.5)
cultural ecology
the belief that climate and landforms are the most powerful forces shaping human behavior and societal/ cultural development (1.5)
environmental determinism
states that the environment does affect our way of life but it is not the deciding factor (1.5)
possibilism
large area with small amounts of data (1.6)
small scale map
show small area with large amounts of data (1.6)
large scale map
an area with one or more unifying characteristics or patterns of activity (1.7)
region
a region that is united by one or more specific traits (1.7)
formal region
a functional region is organized around a ____ (1.7)
central node
a region based on the people’s perspective or perception of a certain location (1.7)
perceptual region
____ boundaries are based on opinions of the people (1.7)
perceptual region
people tend to live in places tend to live in places where they can find jobs, make money, spend money, and find goods and services (2.1)
economic factors influencing where people live
people tend to live within the same cultural group (2.1)
cultural factors influencing where people live
people try to live where there are more freedoms and strong governments (2.1)
political factors influencing where people live
total population / land area (square miles) (2.1)
arithmetic density
arithmetic density (2.1)
total population / land area (square miles)
total population / arable land (square miles) (2.1)
physiological density
physiological density (2.1)
total population / arable land (square miles)
farmers / arable land (square miles) (2.1)
agricultural density
agricultural density (2.1)
farmers / arable land (sq. mile)
the scientific study of human population, focusing on their characteristics, size, structure, and movements over space and time (2.2)
demography
the maximum population size an environment can sustain (2.2)
carrying capacity
ratio < 100 (2.3)
more female births
ratio = 100 (2.3)
even births
ratio > 100 (2.3)
more male births
the average number of years a person is expected to live (2.3)
life expectancy
the number of people who are too old or too young to work divided by the number of people in the working age population multiplied by 100 (2.3)
dependency ratio
high dependency ratio=
lots of people not working
how many babies are being born (2.4)
fertility
the number of live births occurring in one year per 1000 people (2.4)
CBR
average number of kids who would be born to a woman during her childbearing years (2.4)
TFR
globally, has TFR increased or decreased over time? (2.4)
decreased
the number of deaths occurring in one year per 1000 people (2.4)
CDR
number of infant deaths occurring in one year per 1000 people (2.4)
IMR
if NIR is a negative number, what does that mean? (2.4)
the population is decreasing
the NIR ___ account for migration (2.4)
does
the NIR is higher in ______ (2.4)
less developed countries
how long it would take for a country’s population to double (2.4)
doubling time
governments encourage families through propaganda and incentives to have children (2.4)
pro natalist policies
governments discourage families from having children (2.4)
anti natalist policies
the study of population statistics (2.5)
demography
used by geographers to analyze and predict trends in population growth and decline including patterns of births, deaths, and natural increase rates (2.5)
demographic transition model
predictable stages in disease and life expectancy that countries experience as they develop (2.5)
epidemiological transition model
the DTM has ___ stages
5
Malthusian theory (2.6)
population grows exponentially while food only grows arithmetically, resulting in a shortage of food and famine.
Boserups claim (2.6)
food supply is impacted directly by population growth. As population grows, humans will develop new technologies to also increase production of food supply.
What does neo mean? (2.6)
new
the permanent or semi-permanent relocation of people from one place to another (2.10)
migration
negative factors that cause people to want to move away from a location (2.10)
push factors
the movement into a location (2.10)
immigration
the movement out of a location (2.10)
emigration
barriers that hold migrants back from continuing to travel (2.10)
intervening obstacle
a positive opportunity that causes migrants to voluntarily stop traveling (2.10)
intervening opportunity
people migrate due to their own choices (2.11)
voluntary migration
people migrate due to fears of violence or survival (2.11)
forced migration
The condition of roughly equal strength between opposing countries or alliance of countries. (4.1)
balance of power
An invisible line that marks the extent of a state’s territory. (4.4)
boundary
A boundary that has ceased to function but can still be detected on the cultural landscape. (4.4)
relic boundary
what is an example of a relic boundary? (4.4)
berlin wall
These are lines drawn on an area by a conquering or colonizing power that ignores existing cultural patterns (4.4)
superimposed boundary
Boundaries that are established after the settlement in an area. It changes as the cultural landscape changes and is drawn to accommodate developments due to a certain event, such as a war (4.4)
subsequent boundary
Boundaries formed by straight lines (such as lines of lat. or long,) or occasionally arcs, regardless of the physical and cultural features of the area (4.4)
geometric boundary
Refers to the political boundary developed, mostly in a virtually unpopulated area defined before any distinctions of culture, language, settlement type etc. (4.4)
antecedent boundary
A boundary line that coincides with some cultural divide, such as religion or language (4.4)
Consequent boundary
A sovereign state comprising a city and its immediate homeland (4.3)
city-state
Attempt by one country to establish settlements and to impose its political, economic and cultural principals in another territory (4.2)
colonialism
A territory that is legally tied to a sovereign state instead of being independent (4.2)
colony
A state in which the distance from the center to any boundary does not vary significantly (4)
compact state