Sampling & Distribution
1/19
There's no tags or description
Looks like no tags are added yet.
Name | Mastery | Learn | Test | Matching | Spaced | Call with Kai |
|---|
No analytics yet
Send a link to your students to track their progress
20 Terms
Descriptive Stats
Numbers and graphs used to summarize and describe data.
Accurate Inferences (Conclusions) Require:
Good experimental design
Representatives samples
Accurate theories
Central Tendency
Where most of the data is centered or what a “typical” value looks like.
Mean = average
Median = middle value
Mode = most frequent value
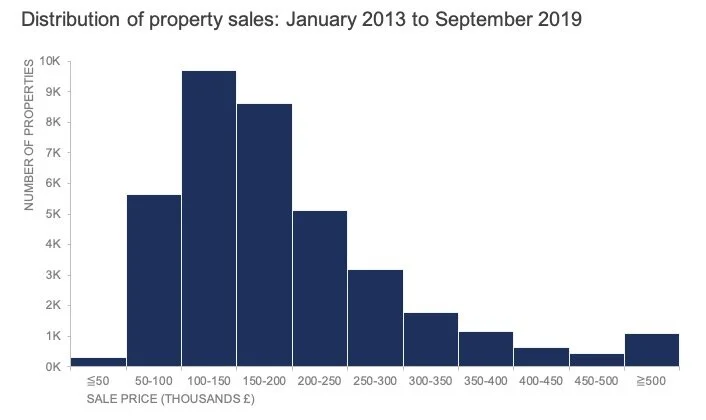
Histogram
It shows how often values occur and the shape of the data (e.g., normal, skewed)
Histogram = continuous data
Bar graph = categories
Concrete (Local) Element
Things directly observed or calculated from the sample, such as statistics, graphs, and relationships between variables
Abstract (Global) Element
Help us make conclusions about the population; population estimation, hypothesis testing, confidence intervals, etc.
Distribution
How data is distributed (spread out)
Tells us the range of scores and the frequency (or probability) of those scores
Normal, skewed, uniform
Probability Density Function (PDF)
The probability of different values occurring in a continuous distribution.
Tells the relationships between the value and the population mean
Uniform Distribution
Symmetric and all outcomes are equally likely (roll of die)
Discrete: finite number of outcomes
Outcomes are bounded (we know the lowest and highest values, can't go under/past)
Binomial Distribution
Probability of a win/lose outcome in an experiment repeated multiple times
Trials are all independent
Two possible outcomes (coin toss, hit or miss the target with a dart)
Normal Distribution
Symmetric, bell-shaped, continuous data
Individual scores in a population or sample
Described by mean and standard deviation
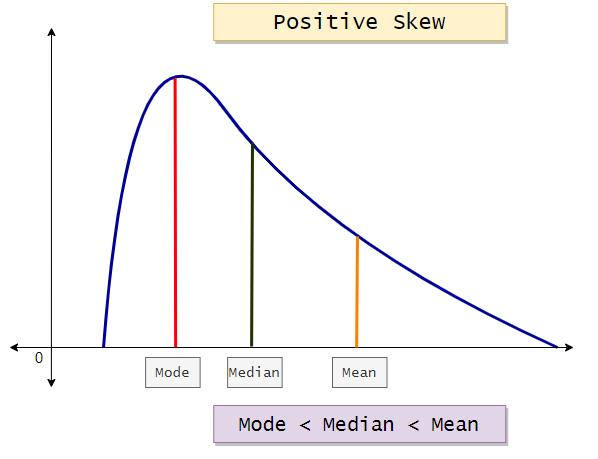
Positive (right) skewed, Mode < Median < Mean
Negative (left) skewed, Mean < Median < Mode
Sampling Distribution
A distribution that contains statistics from samples (the mean) instead of individual scores
Efficient and cheap
Allow us to make an estimate about the full population
Kurtosis
Measure how much data is found in the tails of a distribution and how peaked the distribution is.
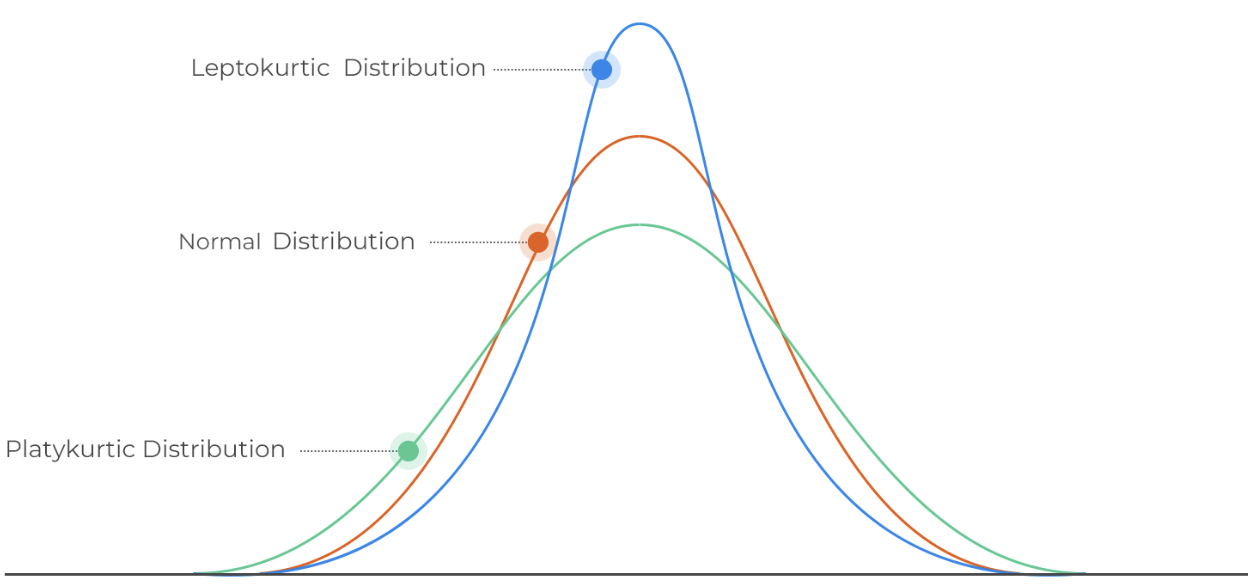
Leptokurtic Distribution
A distribution that is taller, narrower, and more extreme values. Upside down V
Platykurtic Distribution
Shorter and wider, with lighter tails and fewer extreme values. Upside down U
Distribution of Sample Mean (DOSM)
The mean of DOSM is the same as population
Distribution of many sample averages used to understand the true population mean.
Used for confidence intervals & hypothesis testing
Parameter vs Statistic
Parameter (μ)- a numerical value that describes a population.
(Fixed, usually unknown because we can’t measure everyone)
Statistic (x̄) - a numerical value that describes a sample.
(Calculated, used to estimate the parameter)
Theoretical Populations
A population that is assumed to follow a certain distribution shape, with parameters (e.g., mean and standard deviation) based on previous research.
Monte Carlo Sampling
A method that uses repeated random, independent sampling from a probability distribution to estimate population values.
The more samples taken, the closer the estimate gets to the true value
Example: Rolling a die thousands of times and using the average result to estimate the mean.
Bootstrap Resampling
A method that repeatedly samples with replacement from the original dataset
Bootstrapping is useful in small samples sizes, more precise estimates of parameters, and make comparisons across groups
Estimates reliability without collecting new data
Example
Original data:
[2, 4, 6, 8]
One bootstrap sample could be:
[2, 2, 6, 8] or [4, 4, 4, 6]