MAR 3203 Chapter S6: Statistical Process Control
1/11
Earn XP
Description and Tags
Name | Mastery | Learn | Test | Matching | Spaced | Call with Kai |
|---|
No analytics yet
Send a link to your students to track their progress
12 Terms
Statistical Process Control (SPC)
The application of statistical techniques to ensure that processes meet standards
Objective is to provide a statistical signal when assignable causes of variation are present
Variability is inherent in every process
A process is in statistical control when the only source of variation are common (natural) causes after eliminating special (assignable) causes
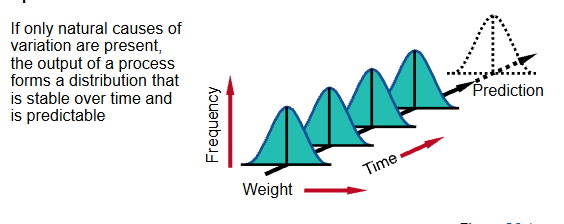
Natural variations
The variability that affects every production process to some degree and is to be expected; also known as common cause
When natural variations form a normal distribution, they are characterized by the mean (measure of central tendency) and standard deviation (measure of dispersion)
When the distribution remains within limits, the process is said to be “in control”
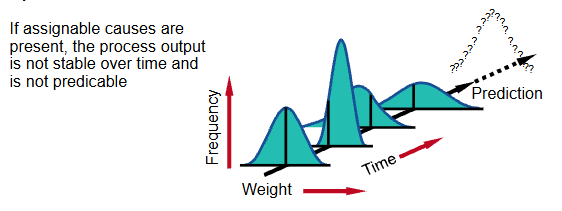
Assignable variations
Can be traced to a specific reason with the objective to discover when assignable causes are present
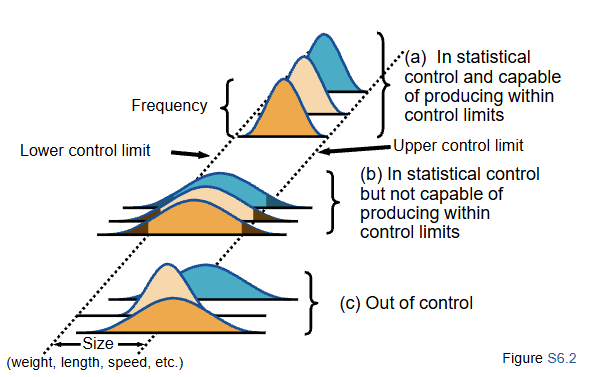
Control charts
Helps distinguish between natural variations and variations due to assignable causes with three types of process outputs
In statistical control and capable of producing within control limits
In statistical control but not capable of producing within control limits
Out of control
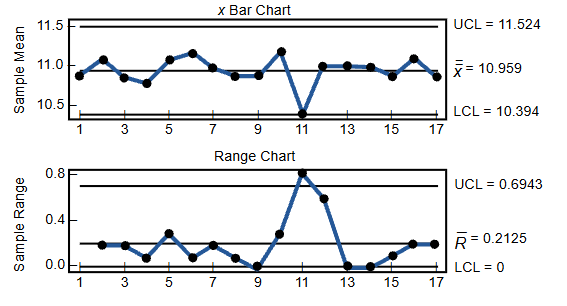
Control charts for variables
Two charts that must be used together
Characteristics that take any real value
May be in whole or fractional numbers
Continuous random variables
x̄-chart tracks changes in the mean
R-chart indicates a gain or loss of dispersion
Central limit theorem
States that regardless of the distribution of the population, the distribution of sample means drawn from the population will tend to follow a normal curve
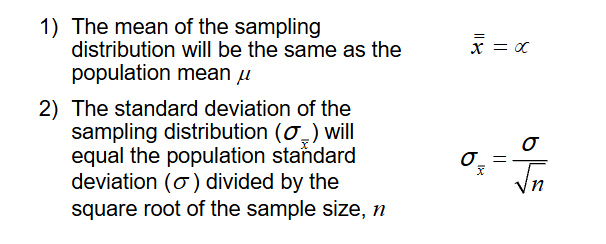
Sampling distribution of means
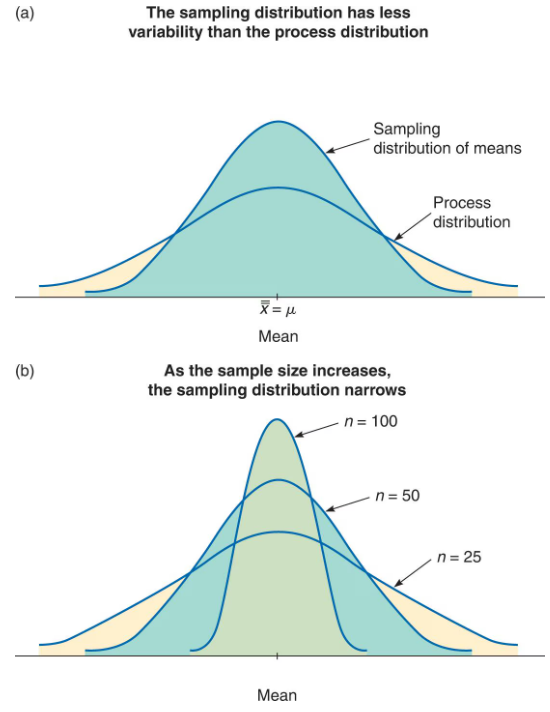
Population distributions may differ (normal, beta, uniform) but the distribution of sample means always approaches a normal distribution
As sample size increases, the sampling distribution narrows
Sampling distribution has less variability than the process distribution
R-chart
Type of variables control chart that shows sample ranges over time—difference between smallest and largest values in sample
Monitors variability
Independent from the process mean
Process capability
A measure of the relationship between the natural variation of the process and the design specifications
A process in statistical control does not necessarily meet the design specifications
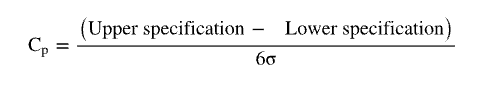
Process capability ratio Cp
Determines whether a process meets design specifications
A capable process must have a Cp of at least 1.0
Does not look at how well the process is centered in the specification range
Target value of Cp = 1.33 is used to allow for off-center processes
Six sigma quality requires Cp = 2.0
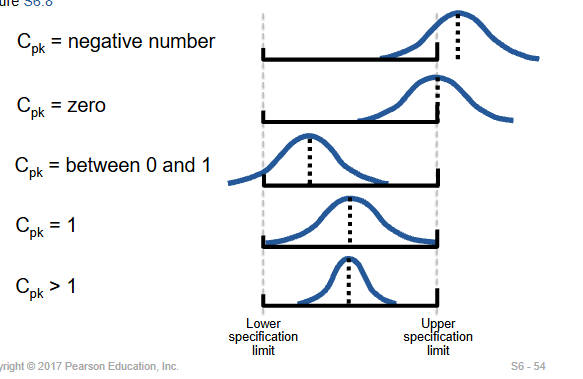
Process capability index Cpk
Determines whether a process meets specifications based on the distance between the process mean and the nearest specification limit
A capable process must have a Cpk of at least 1.0
A capable process is not necessarily in the center of the specification, but falls within the limit at both extremes
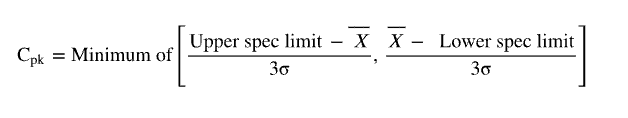
Interpreting Cpk