PSYC 344 Exam 3
1/130
There's no tags or description
Looks like no tags are added yet.
Name | Mastery | Learn | Test | Matching | Spaced | Call with Kai |
|---|
No analytics yet
Send a link to your students to track their progress
131 Terms
What are the three types of validity to evaluate in an association claim?
Statistical, internal, and external validity
What type of claim does a correlational study support?
Association claim
Why does a correlational study not support causation?
No control over variables, direction problem, third variables
Define replication in a study and why it is important
Conducting a study again to see if results repeat
Significance: confirms results are consistent and not due to chance
Define outlier
A data point far from the rest of the data
How can outliers affect results?
They can inflate or weaken correlations
What happens to a correlation when you remove an outlier?
The relationship can change a lot, stronger or weaker
Define mean
Average of all values
How do outliers affect the mean?
They pull mean toward the extreme value
Define restriction of range
Issue that occurs when the values collected do not represent the entire possible range for a variable
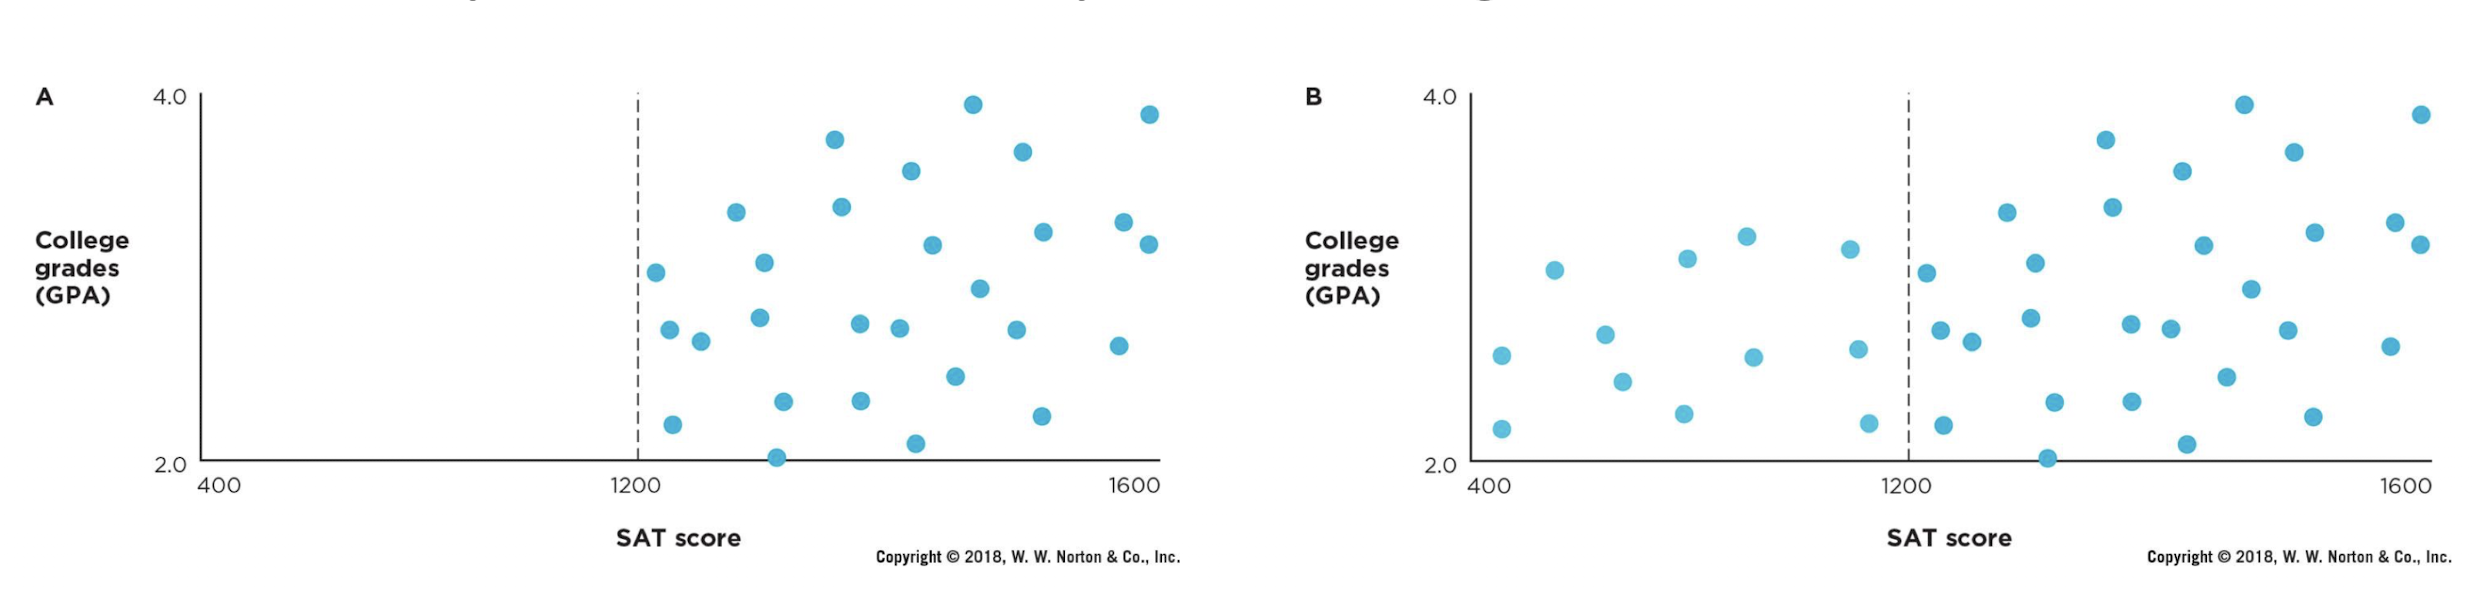
How does restriction of range affect correlation?
It weakens the observed relationship
What does the Pearson correlation measure?
Strength and direction of a linear relationship
What type of relationship does Pearson correlation miss?
Curvilinear relationships
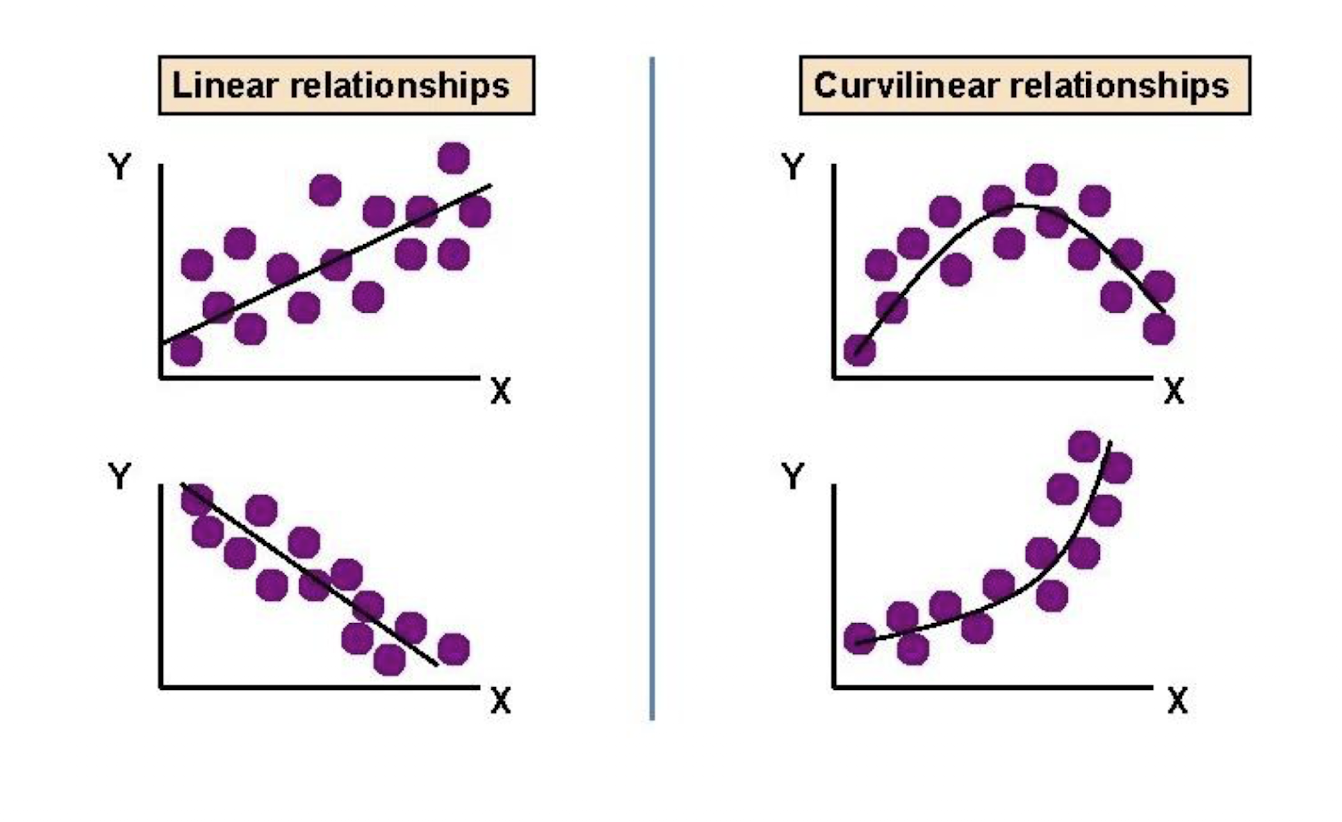
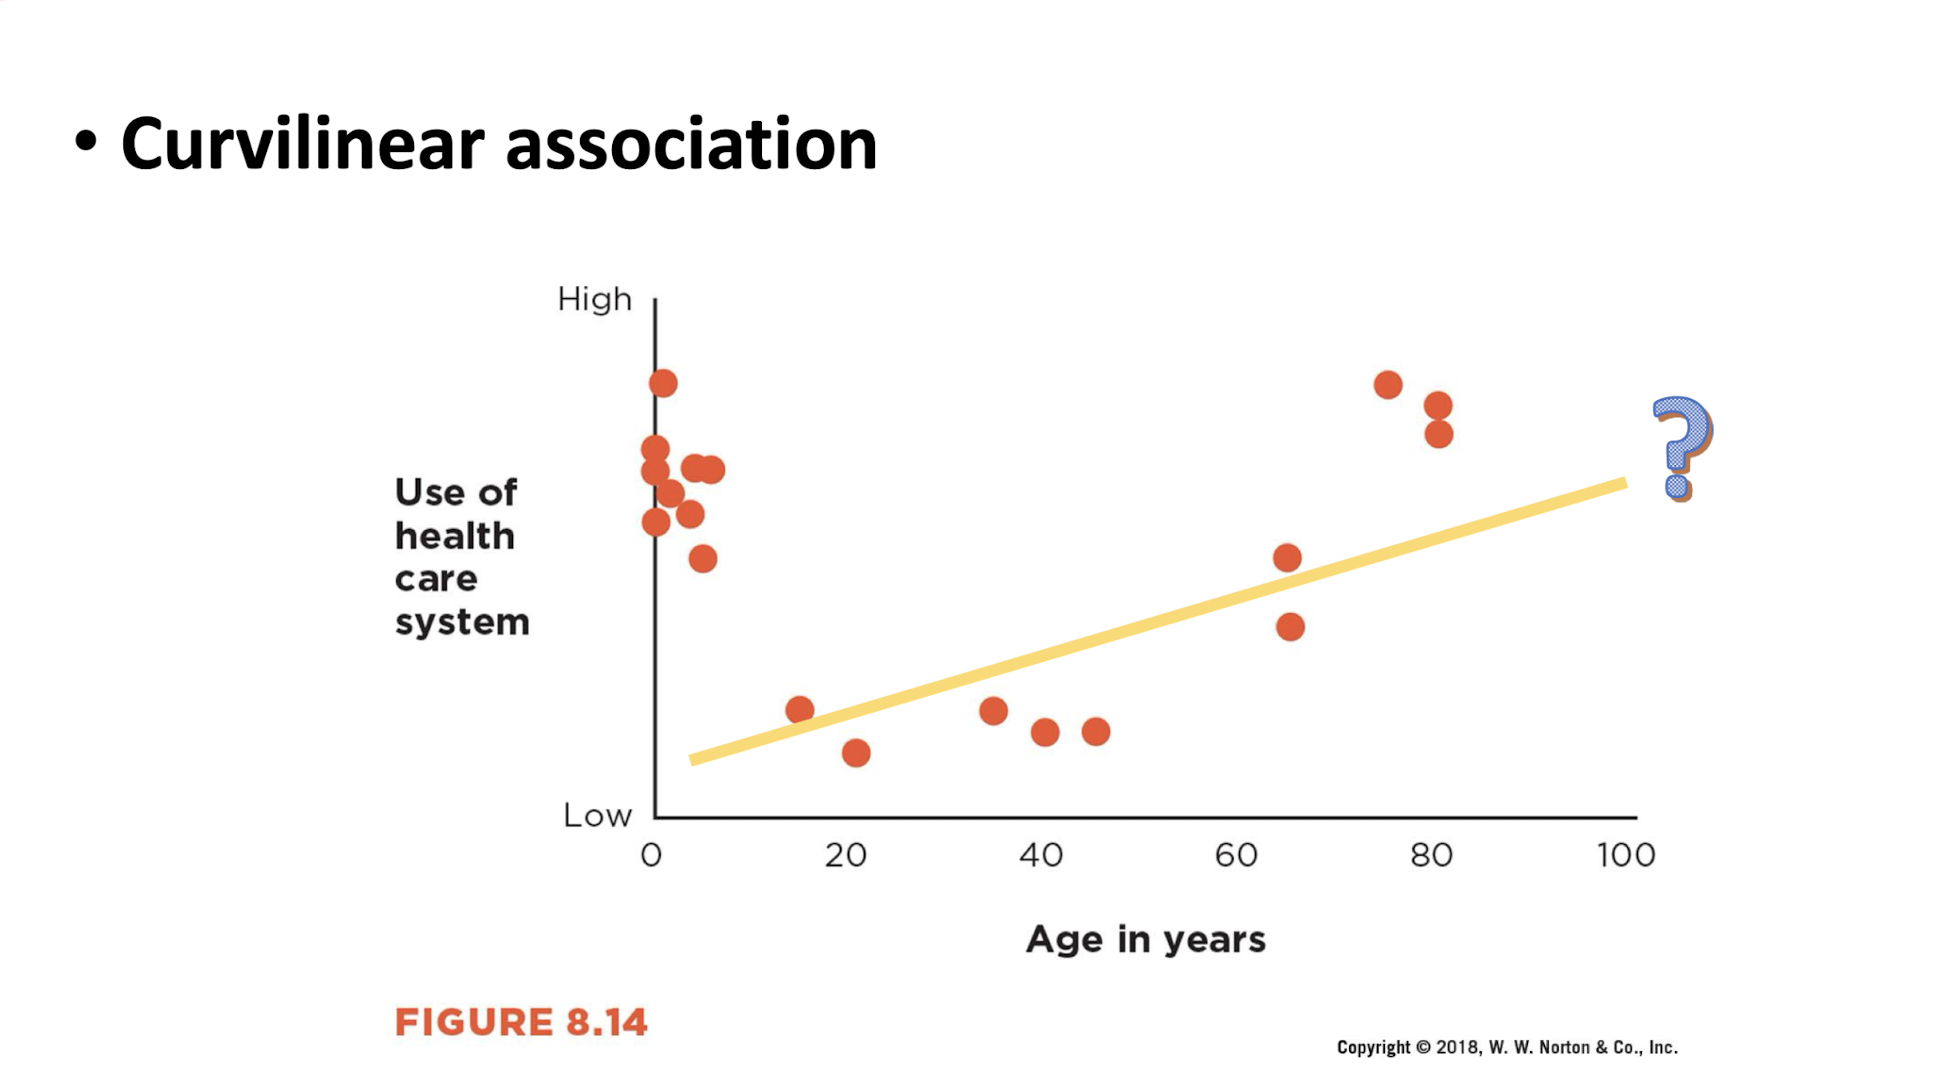
Define curvilinear assocation
A relationship between two variables where the association does not follow a straight line
Why is a curvilinear relationship important to check?
A strong relationship might look weak if it is not linear
(Examples: age and healthcare use, high when young and old low in middle)
What are the three criteria for causation of experiments supporting causal claims?
Covariance
Temporal precedence (directionality problem)
Internal validity (third-variable problem)
Define covariance
The study’s results show that as A changes B changes (2 variables are correlated)
Define temporal precedence
Study’s method ensures that A comes first in time, before B
Part of casual claims
Directionality problem: You do not know which variable came first
Define internal validity
In a relationship between one variable (A) and another variable (B), the extent to which A, rather than some other variable (C), is responsible for changes in B. Concerned with other factors, applies to CASUAL CLAIMS
Third variable problem: hidden variable explains the relationship (ex. heat increases both ice cream sales and drownings)
Define external validity
Whether findings generalize to other people, places, and times
Do the results apply beyond the study?
Poor external validity mean = results only apply to the specific sample or setting
Define moderator
A variable that changes the strength or direction of a relationship
How do you identify a moderator?
The relationship is different across groups
Ex. stress affects boys more than girls, gender is the moderator
What does it mean if a variable does not moderate?
The relationship stays the same across groups
Why are moderators important?
They show when or for whom a relationship changes
Difference between external validity and moderators
External validity: asks if results generalize
Moderators: explain differences across groups
What are the main goals when studying correlations?
Estimate relationships, understand r, analyze data, evaluate validity
Define bivariate correlation
Associations that involve exactly two variables
Ex. Happiness and days spent on vacation
What types of variables are used in bivariate correlation?
Two quantitative variables (SCATTERPLOTS, for Pearson correlation) or categorical
Cohen’s guideline for a small, medium, and large corrleation?
Small: r = .10
Medium: r = .30
Large r = .50
When one variable is categorical, what graph is used?
Bar graph or grouped dot plot
Define quantitative variable
(Numerical/Continuous/Ordinal): Represents numerical values with meaningful magnitudes
Define categorical variable
(Qualitative/Nominal/Binary): Represents groups or classifications, such as "Type of Vehicle" or "Gender”
What do you compare with categorical data to describe associations?
Means of each group →
t test
What is a t test, and what is it used for?
A statistic to test the difference between two group averages (means)
Used to test the difference between group means
Interrogating association claims uses what validities?
Construct, statistical, internal, and external
What does each validity ask?
Construct: How well was each variable measured?
Is the measure reliable and does it measure what it should?
Statistical: How well do the data support the conclusions?
How strong is relationship? How reliable is the estimate? Has it been replicated? Could outliers have an effect? Restriction of range? Association curvilinear?
Internal: Can we make a casual inference from association?
External: To whom can the association be generalized?
Define effect size
Describes the strength of an association
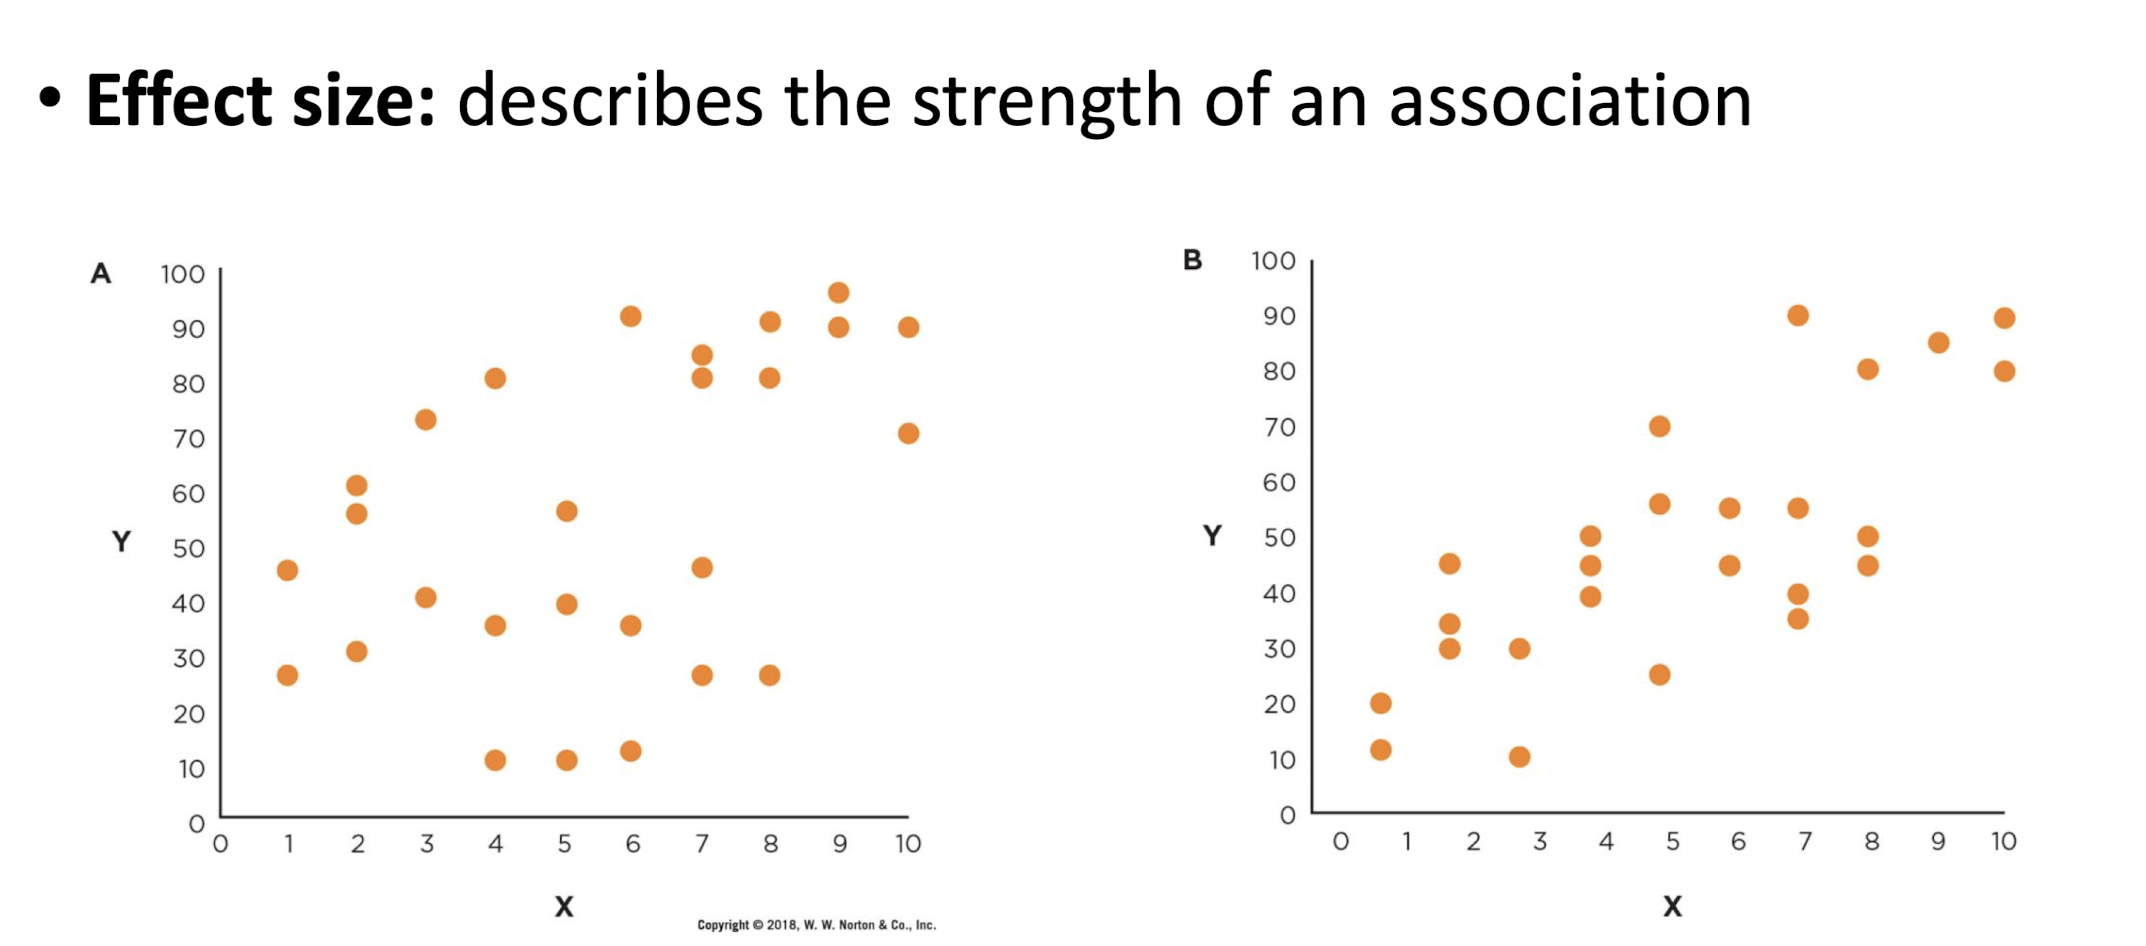
If all else are consistent/equal, why are larger effect sizes important?
They give more accurate predictions
When comparing two graphs, what shows a stronger relationship?
Points closer to a clear line
What is one exception to “larger effect size is better”?
Context can matter, small effects still matter sometimes
What two methods assess reliability of results?
Confidence intervals and p-values
Define confidence interval
An interval which is expected to typically contain the parameter being estimated; a range of plausible values for the population mean
Often used to predict the mean of a population using a sample of the population
What does a 95 percent CI mean?
95% of such intervals contain the true value
What does it mean if a CI does not include 0?
The result is statistically significant
Define p-value
The likelihood that the observed result would have been obtained if the null hypothesis of no real effect were true
Probability of the result if no real effect exists
What does p < .05 mean?
The result is statistically significant
Why does sample size matter?
Larger samples give more reliable estimates
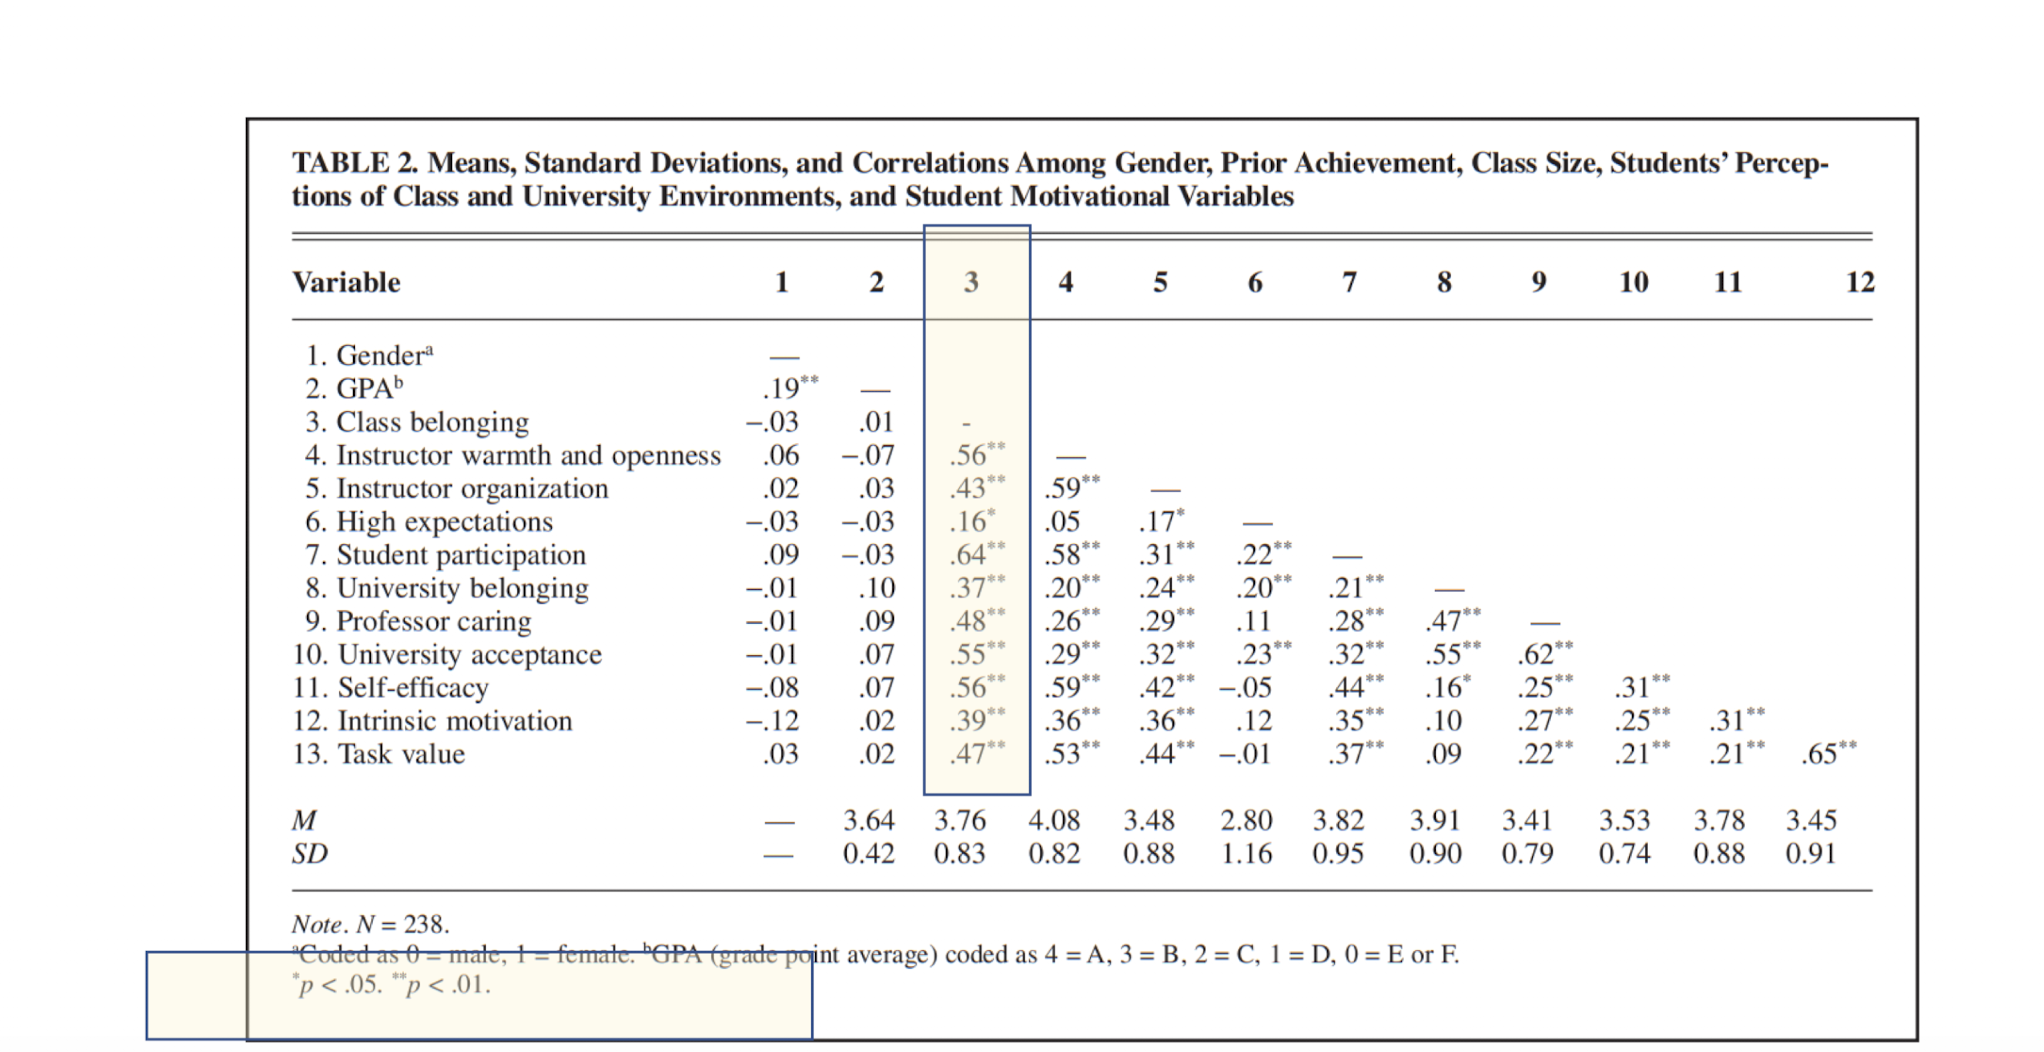
What do journal tables of correlations show?
Strength and direction of relationships between variables
Define multivariate design
Design involving more than two measured variables
Such as longitudinal and multiple regression designs
Define longitudinal study
Study the same group of people at several different time points
For longitudinal studies, what do cross-sectional correlations test?
Relationship between TWO different variables at ONE time
Different variables
One (same) time
Can cross-sectional correlations show causation?
No, because it cannot establish temporal precedence (cause must come before effect)
For longitudinal studies, what are autocorrelations?
Correlation of ONE (the same) variable across time
One (same) variable
Different times
What do strong autocorrelations show?
The variable is stable over time
Do autocorrelations establish temporal precedence between variables?
No
For longitudinal studies, what are cross-lag correlations?
Looking at an earlier measure of one variable and whether that is associated with a later measure of another variable
Two different variables
Two different times
Why are cross-lag correlations useful?
They help test direction of relationships
Can cross-lag correlations prove causation?
No, but they get closer (still cautious because we are not measuring other variables (cannot be 100% certain))
If both cross-lag paths are significant, what does it suggest?
Mutual influence, both affect each other
They are mutually reinforcing but we cannot be certain about the directionality since both influence each other
Out of the three criteria for causation, what can a longitudinal design establish?
ONLY covariance can be established, but can still provide SOME evidence for causation by fulfilling 3 criteria
Covariance
Temporal precedence
Internal validity
Why not just do an experiment?
Sometimes it is not possible to randomly assign, or it is unethical
Can be unethical or not possible
Define multiple-regression analyses
A statistical method that examines the relationship between one dependent variable and multiple independent variables, allowing researchers to assess the unique contribution of each predictor while controlling for others
What do you use multiple-regression analyses for?
Ruling out third variables
Why is multiple-regression analyses important?
You are able to control confounding variables
Confounding v. Moderating variables: both third variables that can be controlled for
Define moderating variables
Included INTENTIONALLY because you want to see if it impacts the relationship between two variables
Define confounding variables
Threatens internal validity (EXTERNAL factors that influence both of your studies variables IV and DV) make it hard to understand true nature of relationship between your variables
Define “control for” in using statistics to control for third variables
Process of accounting for the influence of potential CONFOUNDING variable to see if that can explain the link between two variables
How to use statistics to control for third variables?
Look at the associations between each variable with what you’re actually looking at
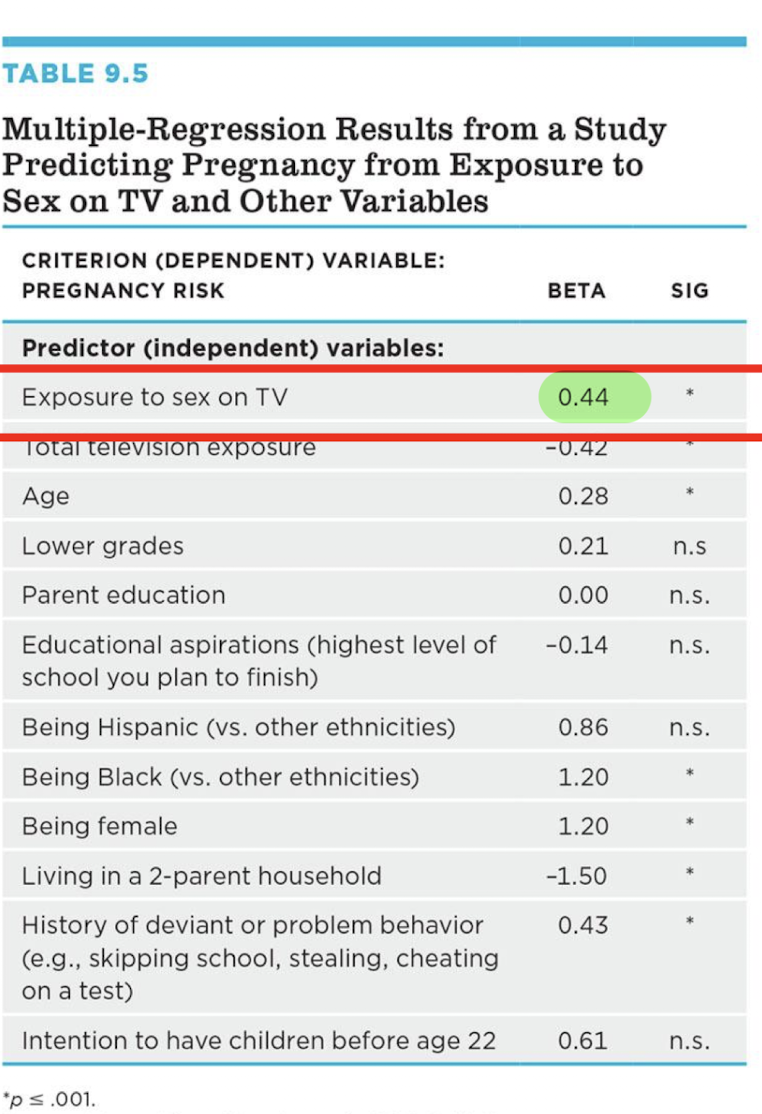
Ex: Experiment is looking at pregnancy risk and exposure to sexual TV content → to control for age they split all ages up and graphed them independently all ages saw a strong positive association so age is not explaining the relationship
What variables are used in a multiple regression test?
Criterion variables (ex. pregnancy risk) = outcome variable
Predictor variable (ex. TV content)
Don’t use IV and DV terms because we are not conducting a true experiment
What do you use to test for third variables?
Beta
Define beta
Represents the standardized coefficient in a regression analysis; it indicates the direction and strength of the relationship
TELLS DIRECTION AND STRENGTH OF THE RELATIONSHIP (just like r, but no cut offs for effective sizes, no guidelines)
You can compare betas to see which variable is strongest predictor in a single regression model
The effect of one variable on another while holding other variables constant
How does beta work?
B for X → Y tells you how much X predicts Y after controlling for Z (third variable)
If beta for X drops a lot / becomes not significant after adding Z → Z explains the relationship = third variable problem
Using beta to compare p-value
Sign
positive β → positive relationship
negative β → negative relationship
Size
larger absolute value → stronger effect
smaller value → weaker effect
Example
β = .50 → stronger than β = .20
STILL APPLIES:
p < .05 → significant
p ≥ .05 → not significant
Using beta to compare CI interval
Narrow CI → more precise estimate
Wide CI → less precise
Example
[.45, .55] → tight, high confidence
[.10, .80] → wide, less certain
STILL APPLIES:
CI does not include 0 → significant
CI includes 0 → not significant
Can you compare beta across multiple regression tables?
No, you can only compare beta strengths within a SINGLE regression table
What if beta is not significant?
You do not have strong evidence that the predictor variable affects the outcome after controlling for other variables
Key words to look for to determine whether a study is using regression
Controlled for
Taking into account
Adjusting for
Considering
Why does regression not establish causation?
Multiple regression is not foolproof, there can still be many unmeasured variables
How can we be more confident making casual claims?
Getting a causality with…
Pattern
Parsimony
How can we be more confident making casual claims by using pattern?
Looking at multiple studies, look for same patterns and results in multiple studies to make us more confident
How can we be more confident making casual claims by using parsimony?
Choosing the simplest explanation that accounts for the results
What do journalists do for confidence in making claims?
Journalists often do not always fairly represent pattern and parsimony, oftentimes journals are based on a single study which means they are selectively presenting only part of the scientific process
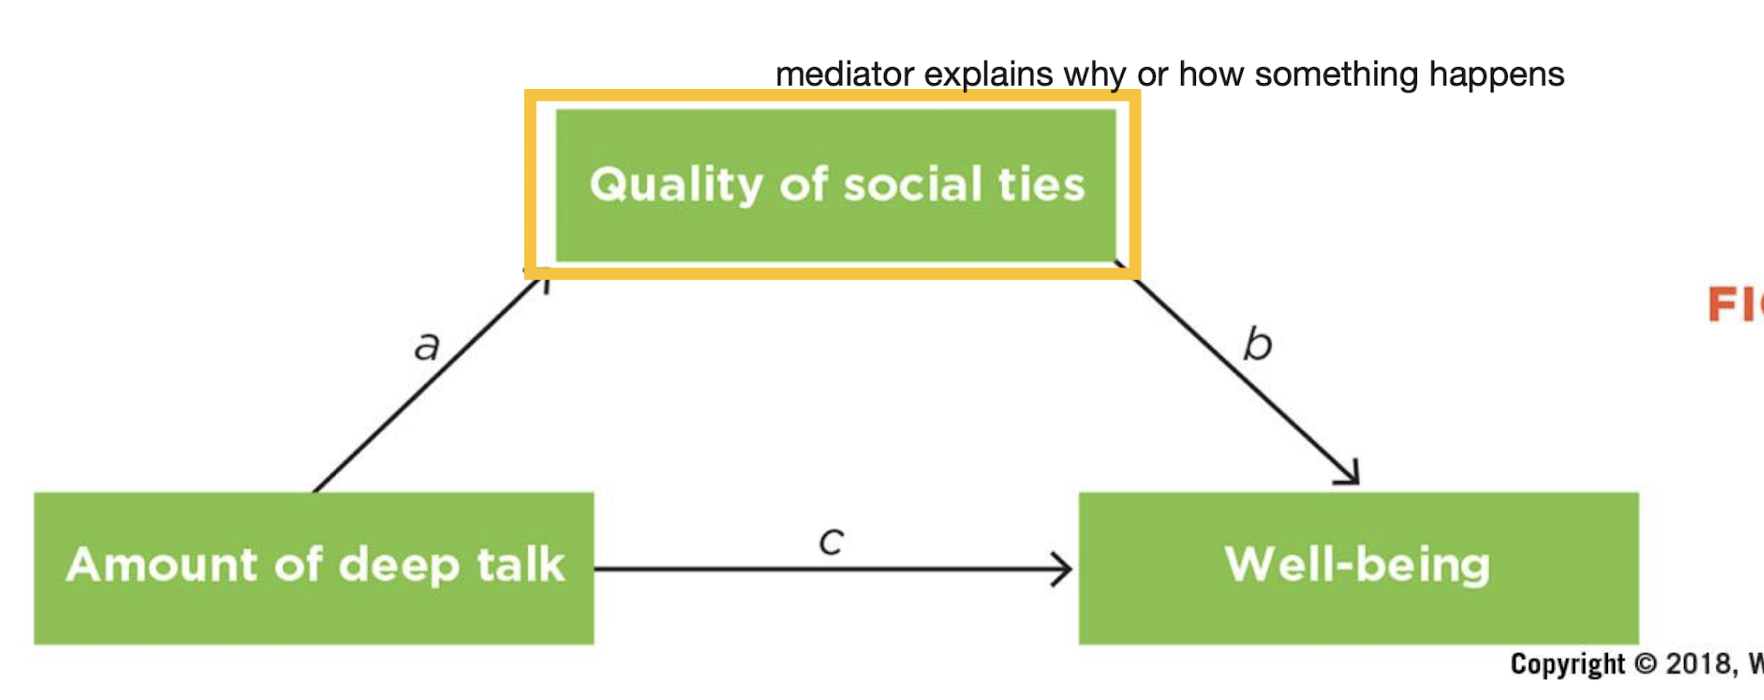
Define mediation/mediators
Variables that explain the process or mechanism through which an independent/predictor variable influences a dependent/criterion variable
Explains how they are linked, why or how something happens
Red = mediator
What are the similarities and differences between mediators and third variables (confounding variables)
Similarities
Both involve multivariate research designs
Both can be detected using multiple regression
Differences
Third variables are external to the bivariate correlation (problematic) → We do not want confounding variables
Mediators are internal to the casual variable (not problematic) → Mediators are helpful because they help us understand how something happens
What do mediators ask versus what moderators ask
Mediators
Ask “why” or “how”
Moderators
Ask “for whom” or “when”
Moderators help understand whether link between A and B can be applied to everyone or to who
Define quasi-experiment
A study similar to an experiment except the researchers do not have full experimental control
NO random assignment (Can be unethical/impractical/impossible)
Need to be cautious when making casual claims → Still good because most are conducted in real life setting
What are the four types of quasi-experimental research designs?
Nonequivalent control group posttest-only design
Nonequivalent control group pretest/posttest design
Interrupted time-series design
Nonequivalent control group interrupted time-series design
Define nonequivalent control group posttest-only design
Outcomes are compared between a treatment group and a non-randomly assigned control group, with measurements taken only after the intervention
No pretest, only look at changes in outcome after treatment given
Define nonequivalent control group pretest/posttest design
Outcomes are measured both before and after an intervention in a treatment group and non-randomly assigned control group
Has both a pre/post test
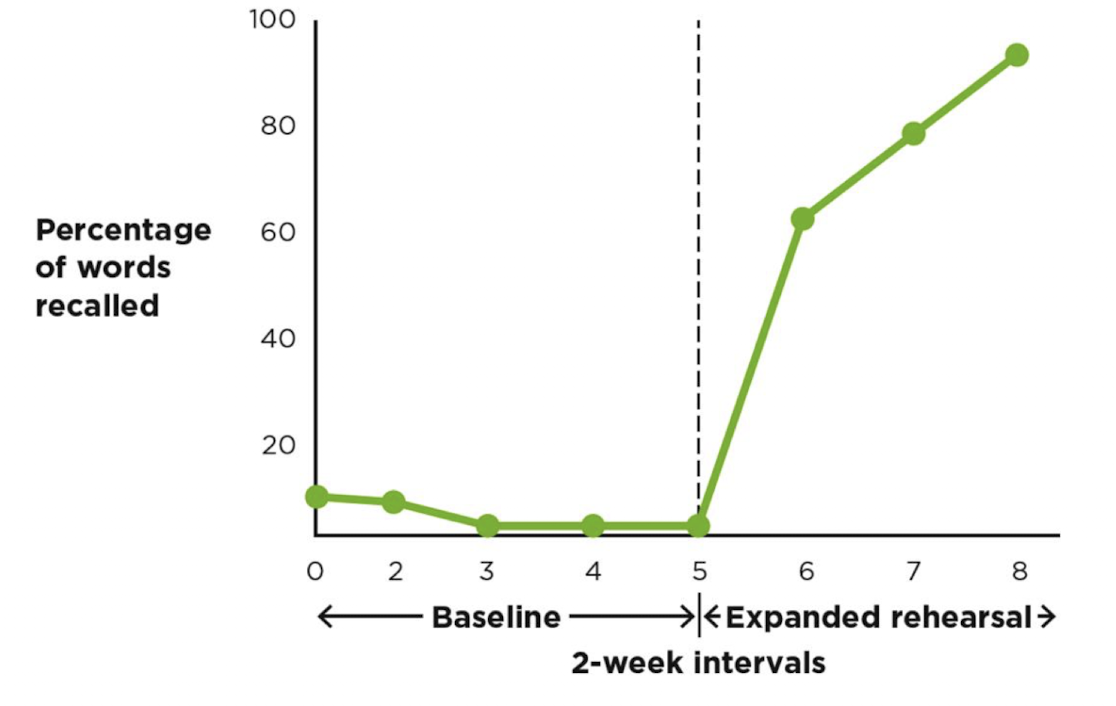
Define interrupted time-series design
Multiple measurements are taken before and after an intervention to assess its impact over time
No control group, measures given at multiple time points, measuring outcome multiple times throughout the study looking for changes in behavior
Define nonequivalent control group interrupted time-series design
Outcomes are repeatedly measured over time in both a treatment group and a non-randomly assigned control group before and after an intervention
How is internal validity impacted in quasi-experiments
Third variable problem since there are no random assignment
Selection effects: Due to pre-existing differences that exist between conditions, not treatment itself
Design confounds: Change bc they’re getting used to the study, just people changing over time
Maturation threat: Changes that occur naturally over time, not because of the experiment
History threat: External events or occurrences that take place during the course of a study can influence the results which affect participants behavior or responses
Regression to the mean
Attrition threat: important participants dropping out of study
Testing and instrumentation threats: When participants responses on a posttest measure are influenced by their exposure to the pretest measure + Changes in the instrument/observers which may produce changes in outcomes
Observer bias, demand characteristics, and placebo effects
Benefits/Balancing priorities in Quasi-experiments
Real-world opportunities
External validity is high
Ethics: allows us to do studies in an ethical way since there is no assignment of people to different conditions
Construct validity and statistical validity usually good (IV already defined, lower chance of random error bc more power w/ variability that comes with real-world data)
When are small N designs often used?
Applied settings (like therapeutic)
Each participant is treated separately (almost always repeated-measures designs)
When are large-N designs used
Both basic and applied research
Participants are grouped
Data from an individual are not of interest in themselves
What tradeoff exists in case study research?
Less control and replication in exchange for studying rare cases (Ex. human memory and seizures)
Define stable-baseline designs
A single-case experimental design where a treatment or intervention is introduced only after a stable baseline of behavior has been established through repeated pre-internvention measurements
SMALL N-DESIGN
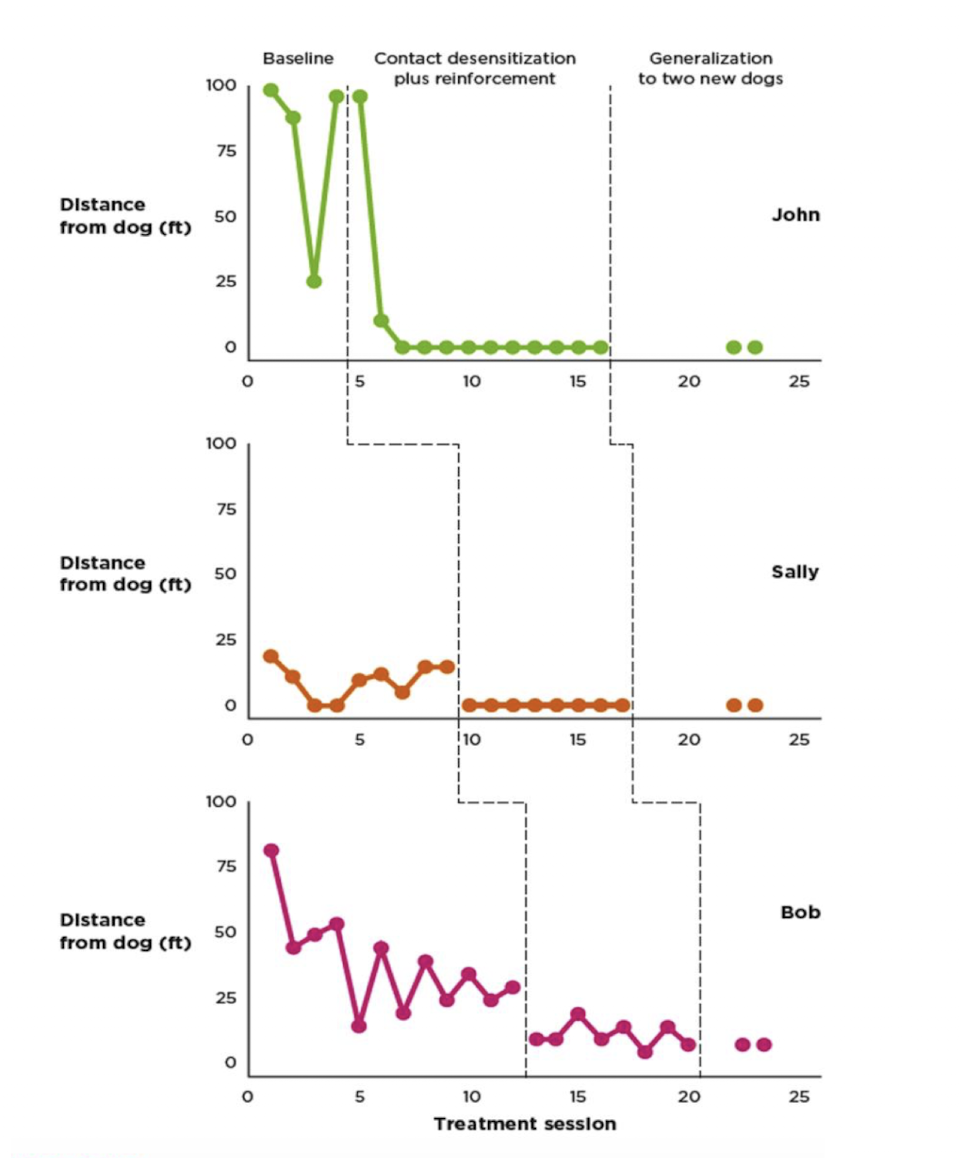
Define multiple-baseline designs
A single-case experimental design where the introduction of an intervention is staggered across different subjects, behaviors, or settings to demonstrate that changes in the dependent variable occur only after the intervention
SMALL N-DESIGN
Staggering intervention, so if you see change you can be confident it is causing change
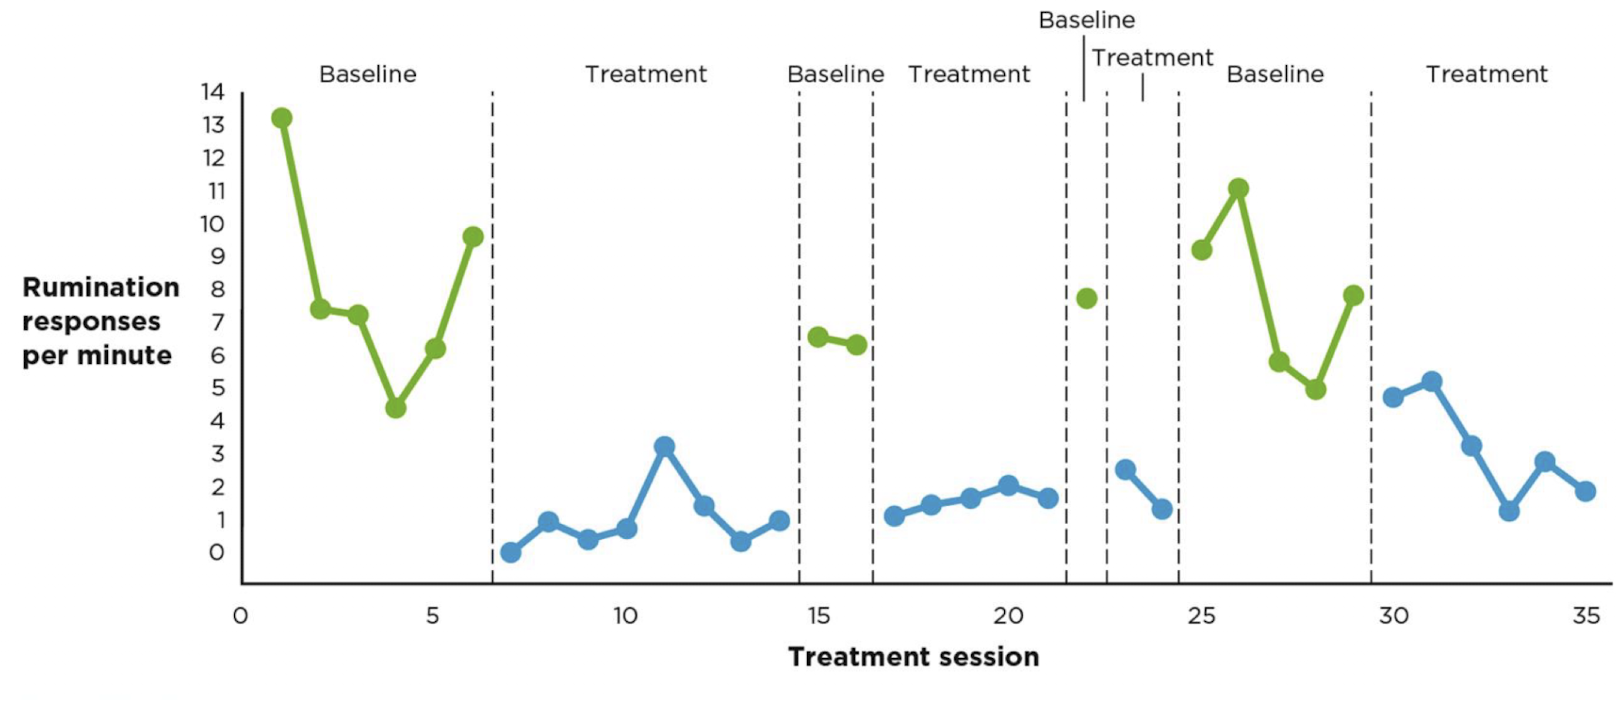
Define reversal designs
A single-case experimental design where an intervention is introduced and then withdrawn (reversed) to observe whether behavior returns to baseline
Stop treatment to see if behavior reverts back, only works if treatment doesn’t have a lasting impact
SMALL N-DESIGN
Evaluating the 4 validities in small-N designs
Internal validity
Can be very high if the study is carefully designed (ex. if using reversal design and see that behavior does reverse you can be confident)
External validity
Can be problematic depending on the goals of the study (suffer because you are not studying many people)
Construct validity
Can also be very high if definitions and observations are precise (Want to carefully define variables regardless of design)
Statistical validity
Not always relevant to small-N studies