Errors, Power, Effect Size, and Assumptions
1/18
Earn XP
Description and Tags
Type I and II errors, how significance level and power relate to these, factors affecting statistical power, using effect size to distinguihs between statistical and practical significance, assumptions underlying the 1-sample t-test
Name | Mastery | Learn | Test | Matching | Spaced | Call with Kai |
|---|
No analytics yet
Send a link to your students to track their progress
19 Terms
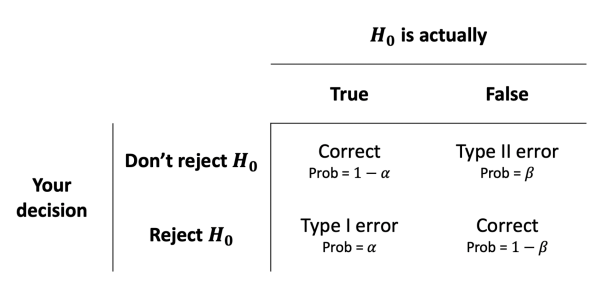
What is a type I error? How can this be prevented against?
Reject a true null hypothesis → have a low SL
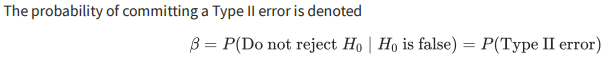
What is a type II error? How can this be prevented against?
Don’t reject a false null hypothesis → have a higher SL
Types of errors table
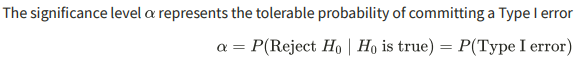
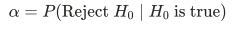
What is the significance level?
Probability of rejecting a true null hypothesis
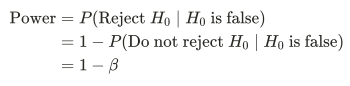
What does power mean?
Probability that the test correctly rejects a false null hypothesis
What factors affect power?
Sample size
Power increases as sample size increases
Due to the distributions of the sample stats becoming narrower + less stats on the left of the critical value
SL
Power increases as the value of SL increases
Effect size
Power increases when the true value of the parameter is farther from the hypothesised value in the null
In practice you cannot change the distance of the true parameter value from the null, so you can increase power by either taking a larger sample size, or making larger (BUT the latter isn’t good practice)
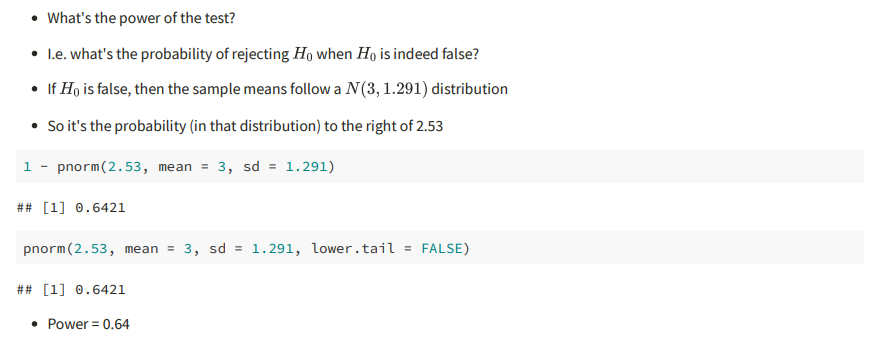
What is the code for calculating the power of a test?
What is there usually a trade-off between?
Significance level and errors
Decrease SL → harder to reject null → reduce probability of TI error
BUT would make TII errors more often
Increase SL → easier to reject null → reduce probability of TII error
BUT would make TI errors more often
Balance is set by how easy/hard it is to reject the null → determined by SL
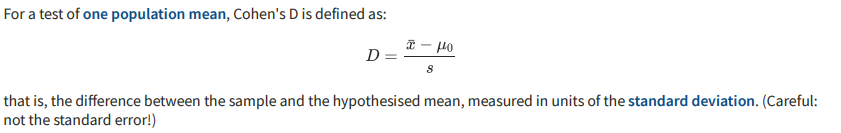
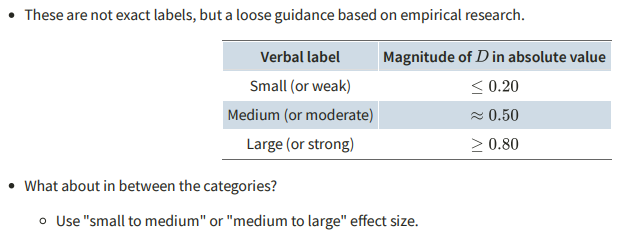
What is effect size related to?
The magnitude of the difference between the true population mean + the hypothesised value → gives a measure independent of the unit of measurement
What measured effect size?
Cohen’s D → reports whether the result may be of RW value of not
Effect size interpretation table
When are the results from a t-test for a population mean valid?
The obtained sample data are a random sample from the PoI (independence)
Either the population follows a normal distribution OR the sample size is sufficiently large (n >= 30) (normality)
What makes a sample randomly selected and valid?
Each unit should’ve been sampled independently of the others
Sample should rep the population (avoid bias)
What do we want to follow a normal distribution (normality)?
The sampling distribution of the sample mean
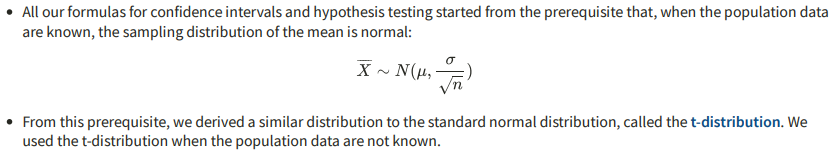
When is a t-distribution used?
When the population data aren’t known
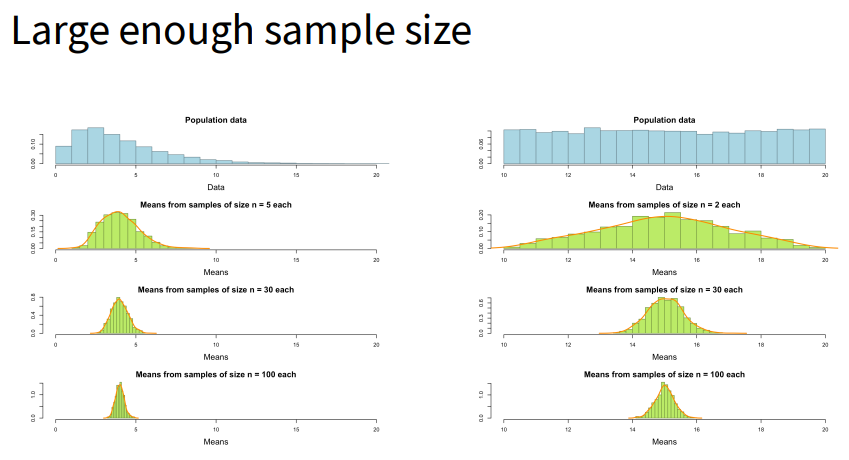
When is the sample mean normally distributed?
When EITHER:
The population data follow a normal distribution (irrespective of sample size)
OR
The sample size is large enough (>/= 30) (irrespective of the distribution of the population data)
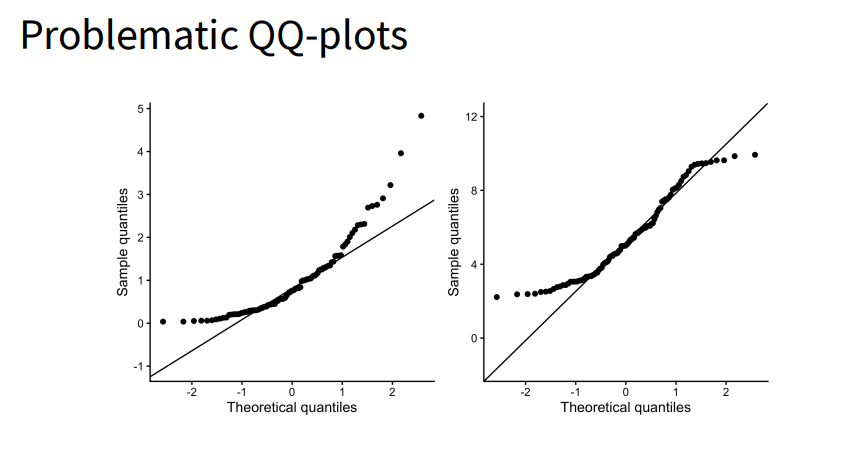
How do you check for normality of the population data?
Plot a graph → histogram, density plot, qq-plot (should roughly follow the line)
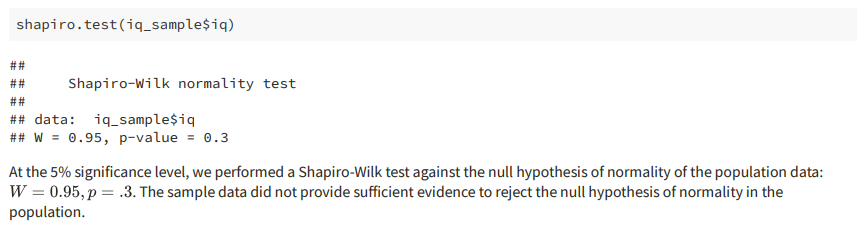
What us the Shapiro-Wilk normality test?
Another hypothesis test BUT:
The null states that the population data follow a normal distribution
The alt states that the population data don’t follow a normal distribution
What is the code for conducting a Shapiro-Wilk normality test?