3.3 revenue, costs, profits
1/47
There's no tags or description
Looks like no tags are added yet.
Name | Mastery | Learn | Test | Matching | Spaced | Call with Kai |
|---|
No analytics yet
Send a link to your students to track their progress
48 Terms
what is total revenue
TR = PxQ
The total amount of money a firm receives from selling a given quantity of a product.
what is marginal revenue
Marginal Revenue is the additional revenue gained by selling one more unit of a product. It is calculated by finding the change in total revenue when one more unit is sold.
MR= ΔTR / ΔQ
what is average revenue
The revenue per unit sold.
AR = TR / Q
The firm's demand curve is the same as its Average Revenue (AR) curve. Why? Because the price a firm charges is its average revenue per unit. If a firm sells 100 units for £10 each, its price is £10 and its average revenue is also £10.
why is AR the same as demand
Because the price a firm charges is its average revenue per unit. If a firm sells 100 units for £10 each, its price is £10 and its average revenue is also £10.
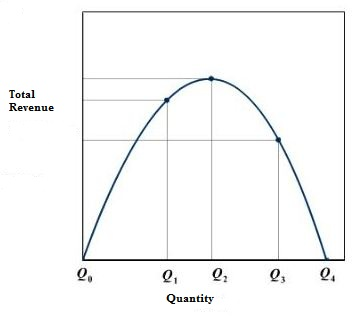
what is the shape of total revenue
either a diagonal line going up or a parabola
On a graph, the Total Revenue curve is typically a parabola, rising to a maximum point before falling. Why does it fall? To sell more units, a firm must lower its price. At some point, the effect of the lower price on revenue outweighs the effect of the higher quantity, causing total revenue to fall.
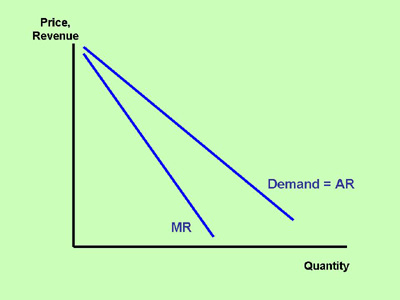
what is the shape of marginal revenue
half of AR
For a firm with a downward-sloping demand curve (i.e., most firms), the Marginal Revenue (MR) curve is always below the Average Revenue (AR) curve. Why is MR below AR? To sell one more unit, the firm must lower the price on all units it sells, not just the last one. This means the price received for the extra unit (MR) will be less than the price previously received for all other units (AR).
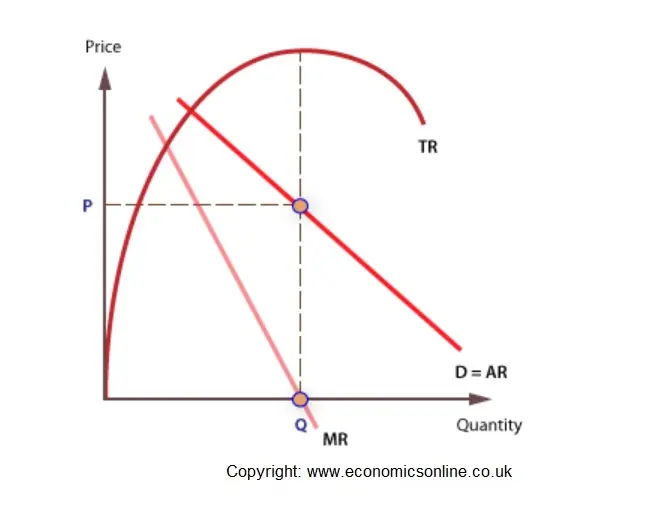
how are MR AR TR linked
When MR is positive, selling more units adds to total revenue, so the TR curve is rising. When MR is zero, selling one more unit adds nothing to total revenue. This is the point of maximum TR. When MR is negative, selling more units actually reduces total revenue. This means the TR curve is falling.
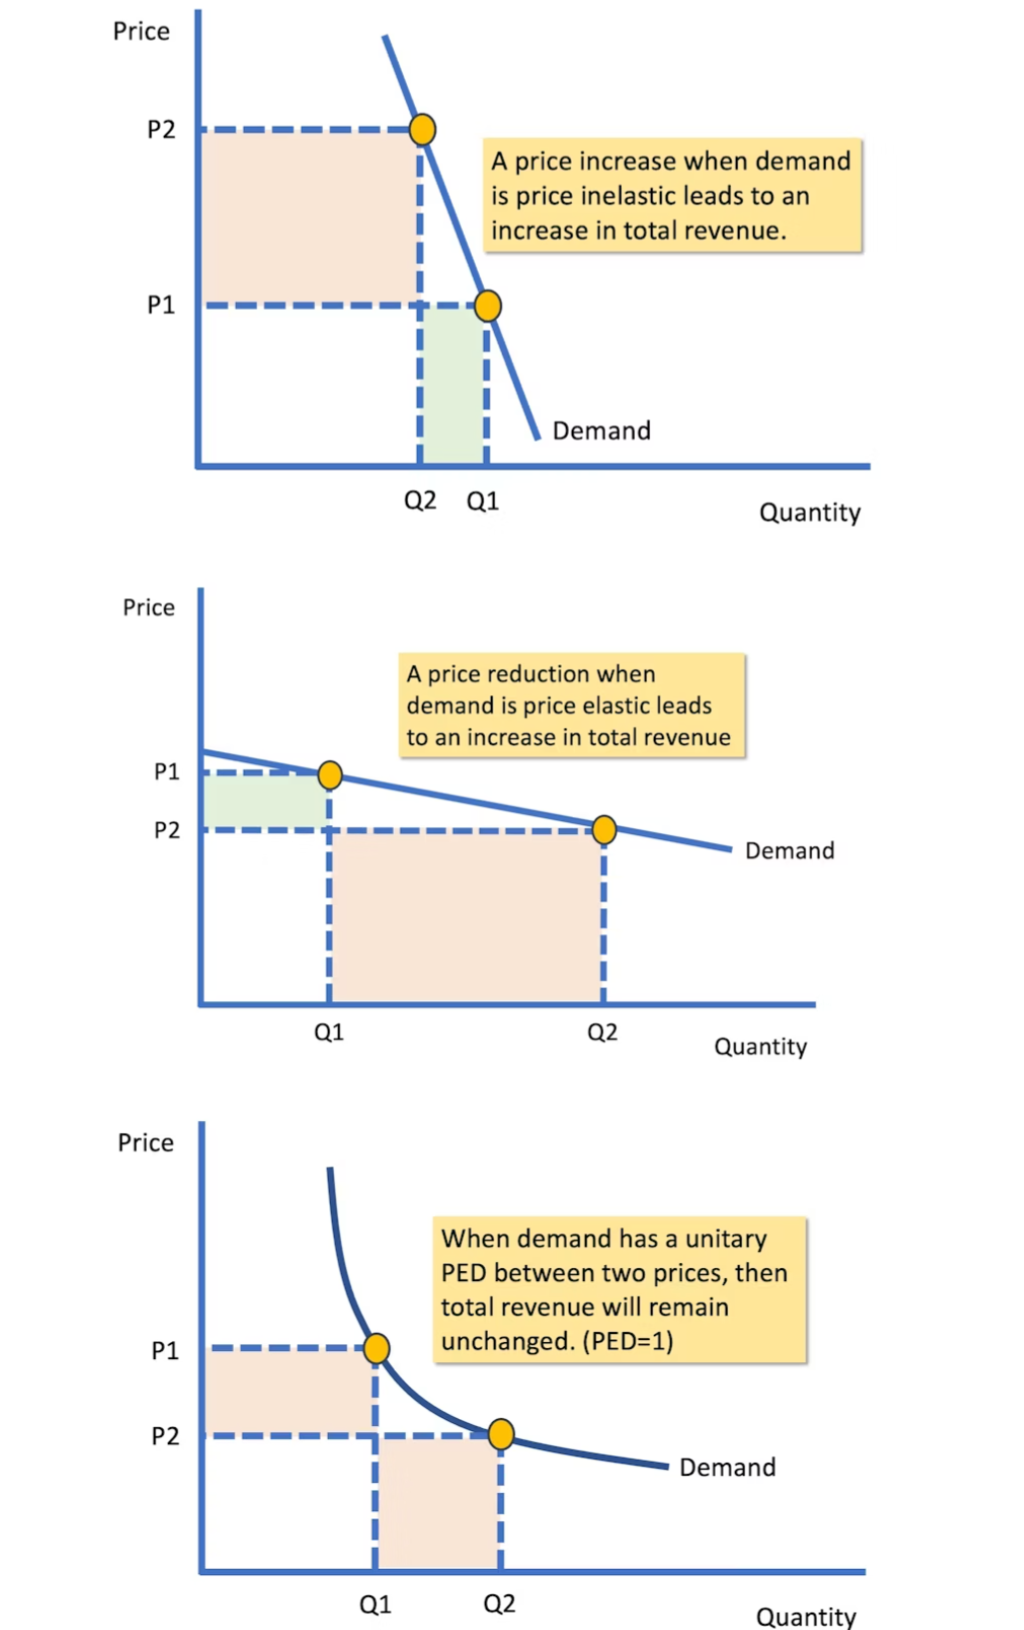
what is the relationship between PED and revenue
learnt in theme 1
An elastic PED means that revenue will increase when price is decreased. A fall in price will lead to a proportionally larger increase in quantity demanded. This increases Total Revenue.
An inelastic PED means that revenue will increase when price is increased. A fall in price will lead to a proportionally smaller increase in quantity demanded. This decreases Total Revenue.
Unitary elasticity - A change in price leads to an equal proportional change in quantity demanded. Total Revenue is maximised at this point. Maximum Total Revenue occurs where MR = 0 and PED = 1.

what are costs
Costs are the expenditures a firm incurs to produce its goods and services.
what are fixed costs
Fixed costs: are constant over a period of time and are not tied to production volume(output).
Examples of Fixed Costs:
Rent or mortgage payments: for a business location
Salaries: for permanent administrative staff
Insurance premiums: for the business
Property taxes
Depreciation: on machinery or buildings
Loan payments
what are variable costs
Variable costs: change in direct proportion to the level of production or sales.
Examples of Variable Costs
Raw materials: used in production
Direct labour wages: for hourly workers involved in production
Sales commissions paid to employees
Packaging materials
Utilities: (like electricity and water), were usage changes with activity
Shipping costs: for products
what is diminishing marginal productivity
In the short run, if a firm adds successive units of a variable factor of production (e.g., labour) to a fixed factor (e.g., capital), the marginal product of the variable factor will eventually decrease.
Example: A farmer with a fixed plot of land. The first few workers will greatly increase output. But eventually, the extra output from each new worker will be less than the previous one, as they start to get in each other's way.This is the key reason why short-run cost curves eventually rise.
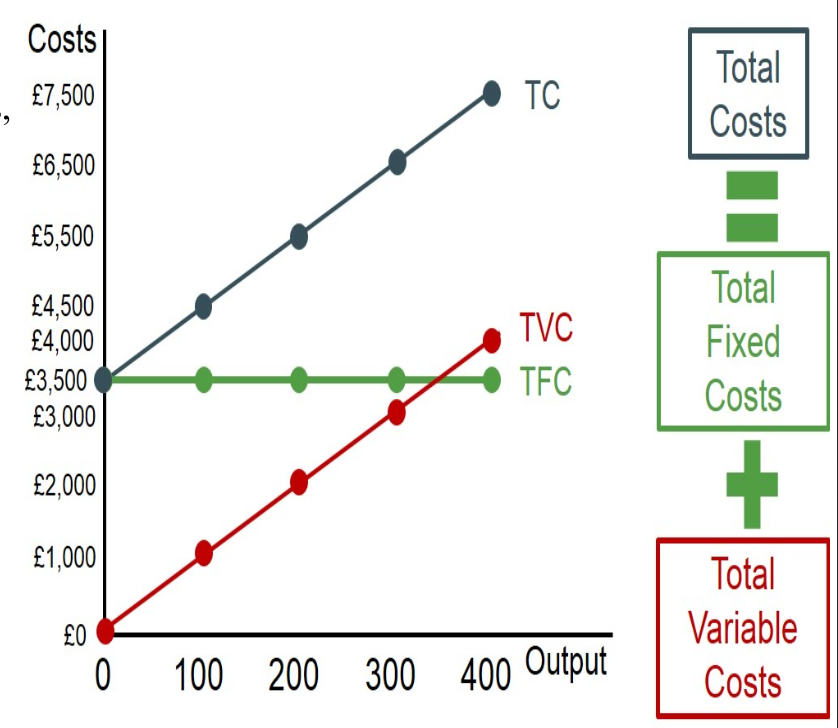
what is total fixed cost
Total Fixed Cost (TFC): Costs that do not vary with the level of output. These must be paid even if output is zero.
what is total variable cost
Total Variable Cost (TVC): Costs that vary directly with the level of output.
Formula: TVC per Unit X Q
what is total cost
Total Cost (TC): The sum of total fixed and total variable costs.
Formula: TC=TFC+TVC
what are the diagrams for TC, TFC, TVC
what is average fixed cost
AFC = TFC / Quantity of Output
what is average variable cost
AVC = TVC / Quantity of Output
what is marginal cost
Marginal Cost (MC): The change in total cost resulting from producing one additional unit of output. It is also the change in total cost from one additional unit of output.
Formula: MC= ΔTC/ΔQ
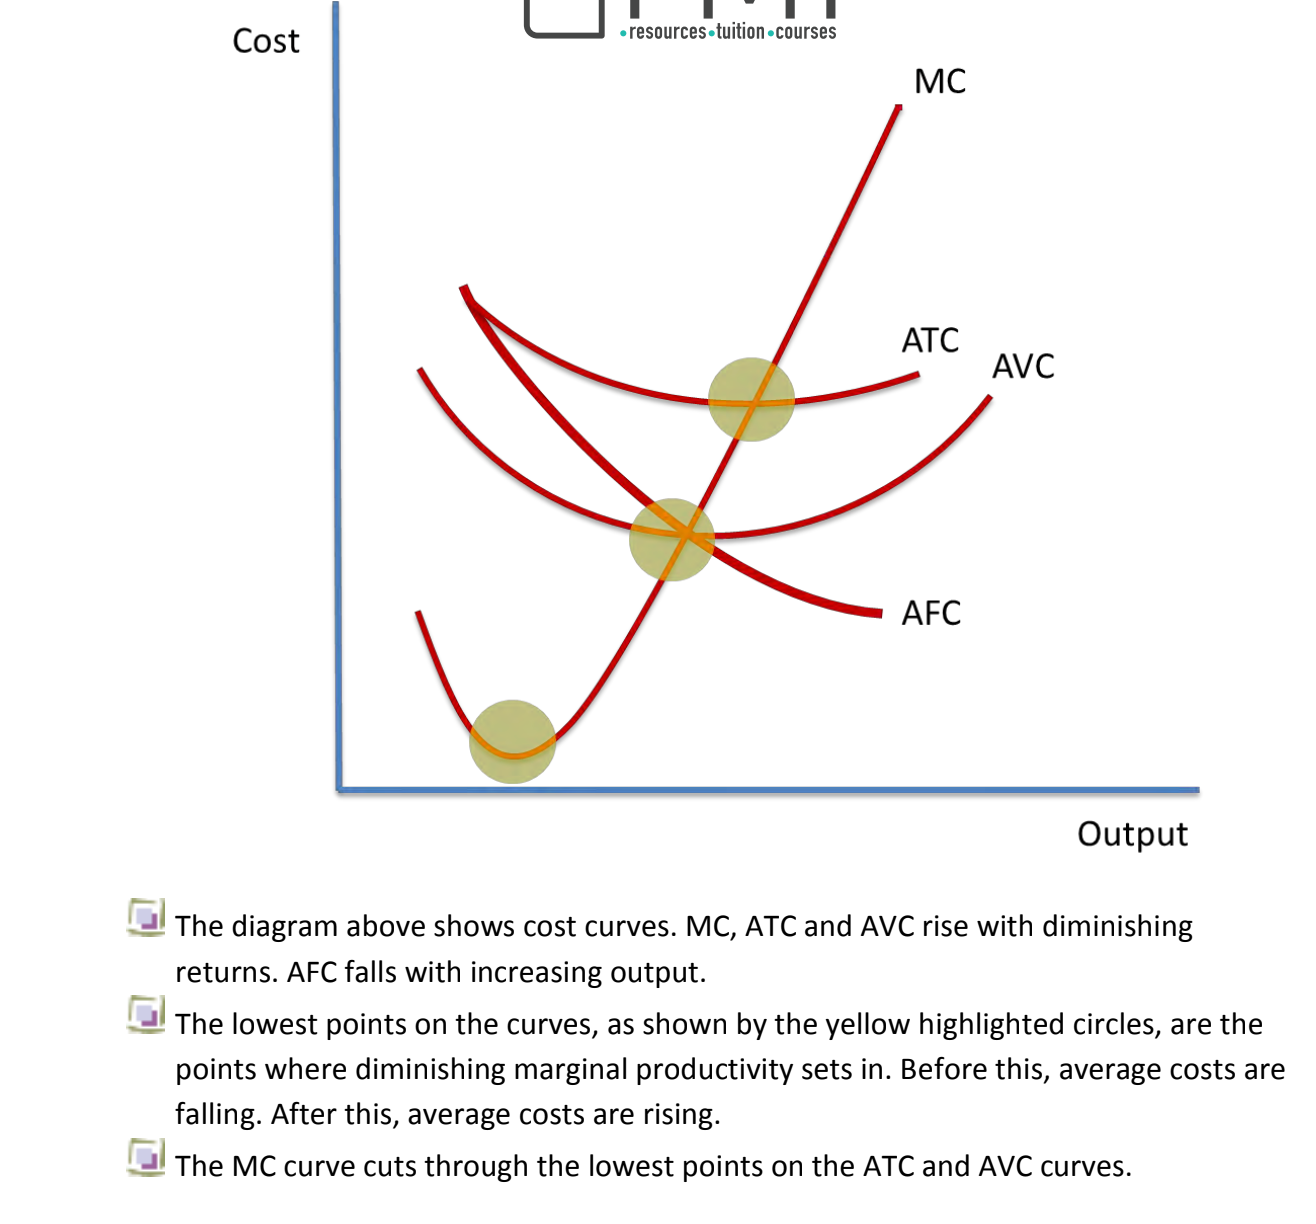
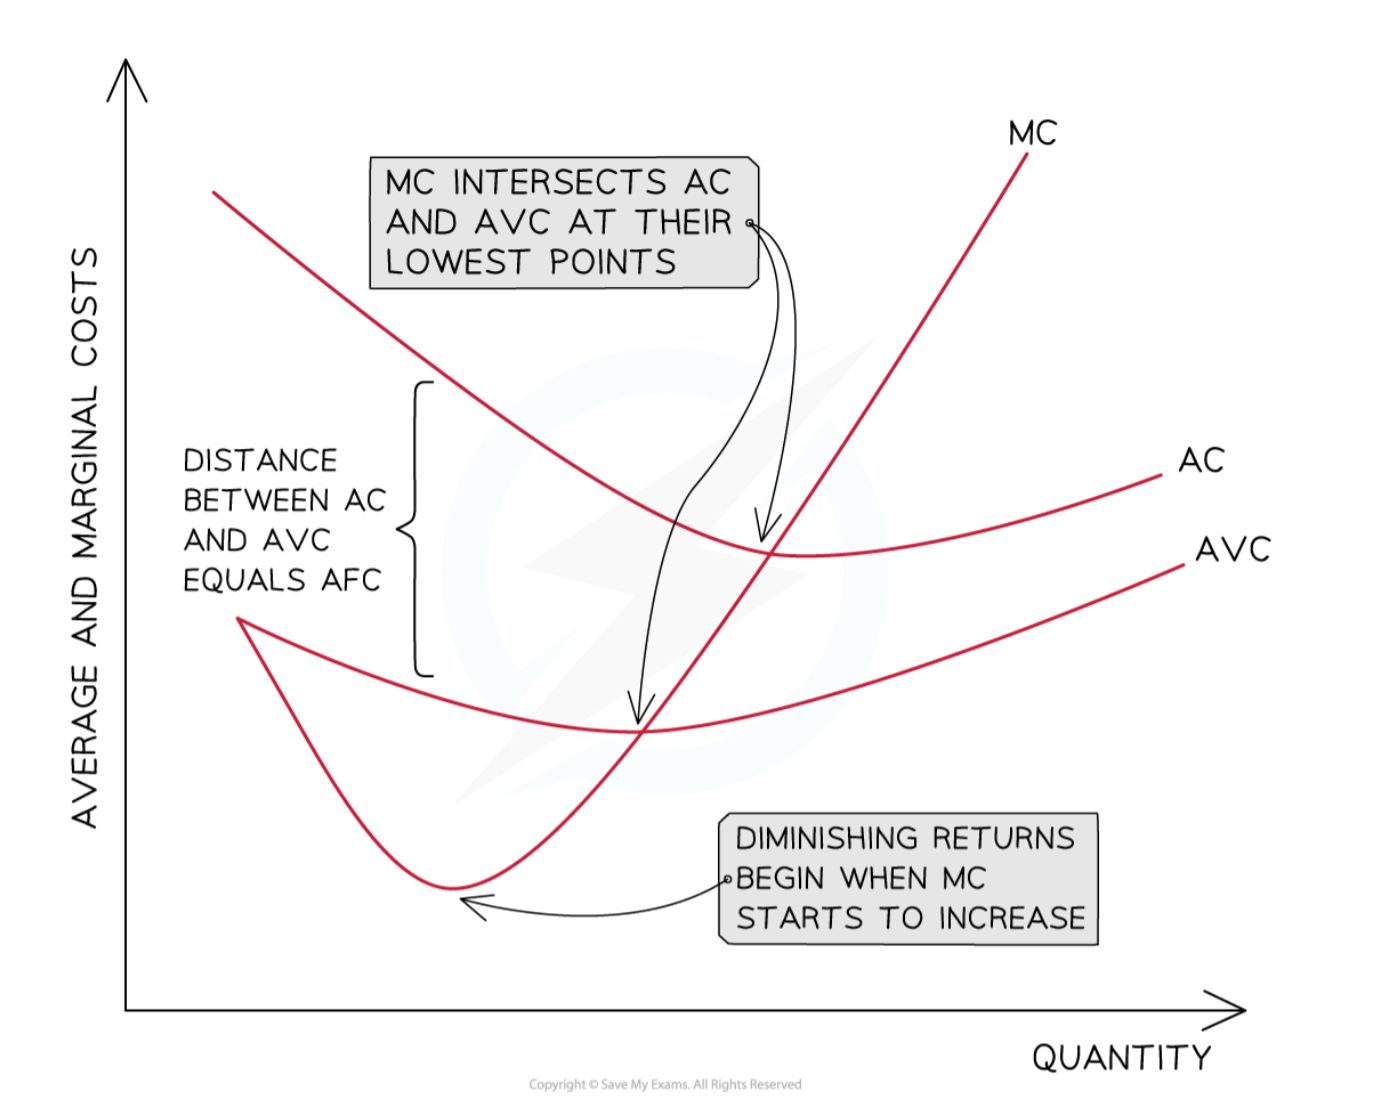
what is the relationship/diagram for MC, ATC, AFC, AVC (cost curves)
The MC curve is typically a "tick" shape. It falls initially and then rises sharply. The AVC and AC curves are U-shaped. They fall as output increases, reach a minimum point, and then rise again. The MC curve intersects both the AVC and AC curves at their minimum points. As long as the cost of the next unit (MC) is lower than the average cost, the average will be pulled down. When the cost of the next unit (MC) becomes higher than the average, the average will be pulled up.
what are economies of scale
Economies of scale are the cost advantages that a firm can gain by increasing the scale of its production. As output increases, the long-run average cost (LRAC) of a firm decreases.
what are diseconomies of scale
Diseconomies of scale occur when a firm's costs rise as it increases its scale of production. This topic helps us understand the shape of the long-run average cost curve.
what are internal economies of scale
Cost savings that a firm experiences because of its own growth. They are internal to the firm itself. These economies occur when a firm increases its output and moves down its LRAC curve.
what are the types of internal economies of scale
Really Fun Mums Try Making Pies
Risk-bearing economies
Financial economies
Managerial economies
Technical economies
Marketing economies
Purchasing economies
what are risk-bearing economies of scale
Larger firms may be better equipped to handle unexpected market fluctuations and risks, reducing the overall cost of risk management. Larger firms can diversify their products and markets to spread risk.
Example: A multinational company like Coca-Cola sells a wide range of soft drinks and food products in many different countries. If one product or market performs poorly, its overall profits are protected by its other operations.
what are financial economies of scale
Larger firms may have access to more favorable financing options, including lower interest rates on loans and better terms from suppliers due to their size and financial stability. Banks are willing to lend loans more cheaply to larger firms, because they are deemed less risky. Therefore, larger firms can take advantage of cheaper credit.
what are managerial economies of scale
Larger firms may benefit from having specialized management teams, better coordination, and more efficient decision-making processes. This can result in cost savings and increased efficiency. Larger firms are more able to specialise and divide their labour. They can employ specialist managers and supervisors, which lowers average costs.
what are technical economies of scale
These occur when a firm can produce goods or services more efficiently as it increases its scale of production. Factors such as specialization of labor, better utilization of machinery, and improved production processes can lead to technical economies of scale. Larger firms can afford to invest in more advanced and productive machinery and capital, which will lower their average costs.
what are marketing economies of scale
As firms grow larger, they often have more resources to allocate to marketing and advertising efforts. This can lead to lower advertising costs per unit sold and increased market presence. Larger firms can divide their marketing budgets across larger outputs, so the average cost of advertising per unit is less than that of a smaller firm.
what are purchasing economies of scale
Larger firms can bulk-buy, which means each unit will cost them less. For example, supermarkets have more buying power from farmers than corner shops, so they can negotiate better deals.
what are internal diseconomies of scale
An increase in a firm's average costs of production as a result of a firm becoming too large. These occur when a firm increases its output and moves up its LRAC curve. The main reasons are due to management and communication problems.
how can communication breakdown cause diseconomies of scale
As a firm grows, more layers of management are created. Information can become distorted as it passes down the chain of command, leading to mistakes, delays, and poor decision-making.
how can coordination and control lead to diseconomies of scale
Larger firms often struggle to maintain effective control and coordination among various departments and divisions, leading to inefficiencies and higher costs.
how can worker alienation and lack of motivation lead to diseconomies of scale
In very large organisations, employees may feel disconnected from the company, which can result in lower productivity, higher turnover rates and increased absences.
what are external economies of scale
External Economies of Scale: These are cost savings that benefit all firms within a particular industry or area, not just a single firm.
Example: The clustering of technology firms in Silicon Valley allows them to benefit from a highly skilled labour pool, specialised infrastructure, and easier access to venture capital.
Or - local roads might be improved, so transport costs for the local industries will fall.
what are external diseconomies of scale
External Diseconomies of Scale: These occur when the growth of an entire industry or location leads to increased costs for all firms.
Example: A rapid increase in manufacturing firms in one region can lead to traffic congestion, making transport more expensive and causing shortages of skilled labour, driving up wages for all firms.
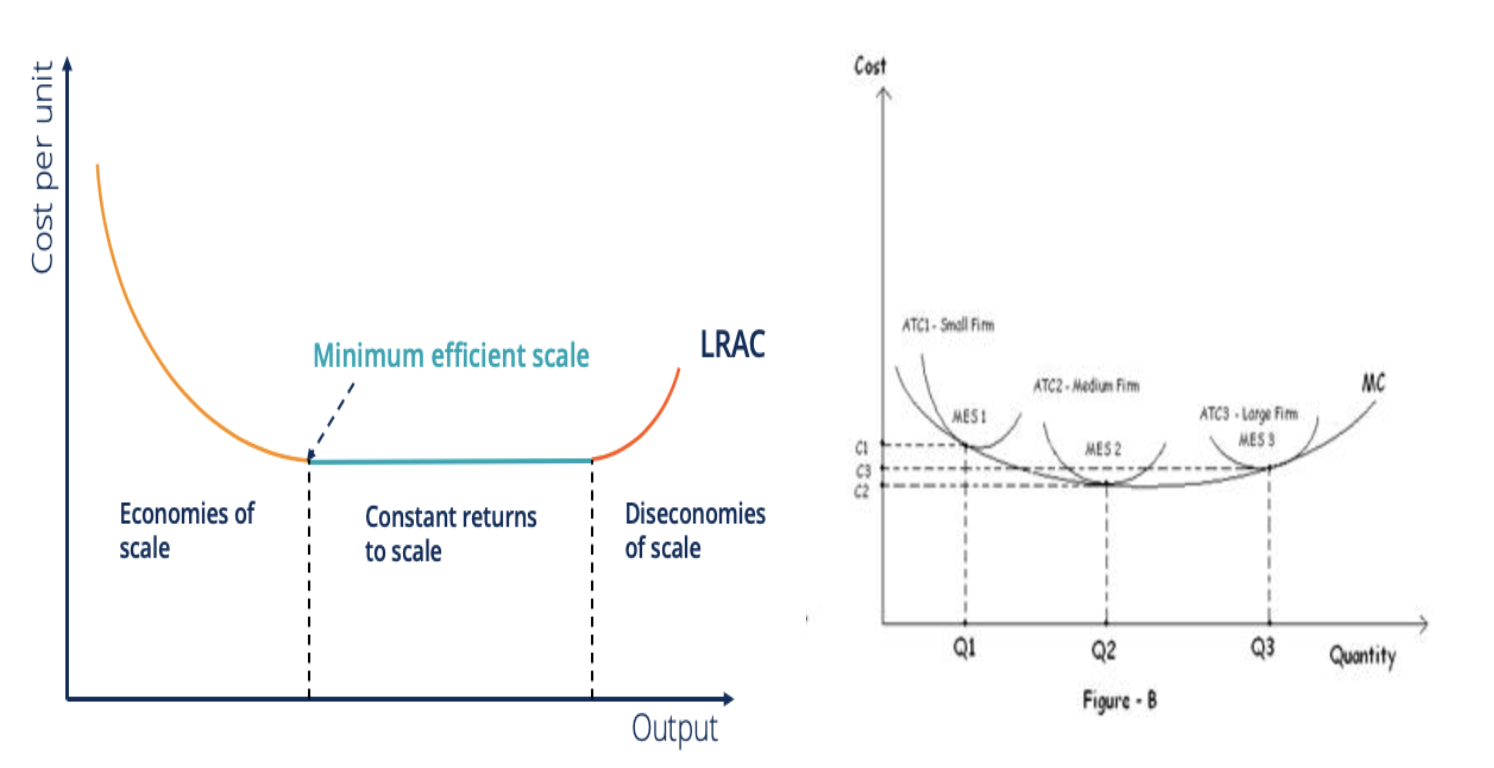
what is the minimum efficiency scale
The Minimum Efficient Scale (MES) is the level of production at which a firm achieves the lowest possible long-run average cost per unit of output. In other words, it is the point at which economies of scale are fully realised, and any further increase in production would result in diseconomies of scale.
When a firm operates at or near its MES, it can produce goods or services at the lowest cost, making it highly competitive. Firms that operate below their MES may not be able to compete effectively due to higher production costs, while those operating above it may experience inefficiencies and increased costs.
On diagram: The lowest point on a firm's long-run average cost curve.
what does a high MES mean
High MES (relative to market size): This means that a large output is needed to achieve lowest average costs, leading to high barriers to entry and fewer, larger firms. This often results in oligopolistic or monopolistic market structures.
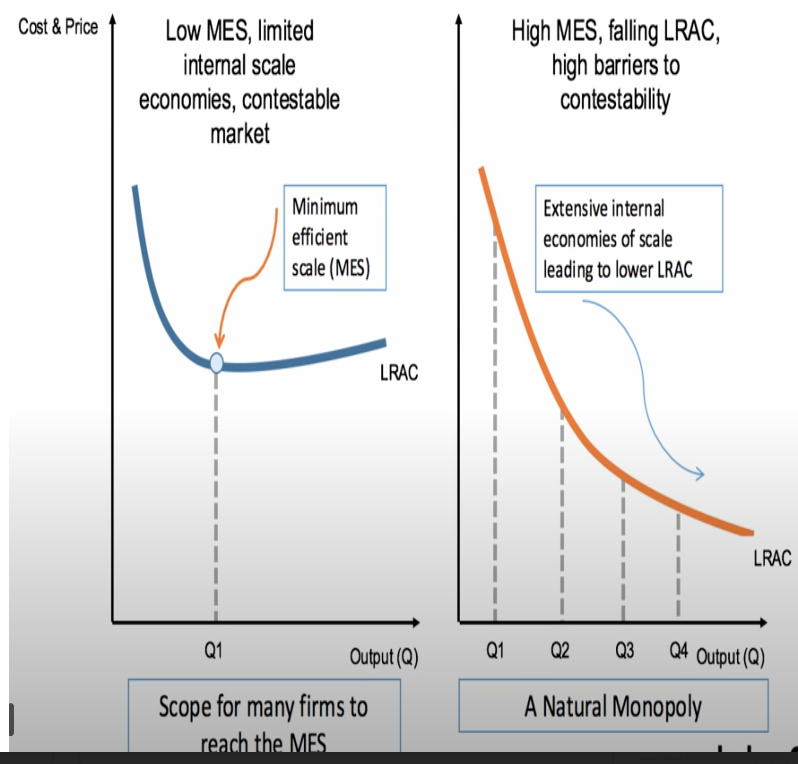
what does a low MES mean
Low MES (relative to market size): This indicates that a small output can achieve low average costs, leading to lower barriers to entry and a more competitive market with many smaller firms.

what is profit
A measure of profitability that considers all costs, both explicit and implicit.
Formula: Total Revenue - (Explicit Costs + Implicit Costs).
Includes both explicit costs and implicit costs.
Profit is the difference between total revenue and total cost. It is the reward that entrepreneurs yield when they take risks.
what are implicit costs
Implicit Costs (Opportunity Costs): The potential value or earnings forgone by choosing one alternative over another, such as the owner's potential salary from working for another company.
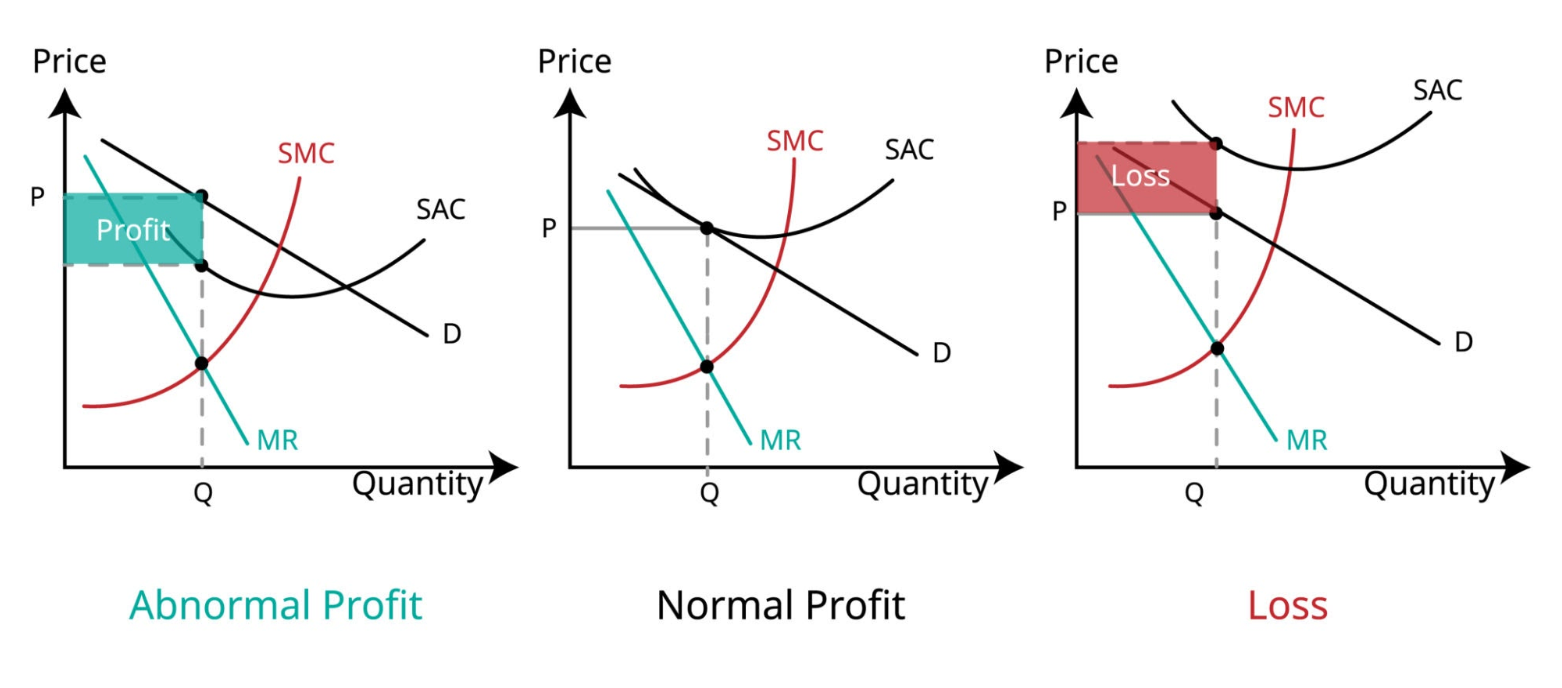
what is normal profit
Essentially break-even - it is the cost required for a firm to stay in the industry, covering all their costs, as well as opportunity cost. There is no additional profit gained.
It is equal to cost/opportunity cost.
Occurs where TR=TC or AR=AC
what is supernormal profit
SNP is profit earned in excess of normal profit
AKA economic profit, abnormal profit
This situation is generally temporary, as it attracts competition, which can drive down prices and reduce economic profit over time.
Occurs where TR>TC or AR>AC
what is a loss
AKA subnormal profit
When a firm spends more on its inputs than it earns from its output. Losses can lead to a firm shutting down in the short run if it cannot cover its variable costs. Likely will shut down in long run.
Occurs where TR < TC or AR < AC.
what are the conditions for profit maximisation
MR = MC: In the short run, a profit-maximizing firm produces the quantity of output where marginal revenue (MR) equals marginal cost (MC). In other words, the firm should continue producing as long as the additional revenue generated from selling one more unit of output is greater than or equal to the additional cost of producing that unit.
In the long run, under perfect competition, the condition for profit maximization is slightly different: 1. P = MR = MC: In the long run, in a perfectly competitive market, firms produce where the price (P) equals both marginal revenue (MR) and marginal cost (MC). This ensures not only profit maximization but also that firms do not enter or exit the industry in the long run.
what is the long run shutdown point
In the long run, all costs are variable. There are no fixed costs.
A firm must shut down if TR<TC or AR<ATC
The long-run shut-down point is the lowest point on the ATC curve.
Show the demand curve (AR) intersecting the lowest point of the ATC curve. This is the long-run shut-down point. Explain that if the price falls below this point, the firm will exit the market in the long run.
If the firm cannot even earn normal profits in the long run (i.e., cover all its costs), it would be better off allocating its resources to another market.
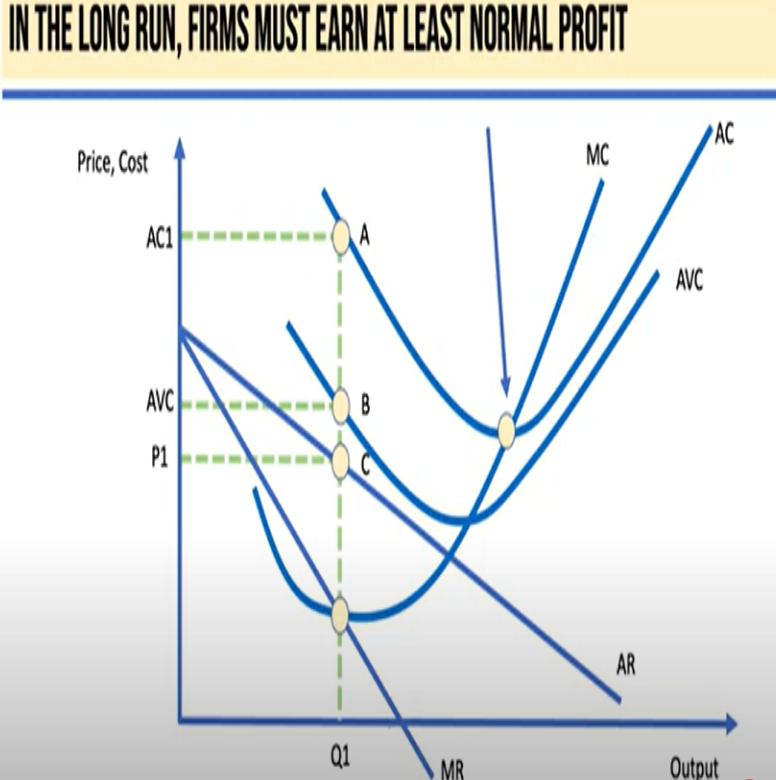
what is the short run shutdown point
in the short run, as long as TR is greater than or equal to AVC, the firm can stay in business
this is also where AR=AVC, or if P>AVC
By continuing to produce, the firm can at least cover its variable costs and use the remaining revenue to pay off some of its fixed costs. If it shuts down, it has to pay all its fixed costs anyway.
The short-run shut-down point is the lowest point on the AVC curve.
Draw a diagram with the ATC, AVC, and MC curves.
Show the demand curve (AR) intersecting the lowest point of the AVC curve. This is the short-run shut-down point.
Explain that if the price falls below this point, the firm should shut down
[The short run is a period where at least one of the firm’s inputs is fixed, resulting in fixed costs incurred despite the decision to shut down.]
![<p>in the short run, as long as TR is greater than or equal to AVC, the firm can stay in business</p><p>this is also where AR=AVC, or if P>AVC</p><p><span><span>By continuing to produce, the firm can at least cover its variable costs and use the remaining revenue to pay off some of its fixed costs. If it shuts down, it has to pay all its fixed costs anyway.</span></span></p><p><span><span>The short-run shut-down point is the lowest point on the AVC curve.</span></span></p><ul><li><p><span><span>Draw a diagram with the ATC, AVC, and MC curves.</span></span></p></li><li><p><span><span>Show the demand curve (AR) intersecting the lowest point of the AVC curve. This is the short-run shut-down point.</span></span></p></li><li><p><span><span>Explain that if the price falls below this point, the firm should shut down</span></span></p></li></ul><p></p><p>[The short run is a period where at least one of the firm’s inputs is fixed, resulting in fixed costs incurred despite the decision to shut down.]</p>](https://knowt-user-attachments.s3.amazonaws.com/f51d2ff8-1dbd-464d-953d-3d211cd93dea.png)
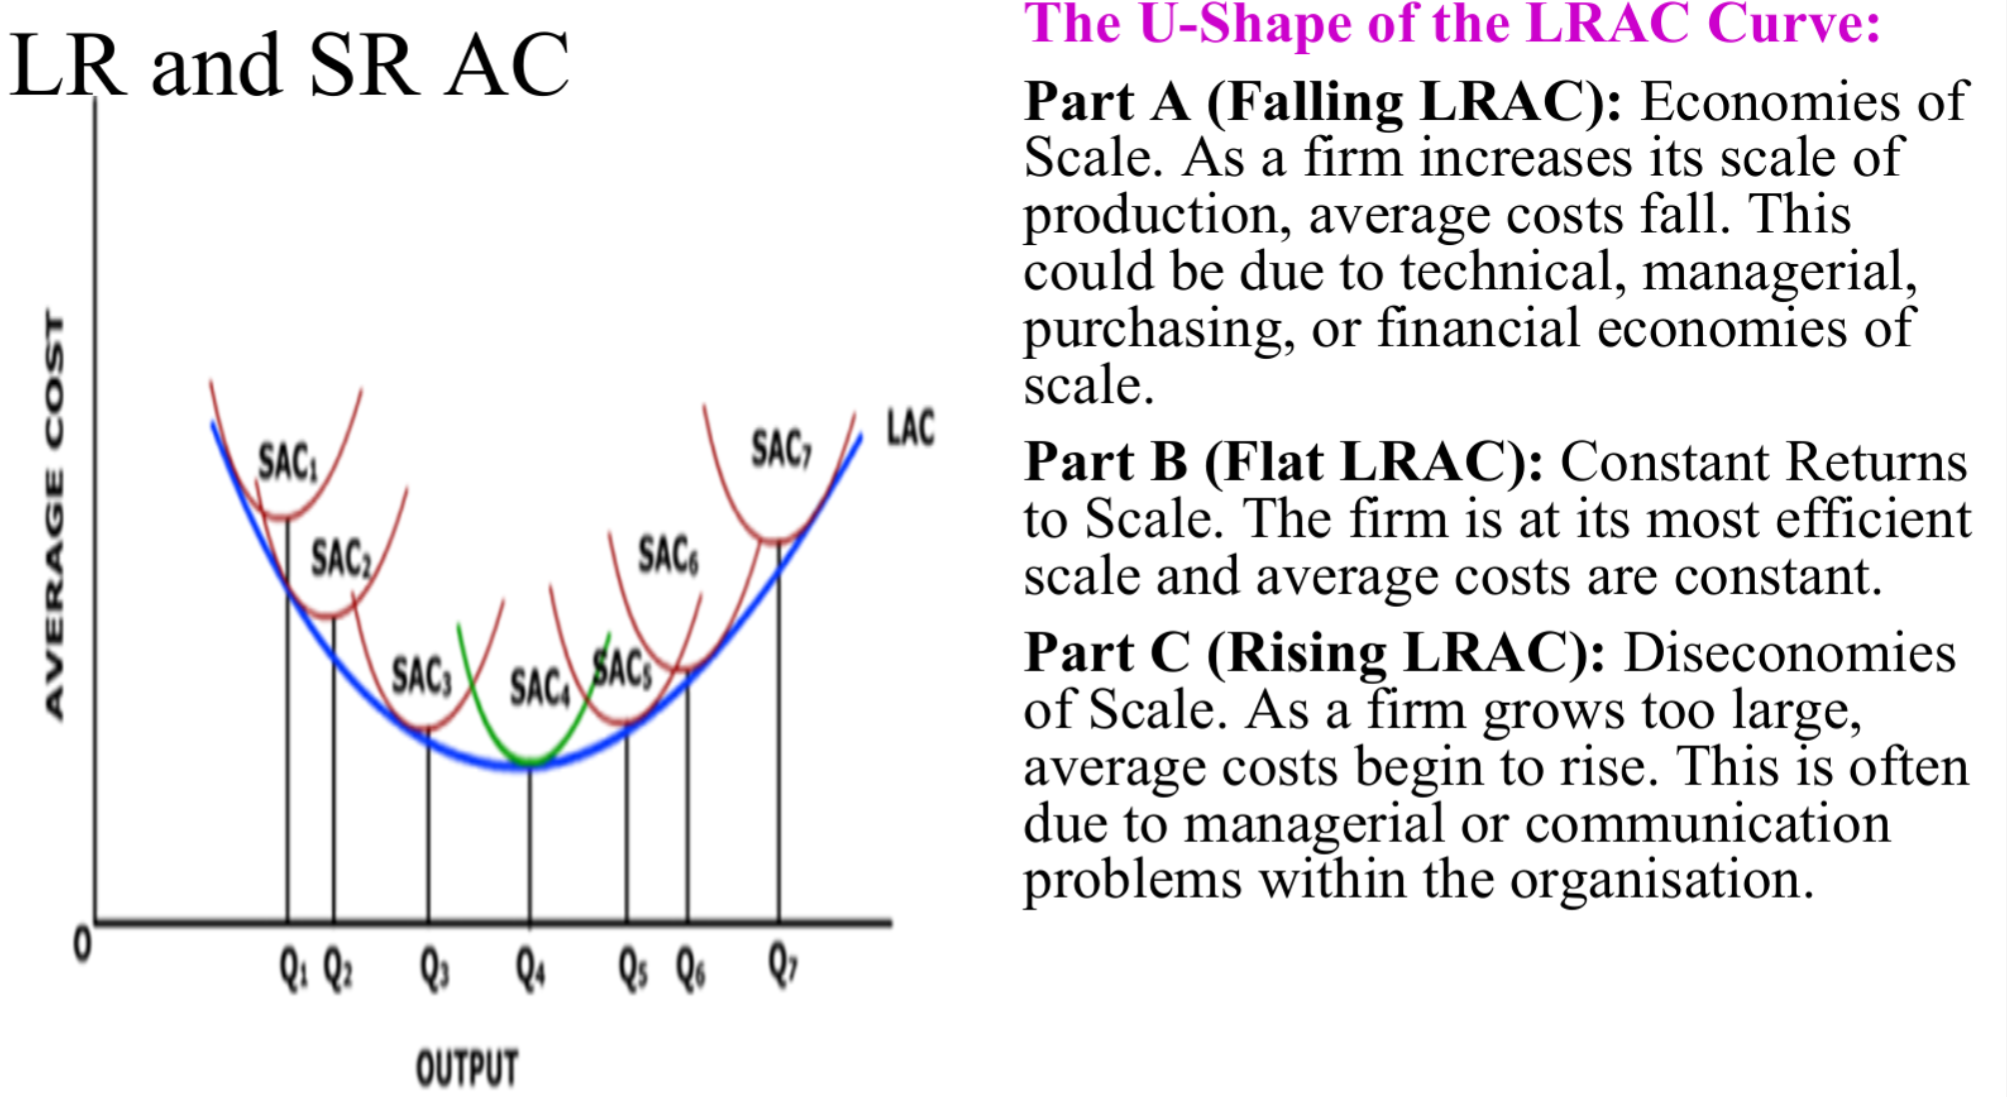
what is the relationship between short run and long run average cost curves
In the long run, a firm aims to produce at the lowest possible average cost, so LAC represents the envelope of all possible SAC curves.
The LAC curve is tangent to the lowest point of the SAC curves at each level of output.