2.11 (3) Market Power in Perfect Competition
1/21
There's no tags or description
Looks like no tags are added yet.
Name | Mastery | Learn | Test | Matching | Spaced | Call with Kai |
|---|
No analytics yet
Send a link to your students to track their progress
22 Terms
Market power
Ability of a firm to influence and control the conditions in a specific market
Significant impact on price, output, and other market variables
Why is market power low in perfect competition?
Many firms compete and sell identical products
No single firm can influence price
Firms have low market share and low concentration ratios
High competition reduces market failure and improves efficiency
How do firms maximise profit in perfect competition?
Firms maximise profit where:
MC=MR
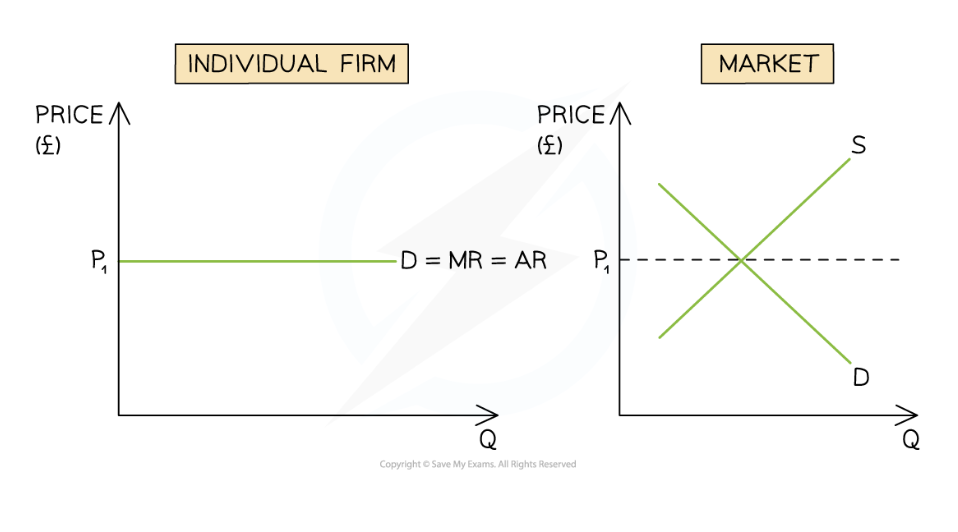
Firms are price takers because there are many sellers
Firms have no market power and cannot influence price
Selling price equals market price:
P=MR=AR=D
Diagrammatic Representation of Perfect Competition
What happens to profits in perfect competition in the short run and long run?
In the short run, firms may make:
abnormal profit
losses
In the long run, firms return to normal profit due to free entry and exit of firms in the market
Why do firms move from abnormal profit in the short run to normal profit in the long run in perfect competition?
Abnormal profits attract new firms into the industry
Firms are incentivised by the opportunity to earn supernormal profit
There are low/no barriers to entry
Increased competition reduces profits back to normal profit in the long run
Diagram Moving from Abnormal Profit in the Short-run to Normal Profit in the Long-run
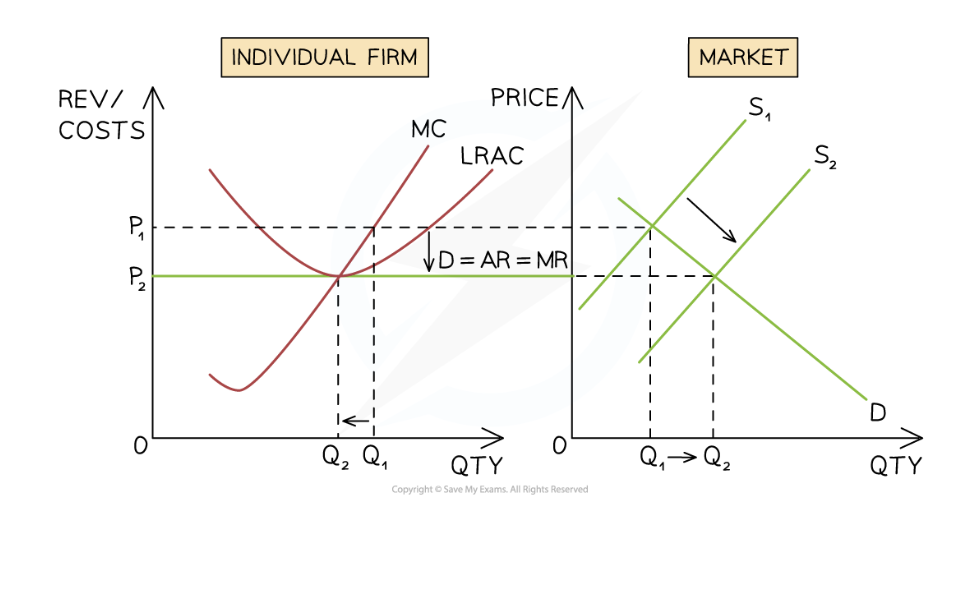
Diagram analysis — Short-run abnormal profit in perfect competition
The firm initially profit maximises where:
MC=MR
→ at output Q1
At this level of output:
AR(P1)>AC
→ so the firm earns abnormal/supernormal profit
The firm is incentivised by profit and new firms are attracted into the industry
Diagram Analysis — Entry of new firms in perfect competition
New firms entering increase market supply:
S1→S2
Industry output increases:
Q1→Q2
Market price falls:
P1→P2
As a price taker, the firm must now sell at the lower industry price P2
The firm’s output and market share fall:
Q1→Q2
Diagram Analysis — Long-run equilibrium in perfect competition
The firm still profit maximises where:
MC=MR
The firm is now producing where:
AR=AC
Abnormal profit has been eliminated
The firm earns normal profit in the long run
Firms making losses leave the industry, while abnormal profits attract new entrants until only normal profit remains
Losses in Perfect Competition in the Short-run
Firms in perfect competition are able to make losses in the short-run
Diagram Losses in Perfect Competition in the Short-run
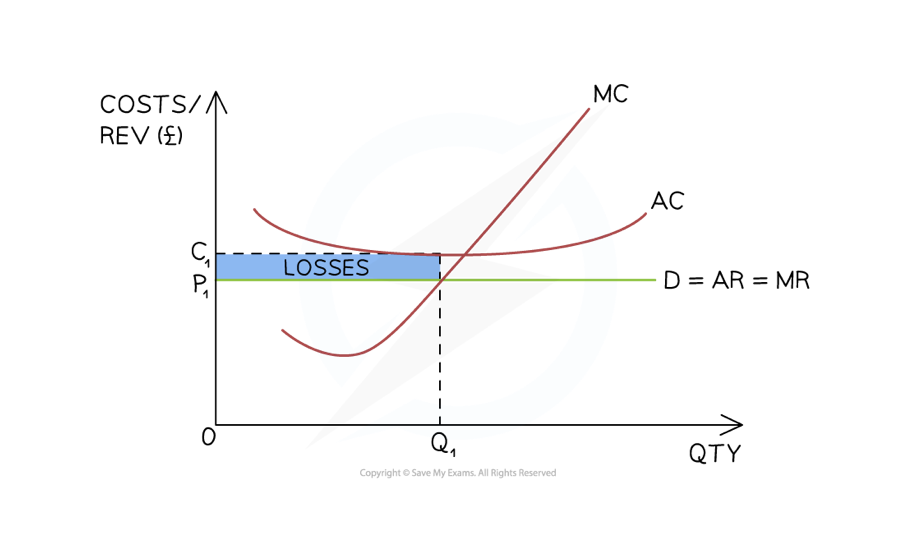
Diagram Analysis in Perfect Competition in the Short-run
The firms are producing at the profit maximisation level of output where MC=MR (Q1)
At this level of output, the AR (P1) < AC (C1)
The firm's loss is equivalent to (P1-C1) X Q1
Moving from Loss in the Short-run to Normal Profit in the Long-run
If firms in perfect competition make losses in the short-run, some will shut down
The shut down rule will determine which firms shut down
There are no barriers to exit, so it is easy to leave the industry
Diagram Moving from Loss in the Short-run to Normal Profit in the Long-run
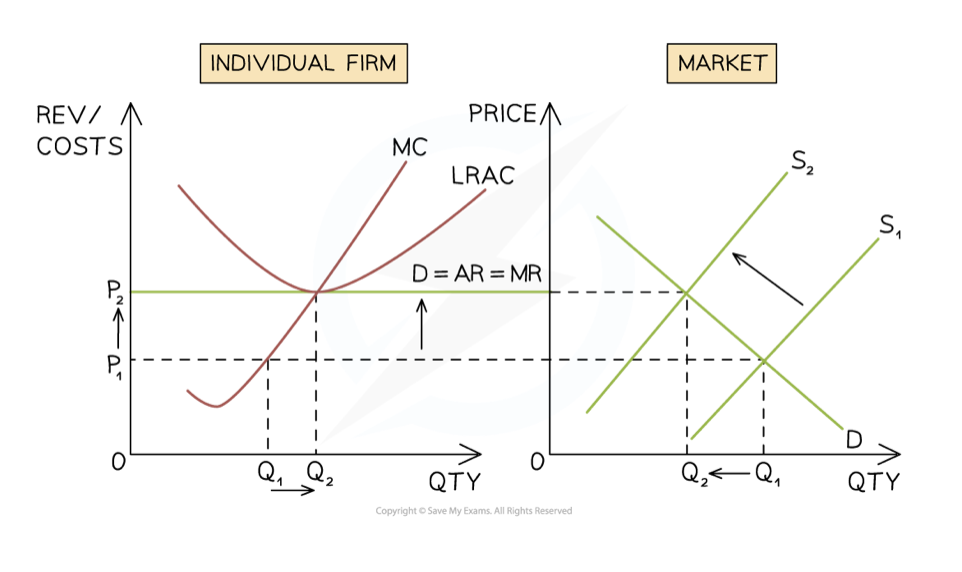
Diagram Analysis — Short-run losses in perfect competition
The firm initially profit maximises where:
MC=MR
→ at output Q1Q1
At this level of output:
AR(P1)<AC(C1)
→ so the firm is making a loss
Losses cause some firms to leave the industry
Diagram Analysis — Firms leaving the industry in perfect competition
Firms leaving reduce market supply:
S1→S2
Industry output falls:
Q1→Q2
Market price rises:
P1→P2
As a price taker, the firm must now sell at the higher industry price P2
The firm’s output and market share increase:
Q1→Q2
Diagram Analysis — Long-run equilibrium after losses in perfect competition
The firm still profit maximises where:
MC=MR
The firm is now producing where:
AR=AC
Losses have been eliminated
The firm earns normal profit in the long run
Firms making losses leave the industry, while supernormal profits attract new entrants until only normal profit remains
Alocative efficiency
Occurs at the level of output where average revenue = marginal cost (AR = MC)
At this point, resources are allocated in such a way that consumers & producers get the maximum possible benefit
No one can be made better off without making someone else worse off
There is no excess demand or supply
Productive efficiency
Occurs at the level of output where marginal cost = average cost (MC=AC)
At this point average costs are minimised
There is no wastage of scarce resources & a high level of factor productivity
Diagram Efficiency in Perfect Competition
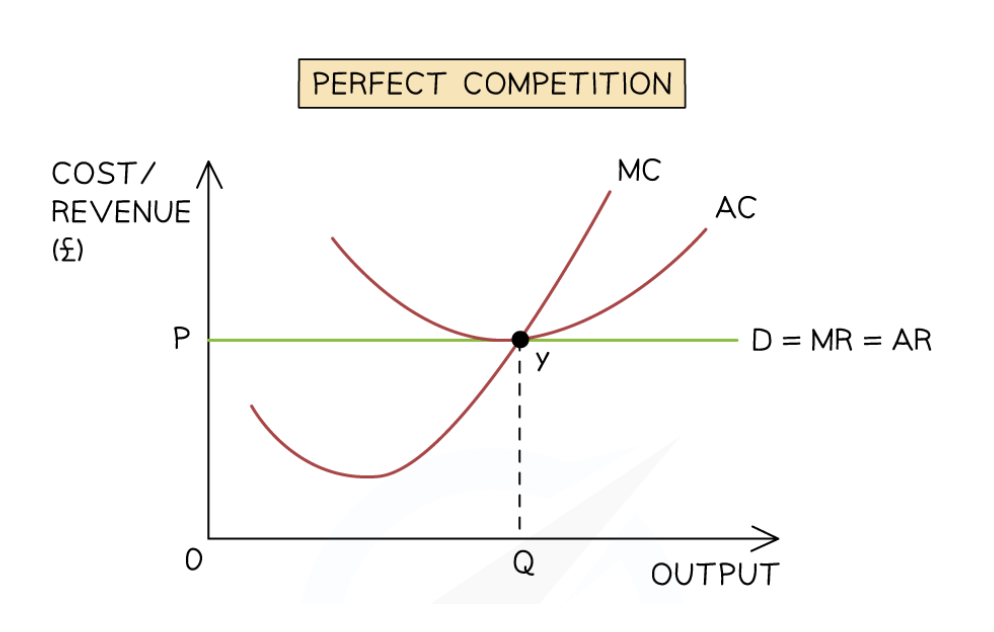
Diagram Analysis - Efficiency in Perfect Competition
The firm produces at the profit maximisation level of output where MC=MR (Y)
The firm is productively efficient as MC=AC at this level of output
The firm is allocatively efficient as AR (P)=MC