Lecture 13: Chi-Square
1/25
There's no tags or description
Looks like no tags are added yet.
Name | Mastery | Learn | Test | Matching | Spaced | Call with Kai |
|---|
No analytics yet
Send a link to your students to track their progress
26 Terms
Chi-square test
Statistical test used to analyze categorical data (counts) by comparing what you observe to what you would expect under some assumption
GOF test: does one variable follow a specific distribution?
Independence test: are two categorical variables related?
What is the difference between a chi-square test and a t-test?
Chi-square test
Uses categorical data (counts/frequencies)
Looks at patterns in proportions
T-test
Uses continuous data (means)
Compares average values between groups
What is the chi-square distribution and how does it differ from the normal distribution?
Shape is right-skewed
Values are always ≥0
Distribution changes shape depending on df
How does the chi-square distribution change as a function of degrees of freedom / sample size?
As df increases:
Distribution becomes less skewed
Starts to look more symmetrical
The peak shifts to the right
Can a chi-square test be one-sided and/or two-sided?
Always one-sided (right-skewed)
What kind of data must we have in order to conduct a chi-square test?
Categorical variables
Data in the form of frequencies/counts
Independent observations
Setup is usually a contingency table (ex: 2x3)
What is a chi-square goodness-of-fit test? What type of question does it test?
examines whether the observed distribution of a single categorical variable matches a theoretical or expected distribution
What do the null and alternative hypotheses look like for GOF?
Ho: The observed frequencies match the expected frequencies
Ha: The observed frequencies do NOT match the expected frequencies
How do we compute a chi-square test statistic?
Numerator: squared difference between Observed (O) and Expected (E) → (O - E)²
Denominator: expected frequency (E), which scales the difference
A sum of standardized squared deviations between observed and expected counts
What happens to chi-square when the difference between the observed frequencies and the expected frequencies (as specified under the null) increases (assuming all other things stay equal)?
If (O - E) gets larger → the numerator increases → chi-square increases → more evidence against Ho
What happens to the chi-square value when the sample size increases (assuming all other things stay equal)?
Expected counts (E) increases, even small proportional differences can produce larger chi-square values
Larger samples make it easier to detect significant differences
What do we compare the chi-square statistic to?
A critical value from the chi-square distribution OR use a p-value
What are the assumptions of a GOF test?
Categorical data
Independent observations
Expected frequencies are sufficiently large
How do we compute degrees of freedom for GOF?
df = k - 1
k: number of categories
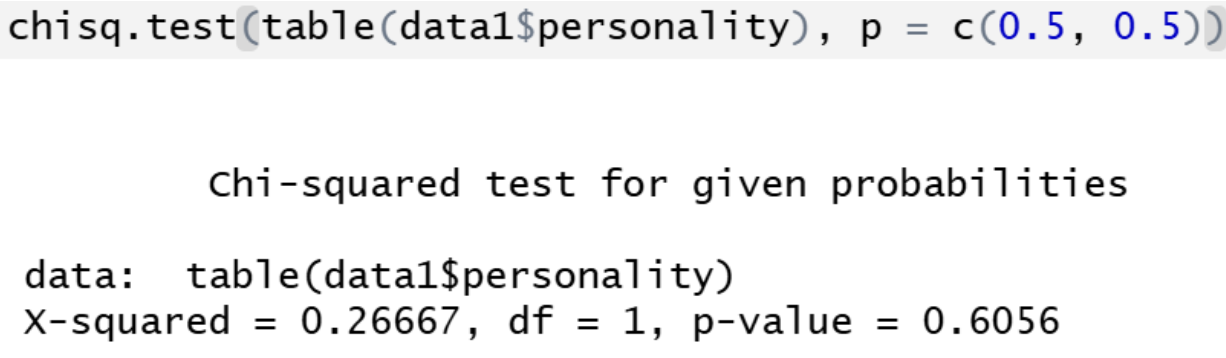
R output for a GOF test
Refers to one variable only
No mention of rows/columns
Hypothesis is about distribution matching expected proportions
chi-square test of independence
Examine whether two categorical variables are related or if they’re independent of each other
Tests questions like: “is gender related to political preference?”
Null and alternative hypotheses (chi-square test of independence)
Ho: The two variables are independent (no relationship exists)
Ha: The two variables are not independent (there’s an association)
How do we compute a chi-square test statistic?
Numerator: squared difference between observed and expected counts → (O - E)²
Denominator: expected counts (which standardizes the difference) → E
What happens to chi when the difference between the observed frequencies and the expected frequencies (as specified under the null) increases (assuming all other things stay equal)?
If (O - E) increases:
The numerator increases
So chi-square increases
What happens to the chi-square value when the sample size increases (assuming all other things stay equal)?
Expected frequencies increase
Even small proportional differences can produce larger chi-square values
What do we compare the chi-square statistic to?
A critical value from the chi-square distribution OR a p-value
What are the assumptions of a chi-sq test of independence?
Categorical variables
Independent observations (no repeated measures in the same cell)
Expected cell frequencies are sufficiently large
Rule of thumb: each expected count ≥ 5
Data are in a contingency table
How do we compute degrees of freedom for this test?
df = (r - 1)(c - 1)
What is Yate’s correction? When is it used?
An adjustment applied to a chi-square test to make it more accurate when working with small samples and discrete data
Chi-square test uses a continuous distribution to approximate results from discrete count data
Yates’ correction compensates for this mismatch by slightly shrinking the difference between observed and expected values before squaring it (by 0.5)
It reduces the chi-square value, increases p-value, and makes the test more conservative (harder to reject Ho)
Primarily used for a test of independence (2x2 tables)
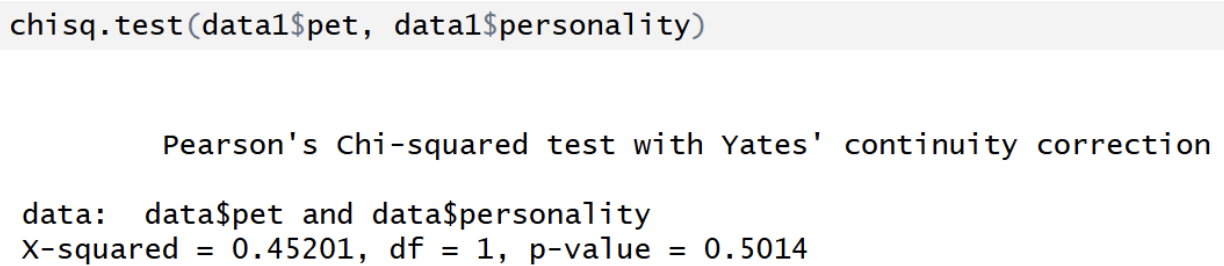
R output for chi-square test of independence with Yates’ continuity correction
Label becomes: "Pearson's Chi-squared test with Yates’ continuity correction”
Chi-squared value is smaller
P-value is larger (more conservative)
Mainly used for 2x2 tables
Yates’ correction: adjusts for the fact that chi is a continuous approximation but data are discrete counts
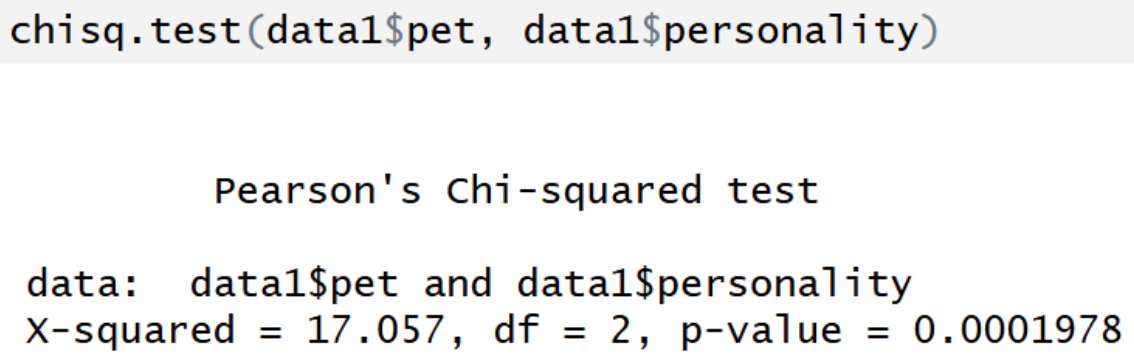
R output for chi-square test of independence w/o Yates’ continuity correction
Based on a contingency table (2+ variables)
You can extract expected counts ($expected) and residuals ($residuals)
df = (r-1)(c-1)
Tests association