Lecture 6 - cognitive control
 Call Kai
 Learn
Learn Practice Test
 Spaced Repetition
 Match
Match Flashcards
 Knowt Play
1/43

There's no tags or description
Looks like no tags are added yet.
Name | Mastery | Learn | Test | Matching | Spaced | Call with Kai |
|---|
No analytics yet
Send a link to your students to track their progress
44 Terms
inhibition
-can pause behaviour and prevent self from doing things
-behavioural and cognitive inhibition are separate things → but may rely on the same process
cognitive control
-top-down mental processes require effort or attention
-have core and higher order cognitive abilities
core cognitive abilities
-working memory
-inhibitory control
-flexibility
higher order cognitive abilities
-object permanence
-self recognition
-mental time travel
-theory of mind
-tool use/causal reasoning
behavioural inhibition
-stopping actions
-can observe and measure
-response inhibition, deferred gratification, reversal learning
cognitive inhibition
-stopping mental processes → memories, thoughts, perception, emotions
-hard to measure stopping of thoughts
-have overlapping brain areas with behavioural inhibition → evidence from imaging studies and patients of conditions
-can study principles and mechanisms by studying inhibition of motor responses as easier to study behavioural → overriding planned or already initiated actions on behavioural tasks
examples of delayed gratification (behavioural inhibition)
-marshmallow test
-shopping hungry in supermarket
examples of response inhibition (behavioural inhibition)
-stopping responses to stimuli
-could overlap with delayed gratification
examples of reversal learning (behavioural inhibition)
-wisconsin card sorting task
-updating understanding of rules
inhibition and executive function
-voluntary inhibition
-executive functions require one another so that a combination of attention, inhibition and flexibility allows complex behaviour
impulsivity
-result of deficient inhibitory processes
-linked to addiction, ADHD, mania
-response inhibition used as a proxy measure in lab tasks → but only indicates some types of impulsivity
-translational potential of animal studies of response inhibition
reaction times
-time between onset of the stimulus and the onset of response is RT
-delay onset of stimulus for 123ms, 322ms, 277ms
-RT varies across individuals
reaction time distribution
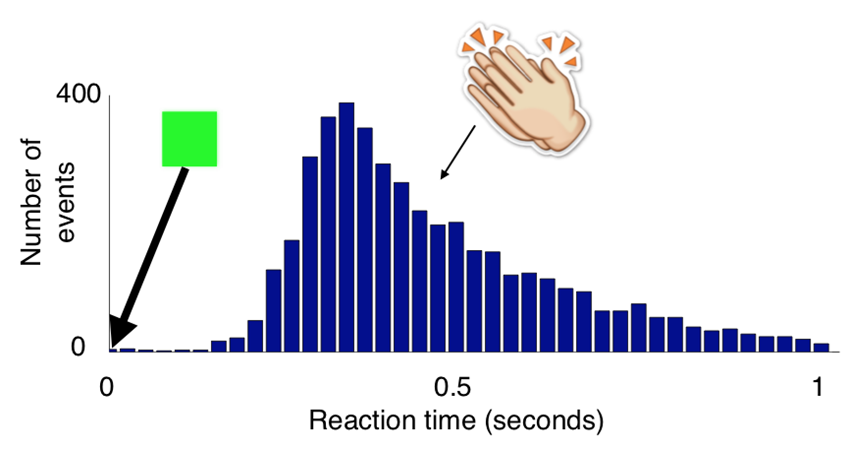
-green square shown at time 0
-300-500ms is standard for RT
-skewed curve, nothing at start then long tail → vary across trials
model for RT
-once race starts at 0 seconds the each runner is described by a linear function of the form: y = ax
y → current position of the runner - activation of the process
a → speed of the runner
x → time
model parameters (model for RT)
-need to specify:
speed of each runner - slope of each line
goal line - threshold of when action occurs
-can randomise these parameters in line with expected outcomes
threshold (model for RT)
-for each process can determine the time when it crossed the threshold
-this is model RT
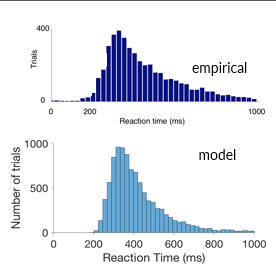
-can then look at the distribution of model RTs over 10,000 processes
-this distribution has a similar shape as the empirical RTs distribution model
neurophysiology of RT variability - overview
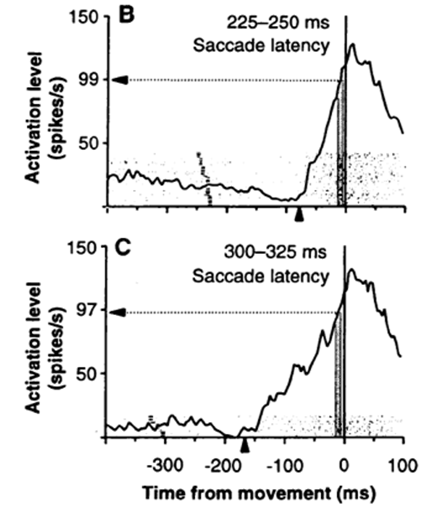
-recordings in the frontal eye fields of monkeys performing a RT task
-examination of neurons increasing their firing rate before saccades
-neurons in the frontal cortex indicate the RTs vary due to rate variability in slope of underlying process
-measuring single neuron recording in frontal eye fields in monkey across multiple trials
neurophysiology of RT variability - results
-line shows average firing rate
-time 0 → onset of saccade
-before movement onset, neuron sharply increases firing rate
-no difference in threshold for action between slow trials and fast trials
-differences appears to be in the slope of firing rate increase → reflected in race model
go/nogo task (behavioural methods)
-participant needs to respond to some stimuli (go stimuli) but not to others (nogo stimuli)
-can measure RT and number of correct trials
-signals are arbitrary → people find it easier to respond if it adheres to social conventions
-easy task and general in terms of inhibition
stop signal task (behavioural methods)
-go and stop signals mixed randomly so stop-signal cannot be predicted
-one-key parameter is the stop-signal delay → time between the go and stop signal:
short-signal delay → response not imminent and easier to inhibit
long delay → imminent responses harder to inhibit
stop signal reaction time (stop signal task)
-tells us how quickly a participant reacts to the stop signal
-SSRT reaction consists of inhibiting the behavioural response
-means cannot directly measure it because when inhibition is successful there is no response
advanced behavioural measures
-inhibition functions
-could use stop-signal reaction times to calculate probability of motor response based on stop signal delay
intuition for stop signal reaction time
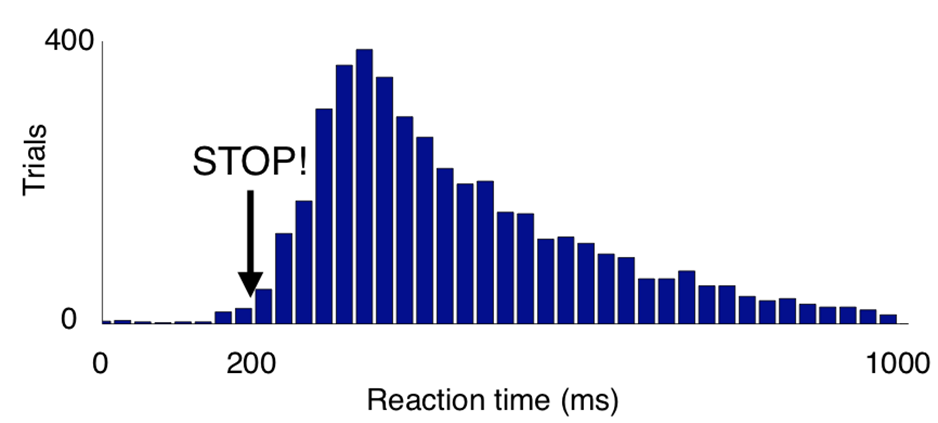
-cannot directly measure the SSRT but can estimate it
-a SSRT of 100ms means that a participants requires 100ms to make use of the stop-signal
-response that occurs later than 100ms after the stop-signal can be stopped
-do know when responses occur based on our RT distribution
failed stops (SSRT)
-RT in failed stop trials are mostly fast, in line with out consideration from the SSRT
three components of stopping (SSRT)
stimulus detection
action selection
inhibition
-used to describe how well an individual can inhibit responses
-SSRT is a measure for reactive inhibition how quickly participants can react to the stop signal
race model of stopping
-people have variability in RTs
-stopping can be modelled as a race between two different types of processes
-the process that reaches the threshold first determines behaviour
go process → the response, failure to inhibit
stop process → inhibition, successful inhibition
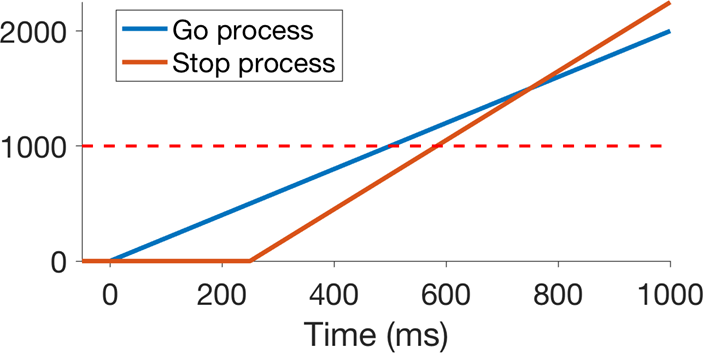
single trial (race model of stopping)
-need to repeat this simulation many times to do a whole experiment
-the slope of the go and stop process are parameters that can vary across trials
-in different trials sometimes the go process and sometimes the stop process wins
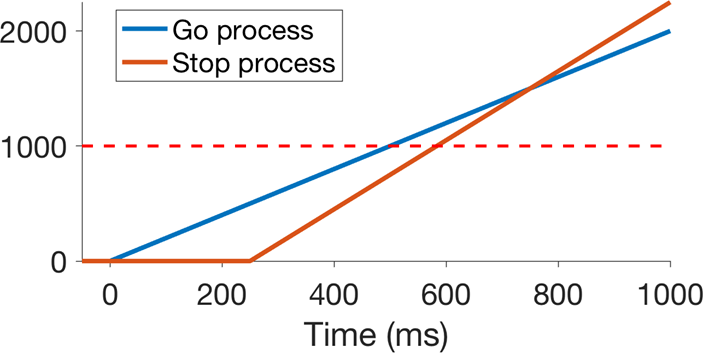
stop process winning (race model of stopping)
-stop process has not changed
-it is the go process that had a smaller slope and therefore took longer to reach the threshold
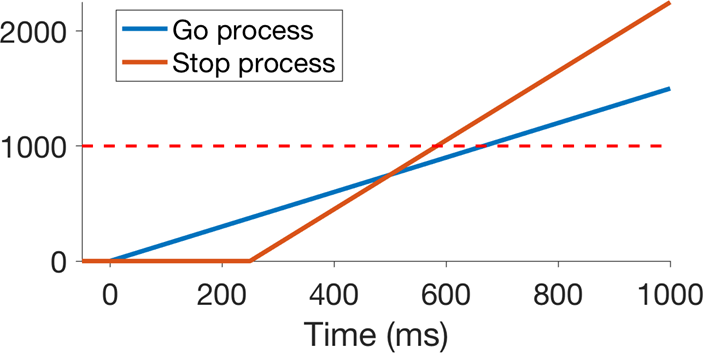
variability in go process (race model of stopping)
-lot of variability in the go process
-less variability in the stop process
-stopping fails for steep go process slopes
-stopping succeeds for small go process slopes
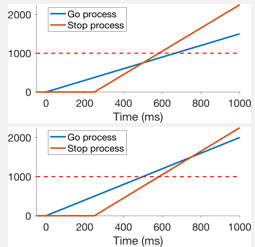
stop-signal delay in race model
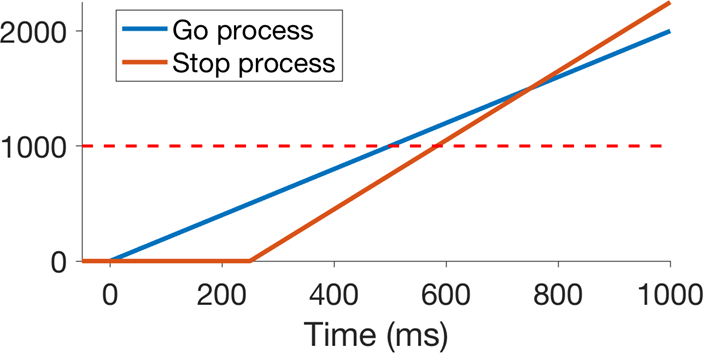
-in example stop-signal delay is 250ms → so stop process only starts to increase at time 250ms
-stop process at disadvantage and requires a steeper slope to overtake the go process
-once one of the process reaches the threshold, stop the simulation because the activity afterwards no longer matter
-so the SSRT is the time from the beginning of stop process to when the stop process reaches the threshold (e.g., 210ms-600ms)
strengths of race model
-applied to different animals
-apply to different types of stopping
-different types of stop-signal tasks
-very general as described behaviour and may describe underlying cognitive and neurobiological processes
-allows to model inhibition functions
proactive inhibition
-adjust behaviour in anticipation of potentially having to inhibit a response
-visible as change in the go reaction time
measuring proactive inhibition using stop-signal task
-manipulate the degree of proactive inhibition exerted by the participants by providing information on the probability of the stop-signal
explicit proactive inhibition (stop-signal task)
-provide a specific cue indicating the possibility of the stop-signal occurring
-trial-by-trial or block
implicit proactive inhibition (stop-signal task)
-vary probability across blocks
trial
-a single representation of a stimulus-response sequence
block
-several trials
-typically has specific parameters
session
-consists of one or more blocks
-different sessions are usually separated by longer time intervals
trials per block (proactive inhibition)
-need to determine: number of go trials and stop trials per block
-this yields the percentage of stop trials → stop trials/stop trials + number of go trials
-proactive inhibition is the change in the average RT in go trials between two blocks
steps for measuring proactive inhibition
collect all RT from go trials in block 1
average them - Mean(RTblock1)
repeat for block 2 - Mean(RTblock2)
proactive inhibition score = Mean(RTblock2) - Mean(RTblock1)
proactive adjustment hypothesis
-difference between model prediction and empirical data
-proactive inhibition seems to involve adjustments of the response threshold
-doesn’t change the slope of the processes but rather changes the response threshold → increasing the point needed for activation, giving chance for stop process to catch up to go process
parkinsons disease (impaired stopping)
-death of dopaminergic neurons
-severe motor symptoms and less understood cognitive symptoms
-dopamine replacement therapy and DBS
stop-signal task and parkinsons (impaired stopping)
-patients tested on and off levodopa medication
-longer SSRT in patients compared to control but no significant differences between on and off medication
substance dependence (impaired stopping)
-longer SSRTs compared to control group for:
alcohol users
meth users
cocaine users