Lecture 11: Climate Change Vulnerability - Lecture Outline (Part 2)
1/24
There's no tags or description
Looks like no tags are added yet.
Name | Mastery | Learn | Test | Matching | Spaced | Call with Kai |
|---|
No analytics yet
Send a link to your students to track their progress
25 Terms
Methods
Genetic Diversity (Ar and He)
Genetic Isolation (FST)
Geographic Isolation (Least-cost pathways)
Maximum Elevation
Forward Climate Velocity (from climate model predictions)
Geographic Isolation (Least-cost pathways):
Estimate how different/far apart one population is from another
Euclidean distance
Each pathway has a value
Maximum Elevation:
How tall a mountain range is provides more resources for sheep
Measure of current climate stress; lower maximum elevation is associated with higher temps, lower precipitation, and lower population persistence
How under stress would a population be currently
Predicting how threatened would a population would be if temperature increased
Forward Climate Velocity (from climate model predictions):
a measure of geographic movement rate required for an organism to maintain constant climate conditions
Methods: Forward climate velocity
Measure of speed and direction of regional climate change
Obtained gridded spatial data on forward climate velocity based on mean projections for 2050s from 15 global climate models (IPCC)
Under two emissions scenarios
What two emissions scenarios does the assessment use?
(1) ‘moderate’ and (2) ‘high’
What is the (1) ‘moderate’ emissions scenario?
RCP8.5: stable climate change by 2100
What is the (2) ‘high’ emissions scenario?
RCP8.5: assumes greater greenhouse gas emissions
Why is the Bighorn sheep assessment not wholly independent?
uses the same data as other assessments; estimates without evidence
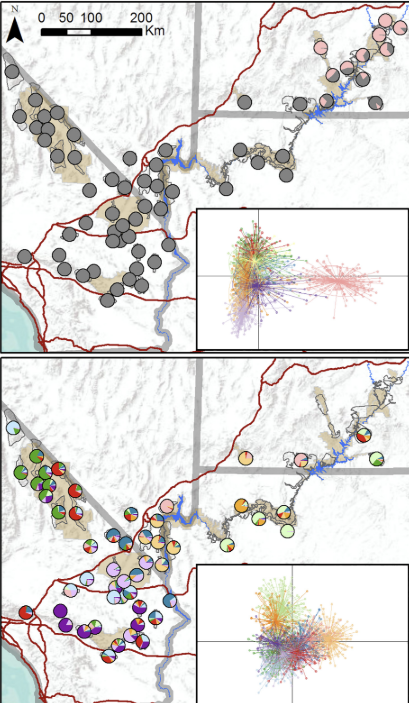
Genetic Diversity results:
Most unique populations are in southern Utah, in Canyon lands, and arches
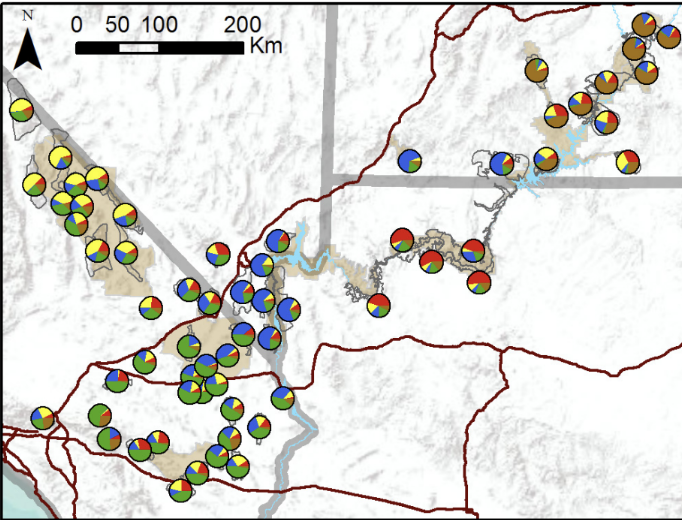
Five genetic clusters with different genetic patterns
Clusters
Translocations
Bighorn are least genetically isolated in areas between Mojave, Death Valley, and Lake Mead areas
Most isolated in mountains surrounded by desert flats in southern Mojave
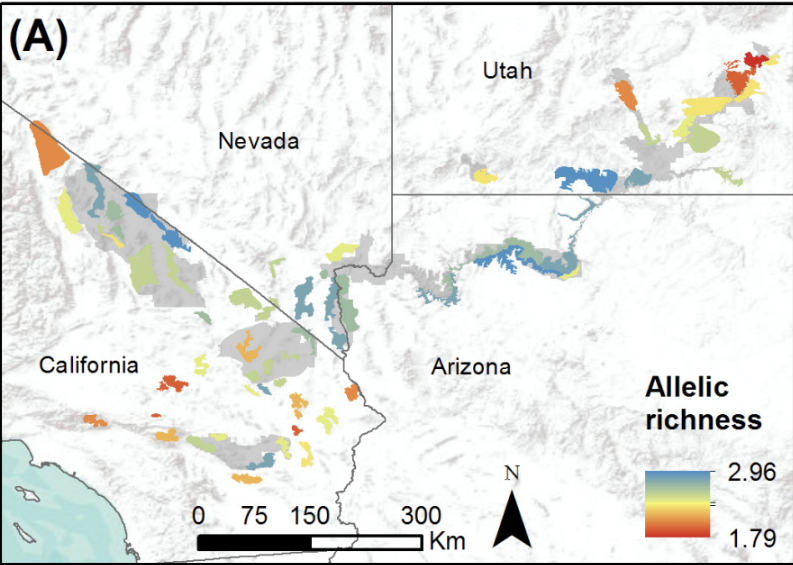
Allelic richness:
measure of genetic diversity with alleles
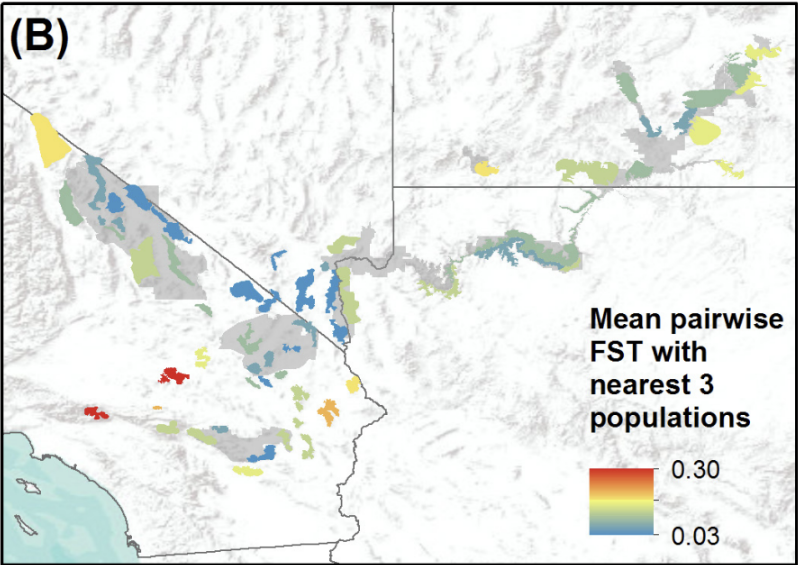
Mean pairwise FST:
measure of genetic isolation; how different or similar are populations due to genetic structure
run from 0 to 1; determines population structure
Low FST, ~0: no to little difference
High FST, >0.5: a lot/greater difference
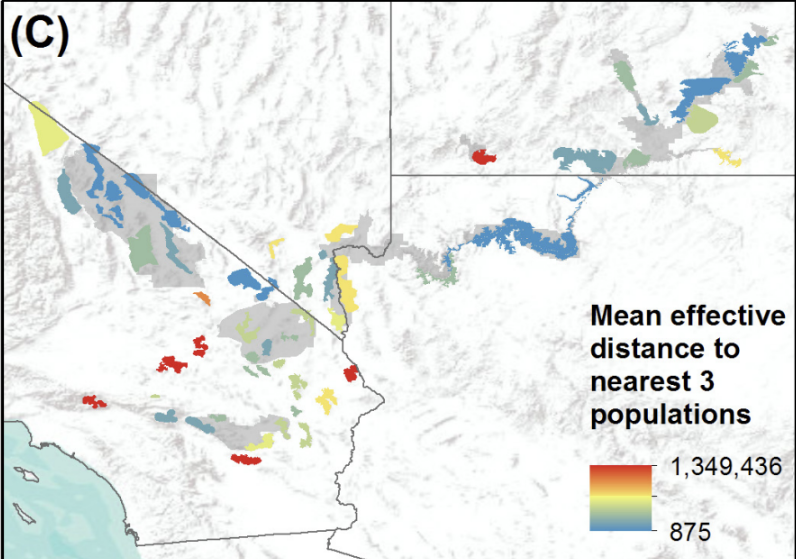
Mean effective distance:
how they manage geographic isolation from their 3 nearest populations
takes into account topography, barriers, and distance
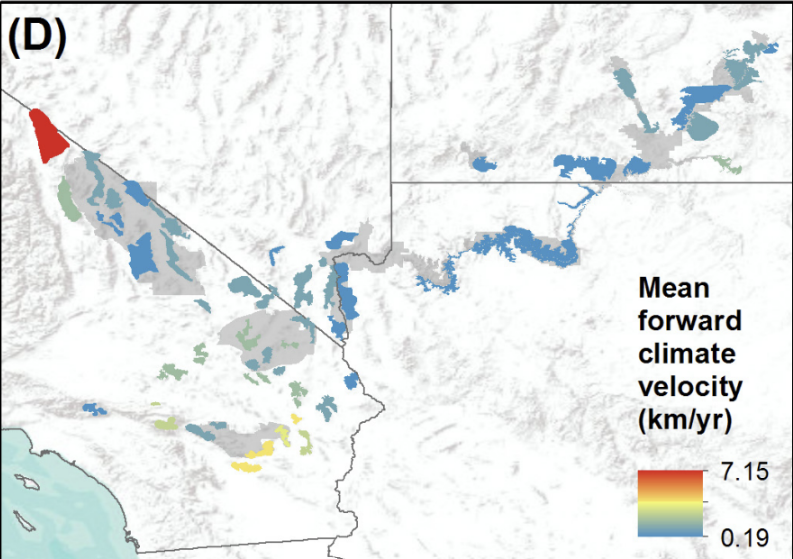
Forward climate velocity:
how much the population would have to move
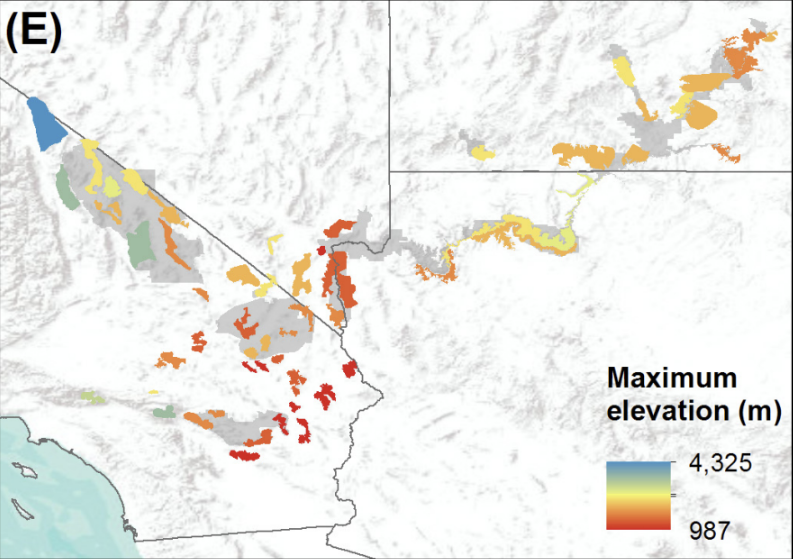
Maximum elevation:
high mountain range doesn’t alter change
Most vulnerable: lower elevation, isolate, fragmented, hot desert ranges (Mojave Desert)
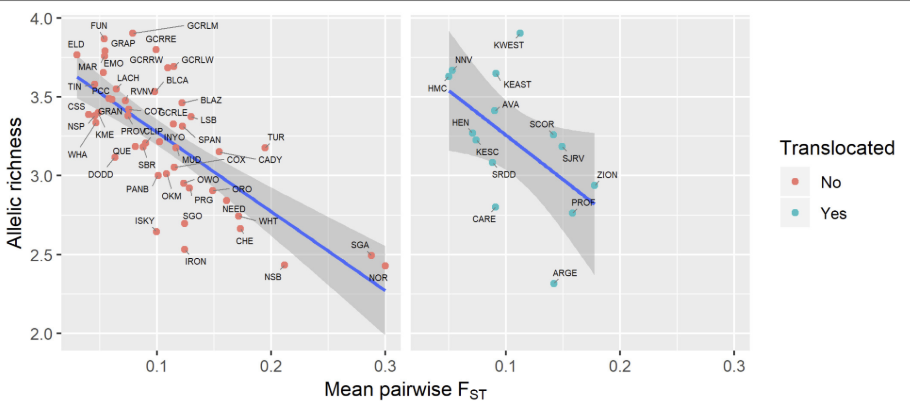
Relationship between genetic diversity and genetic isolation:
shows a negative relationship
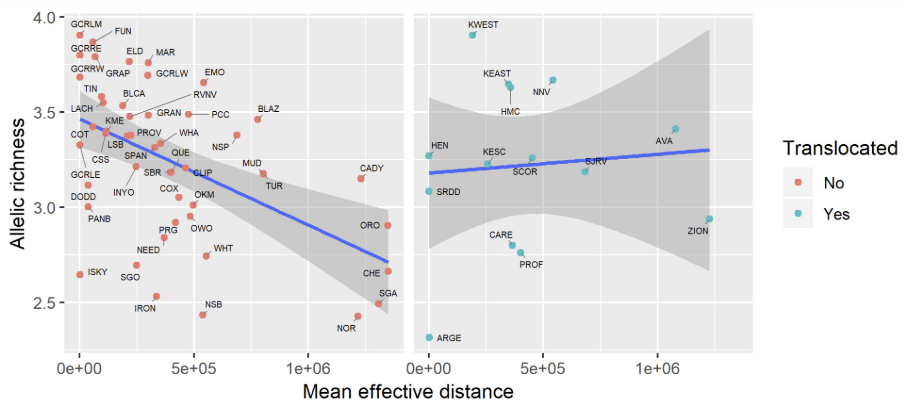
Relationship between genetic diversity and effective geographic distance:
shows a neutral relationship
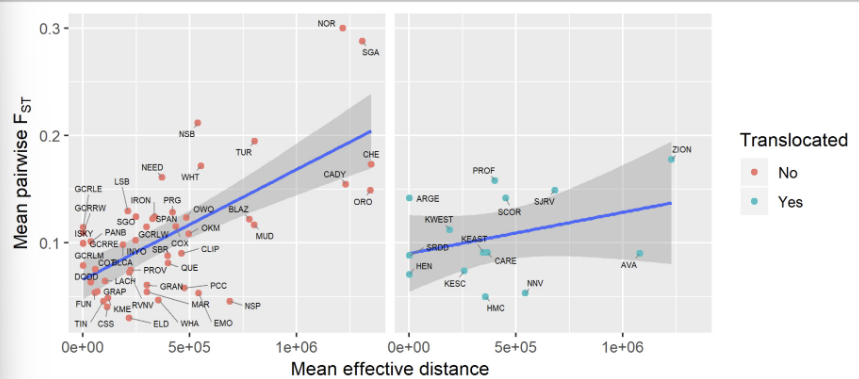
Relationship between genetic isolation and geographic isolation:
shows a positive relationship; genetic isolation and geographic isolation go hand-in-hand
Most vulnerable:
Southernmost populations in the study area had the highest forward climate velocities
Southernmost populations in the study area also had:
lowest elevation
lowest genetic diversity
high genetic isolation
high geographic isolation
Least vulnerable:
Other populations, like DEVA and GRCA, had low forward climate velocities
Other populations, like DEVA and GRCA, in the study also had;
higher elevation
high genetic diversity
low genetic isolation
low geographic isolation
What do climate variability results help to do?
help NPS and other management agencies make more informed decisions about resource allocations among Desert bighorn populations
What are the perspectives discussed in the study?
All of the above