MicTech
1/87
There's no tags or description
Looks like no tags are added yet.
Name | Mastery | Learn | Test | Matching | Spaced | Call with Kai |
|---|
No analytics yet
Send a link to your students to track their progress
88 Terms
SNOM (Scanning near-field optical microscopy)
SNOM (Scanning near-field optical microscopy)
SEM (scanning electron microscopy)
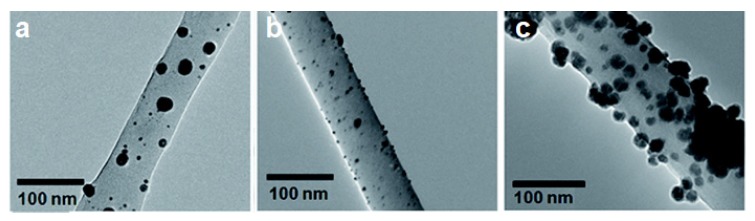
TEM (transmission electron microscopy)
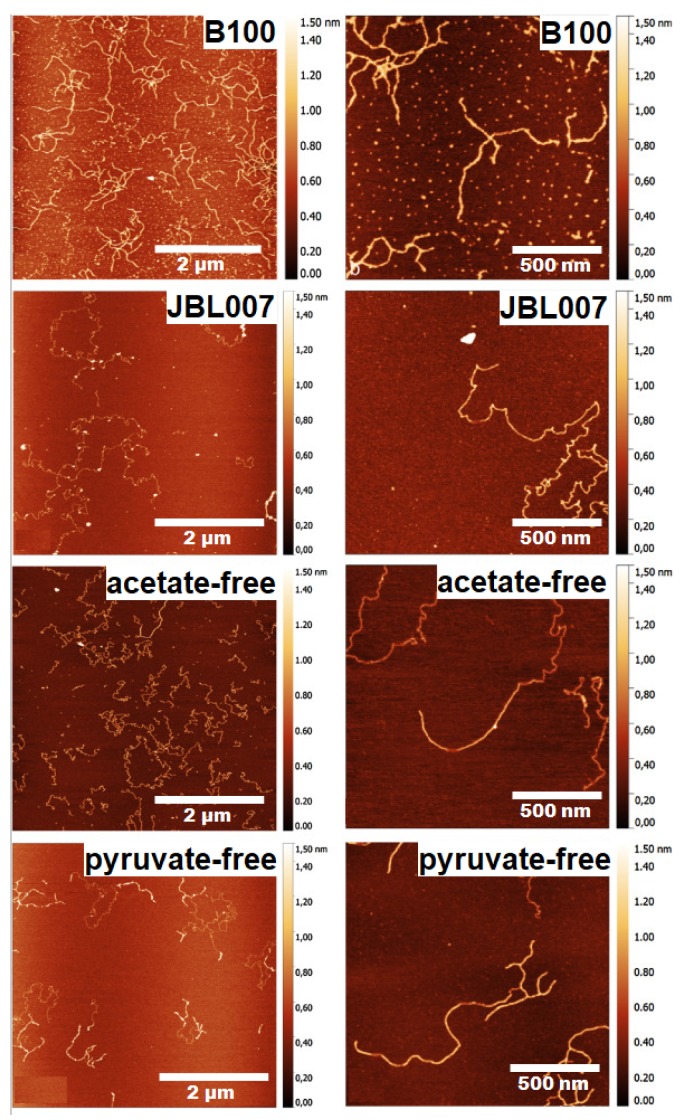
AFM (Atomic force microscopy)
AFM (Atomic force microscopy)
Cryo-EM (Cyro electron microscopy)
Cryo-EM (Cyro electron microscopy)
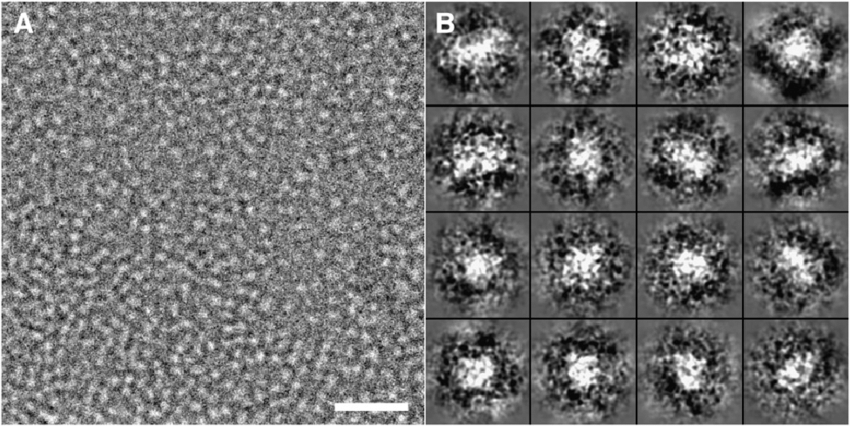
Cryo-EM (Cyro electron microscopy)
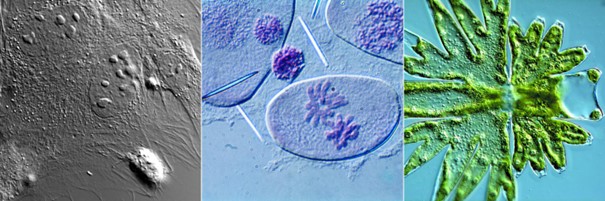
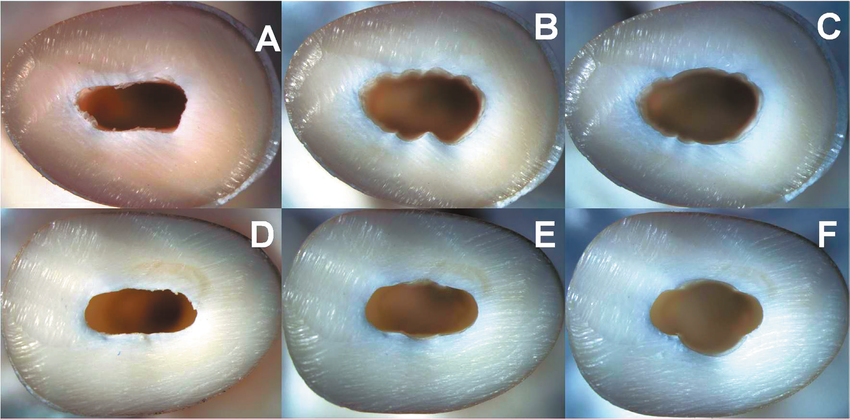
DIC (differential interference microscopy)
TEM (transmission electron microscopy)
TEM (transmission electron microscopy)
phase-shifting interferometry
phase-shifting interferometry 2
two-beam interferometry
two-beam interferometry
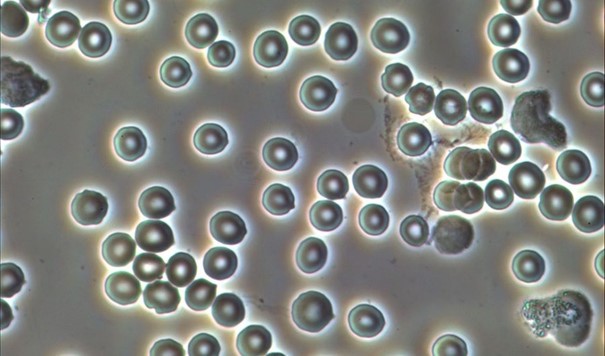
phase contrast microscopy
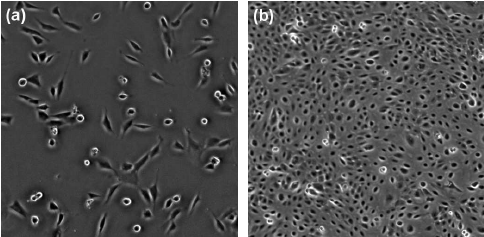
phase contrast microscopy
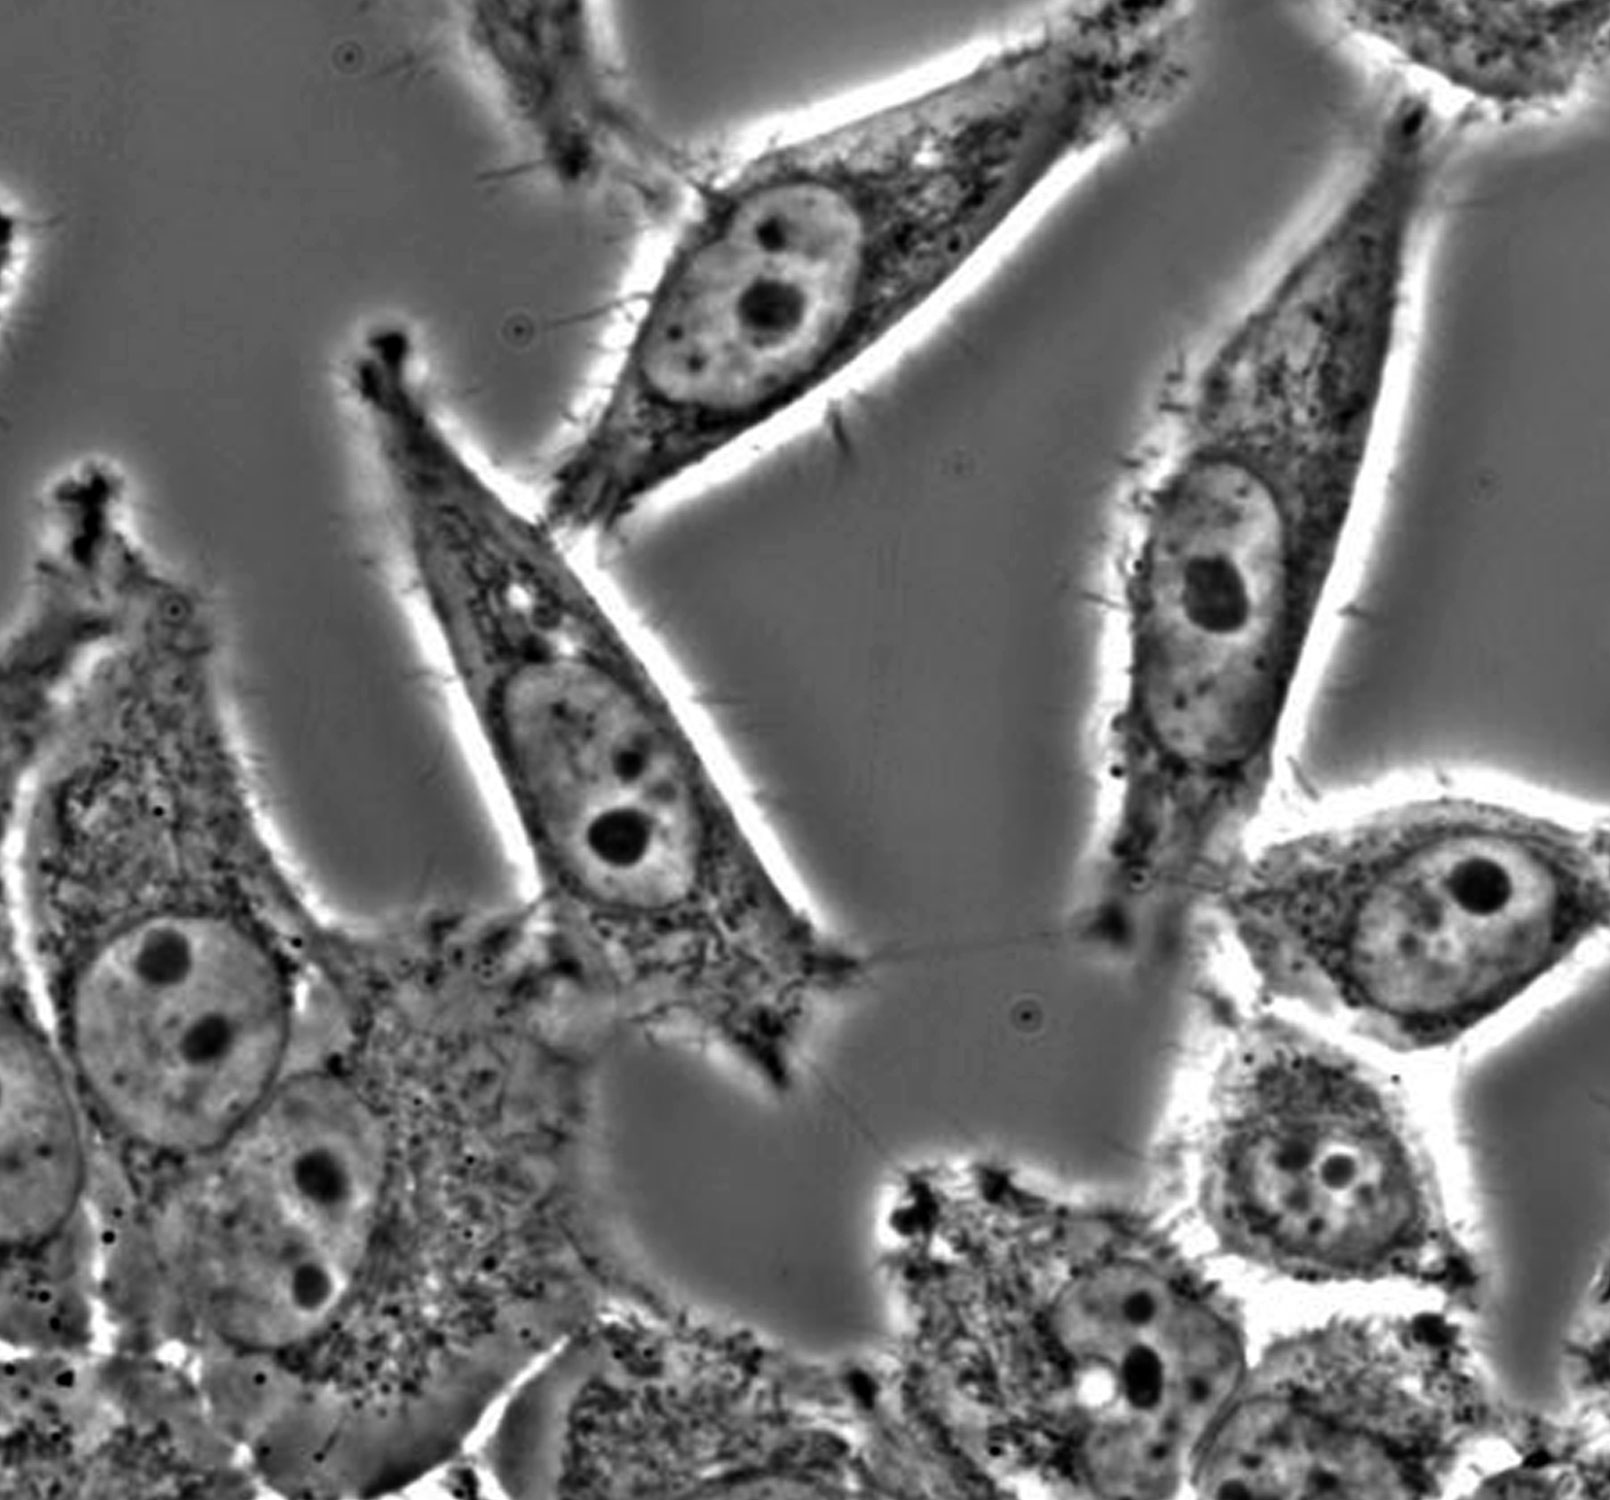
phase contrast microscopy
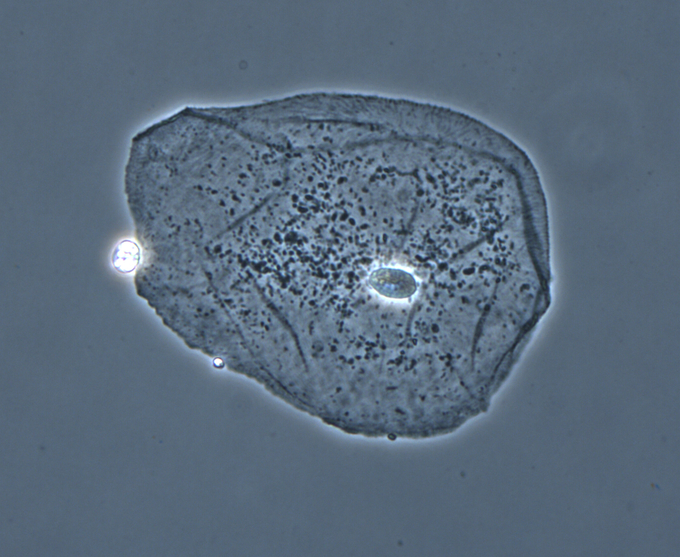
phase contrast microscopy
Schlieren microscopy
Schlieren microscopy
dark-field microscopy
dark-field microscopy
dark-field microscopy
polarized light microscopy

polarized light microscopy
TIRF (total internal reflection fluoresence
stereomicroscopy
stereomicroscopy
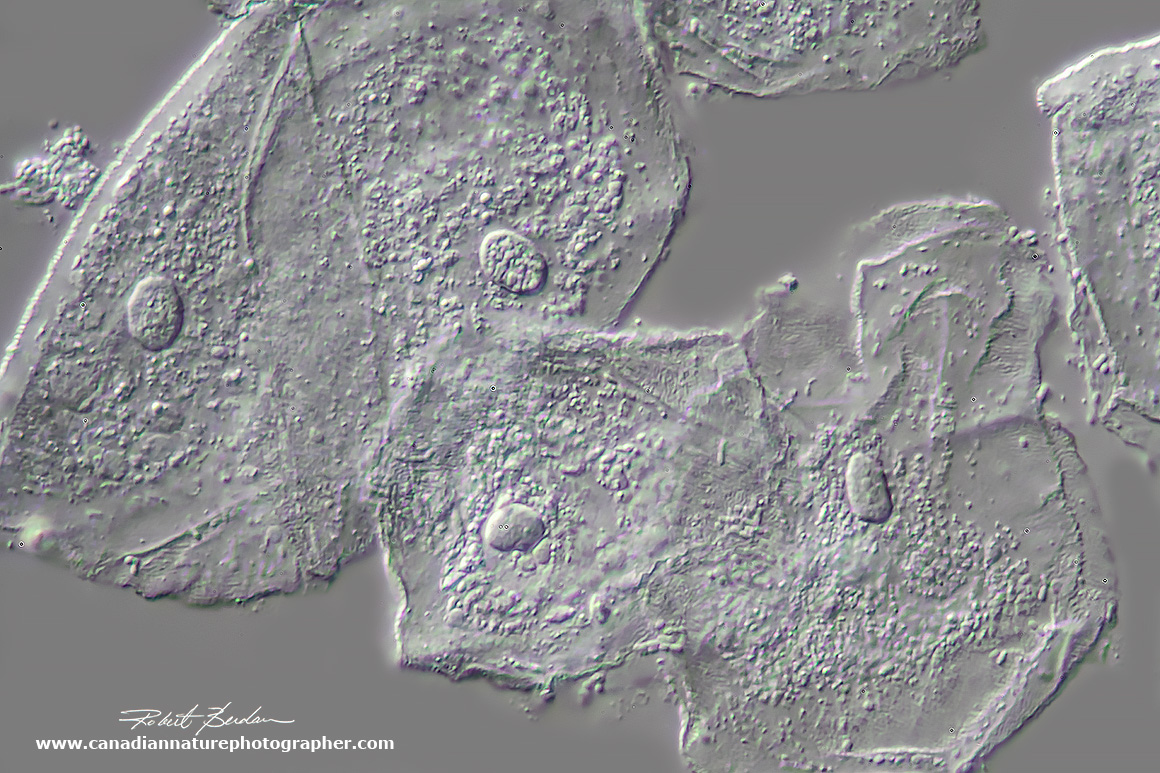
DIC (differential interference microscopy)
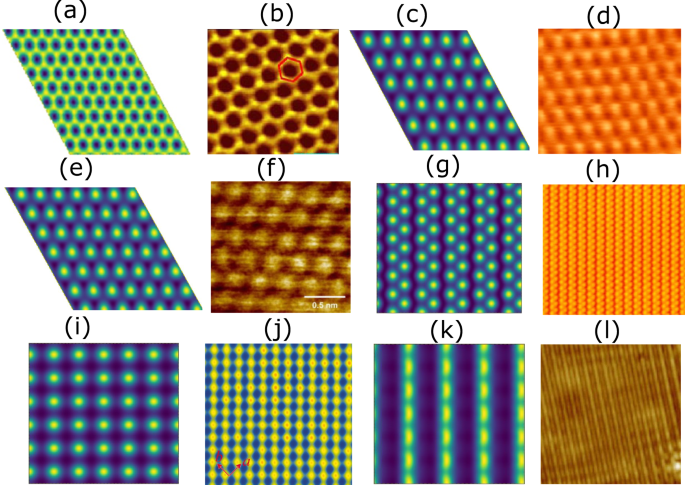
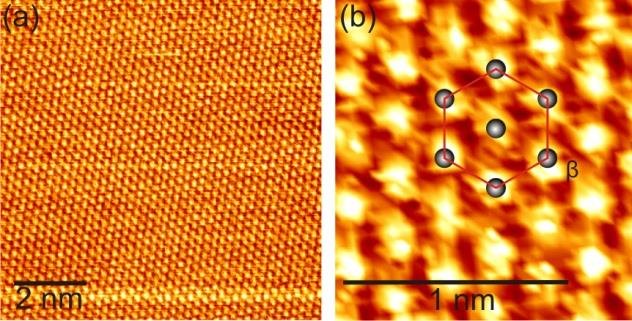
STM (Scanning tunnelling microscopy)
STM (Scanning tunnelling microscopy)
AFM (Atomic force microscopy)
TEM (transmission electron microscopy)
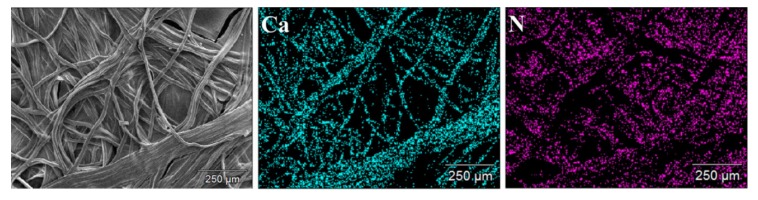
EDX (Energy-dispersive X-ray)
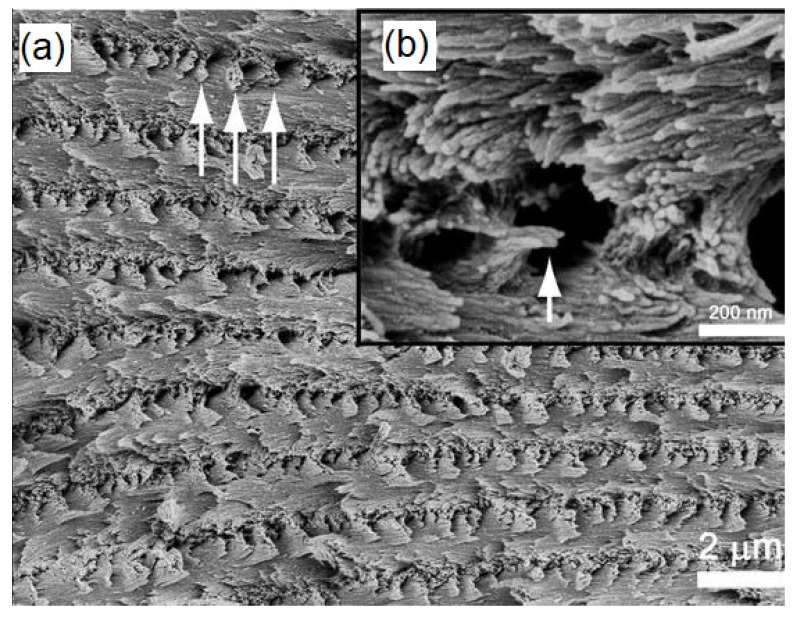
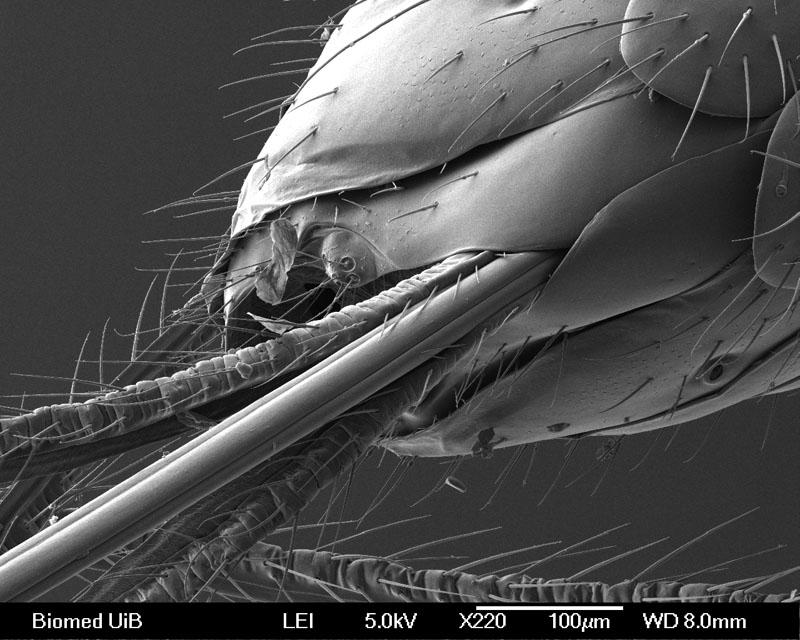
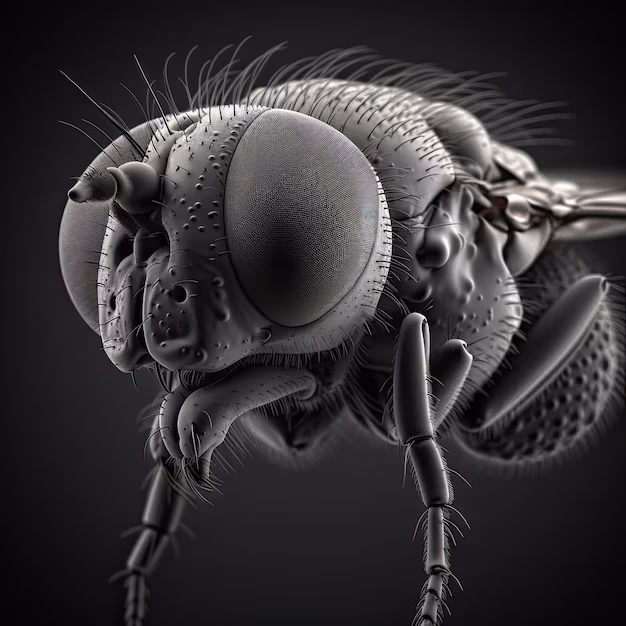
SEM (scanning electron microscopy)
SEM (scanning electron microscopy)
SEM (scanning electron microscopy)
confocal fluorescence microscopy
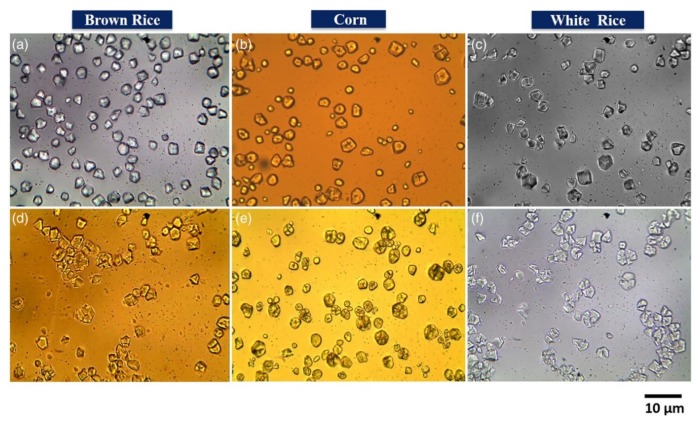
Optical microscope
Optical microscopy (transmitted/incident light)
Far field method, used to examine transparant or opaque objects which are not visible with the eye. Object size: 1 cm - 0.1 μm
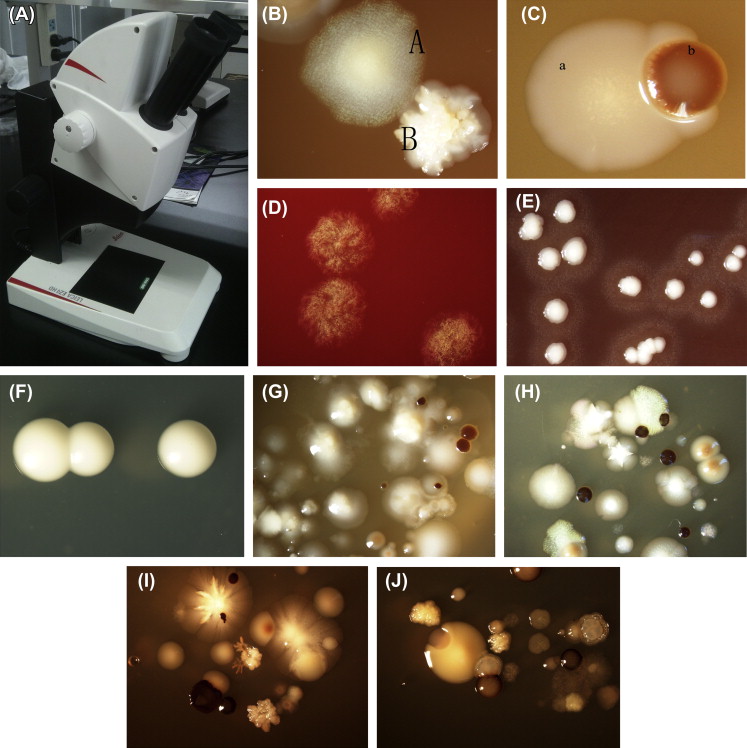
Stereomicroscopy
Use two separate optical paths that are inclined by a small angle (10-12 degrees), to provide slightly different viewing angles to the left and right eyes resulting in a spatial, three-dimensional image of the objects.
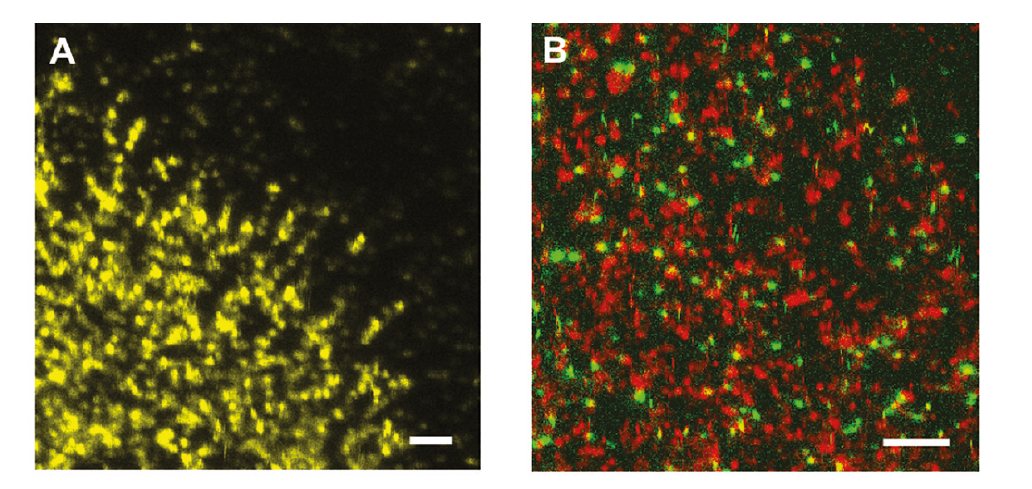
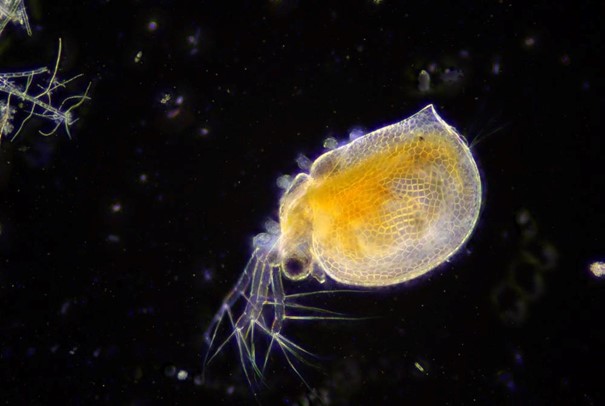
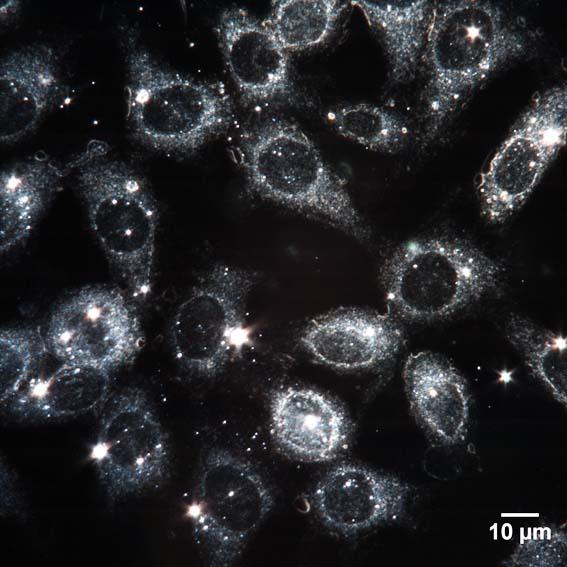
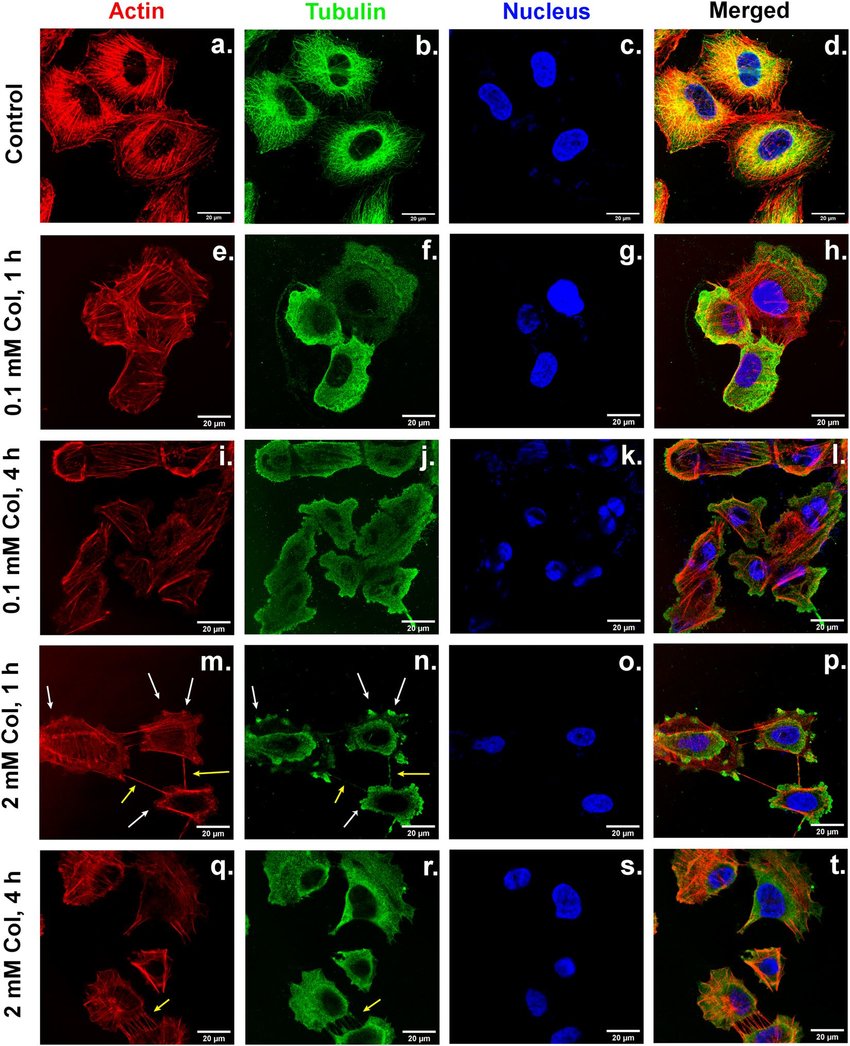
confocal fluorescence microscopy
used frequently in life science for, e.g., cell studies and in mineralogy to obtain images with a entirely dark background capturing weak fluorescence. Uses a pinhole to achieve this.
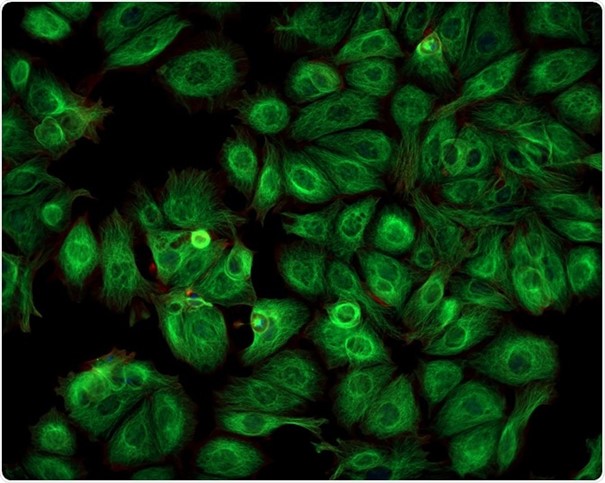
TIRF
Useful to be able to restrict the excitation and the detection of fluorescence emission to a thin region of the total sample. Helps to reduce background fluorescence from outside the focal plane and to improve the singal-to-noise ratio. Known as total internal reflection fluorescence microscopy.
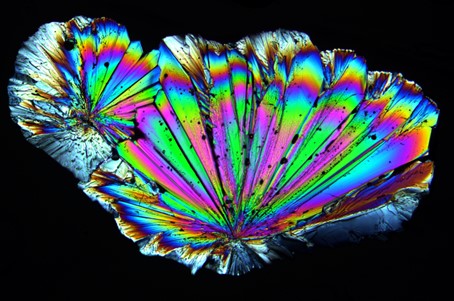
polarized light microscopy
Is a brightfield incident or transmitted light microscope equipped with a polarizer in front of the condensor, and an adjustable analyzer (second polarizer) behind the objective. The polarizer and the analyzer are polarizing filters of high quality where the two filters have a crossed (90 degrees) orientation, so that in absence of an object no light reaches the eyepiece or camera. Also called the extinction of the light.
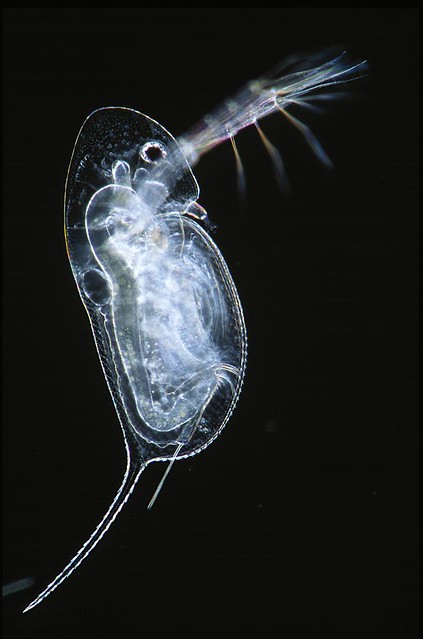
Dark-field microscopy
In …, a small opaque disk is placed at the rear focal point of the objective lens, blocking the Fourier transform’s zero-order peak. The beam of light passing the specimen straight on will be obstructed and only the diffracted light will contribute to the image. In this way, variations in phase of the object will be translated into variations in amplitude in the image.
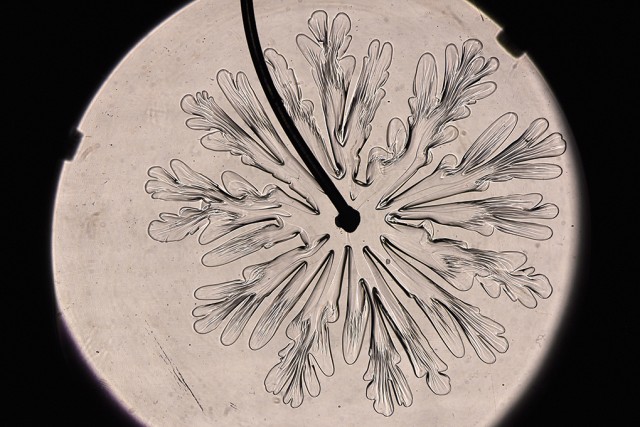
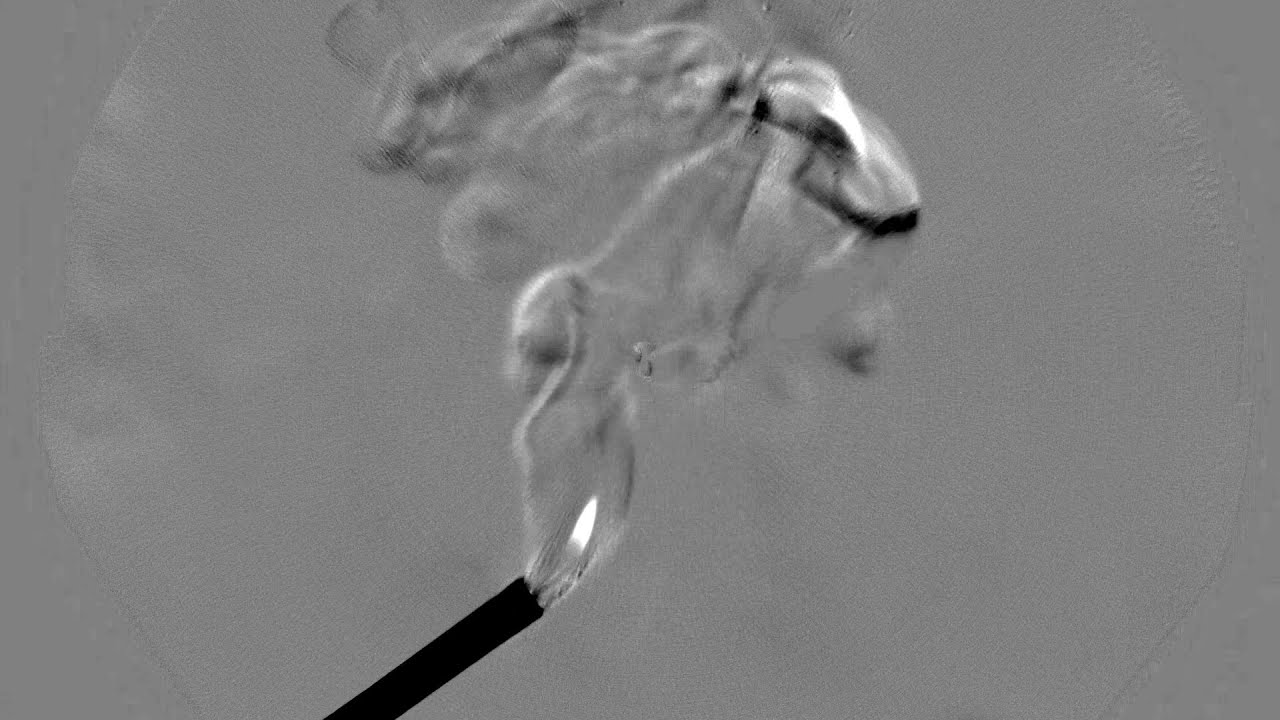
Schlieren microscopy
By obscuring one half of the Fourier transform, including a large part of the zero-order peak, using a knife’s edge, only half of the diffracted rays will reach the image after inverse trans-formation. Phase information is then translated into amplitude information, it can detects gradients.
Phase contrast microscopy
A … uses a filter that partially obscures (e.g. 75%) and phase shifts the FT’s zero-order peak over 90 degrees. The relation between the intensity and phase shift is now linear.
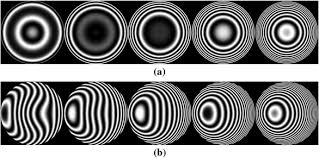
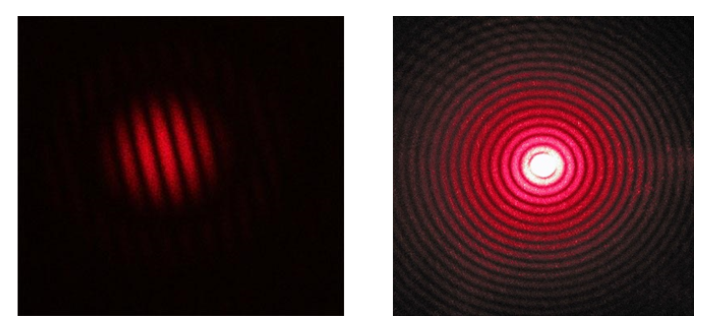
two-beam interferometry (transmitted/reflected light)
An interferogram is created by letting two coherent light beams, one reflected from a phase object (e.g. with variations in height) and one reflected from an optically flat reference plane, to interfere. The result is a zebra-pattern of black and white stripes that can be used to deduce the object’s height profile. The stripes are actually hight contours.
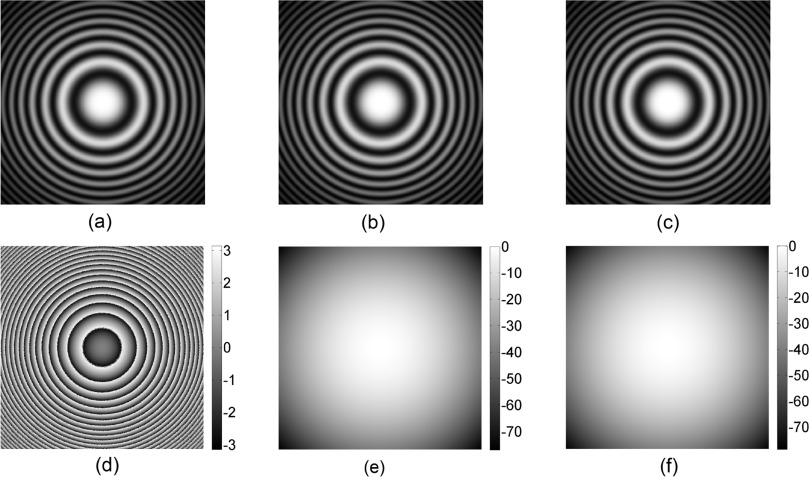
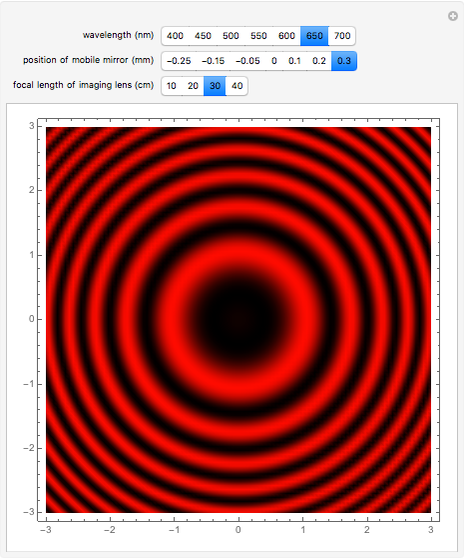
phase-shifting interferometry
is a relatively new method to measure height differences down to half a nanometer. This technique involves a two-beam interferometer with a moving reference mirror the position of which is controlled by a piezo-element
DIC microscopy
translates phase information into intensity variations. With this technique, a sensitivity down to step-heights of 1 nm can be achieved; with image editing the sensitivity can even be increased to one atomic layer (0.2 nm). Can show larger difference in height as compared to phase contrast microscopy. Can be used for example to scan the surface of a diamond.
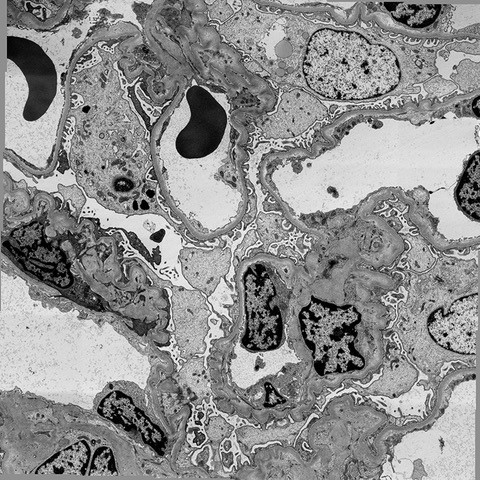
TEM
The electrons traverse the object and are projected as an image on a fluorescent screen via a system of magnetic lenses. The basic principle is the same as for an optical microscope with Köhler illumination. Stands for transmission electron microscopy.
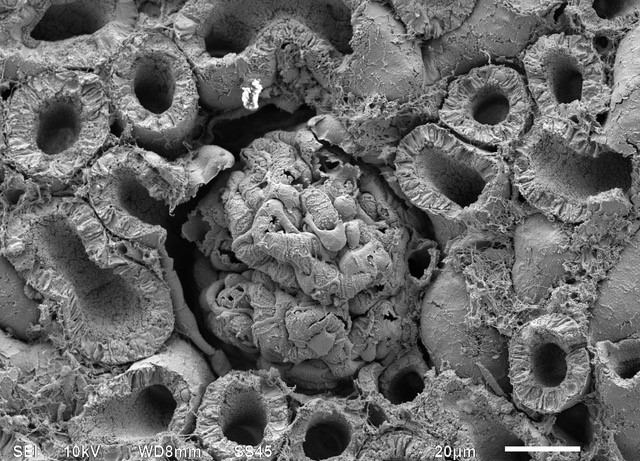
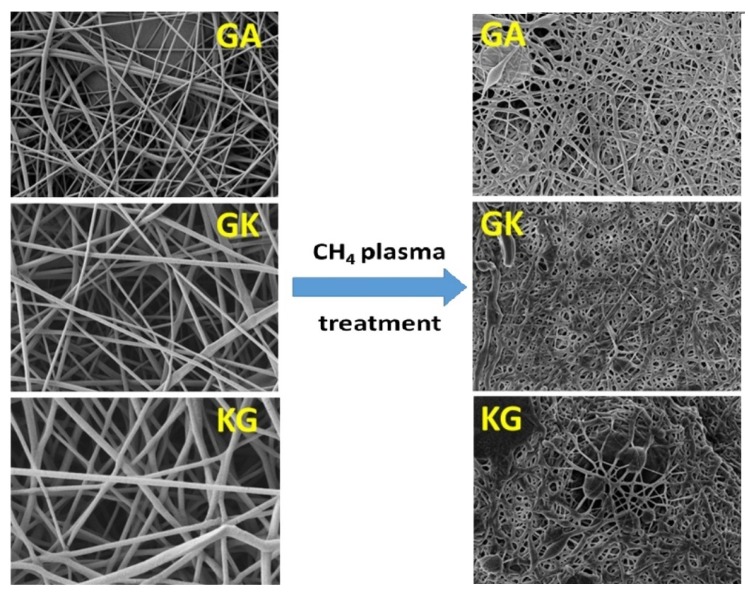
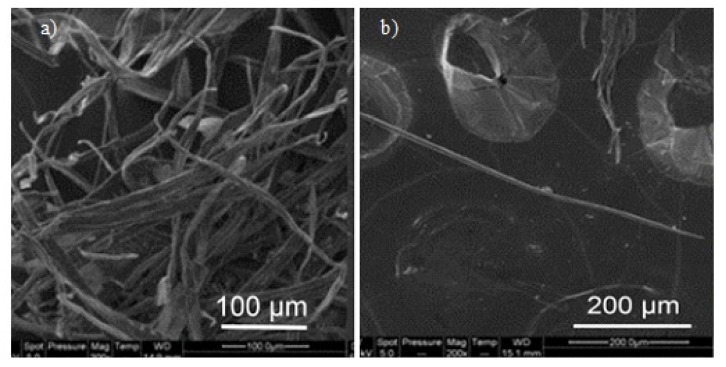
SEM
A focused beam of electrons scans the object and the amount of scattered or reflected electrons is recorded as a function of position, using a suitable detector. The resulting image is then captured and shown on a computer. Stands for scanning electron microscopy.
EDX (X-ray spectroscopy)
The X-rays that are created alongside the free electrons can also
be captured. The X-ray photons are most often detected by a cooled, biased lithium-doped silicon crystal that translates each incident photon into a small electric current.
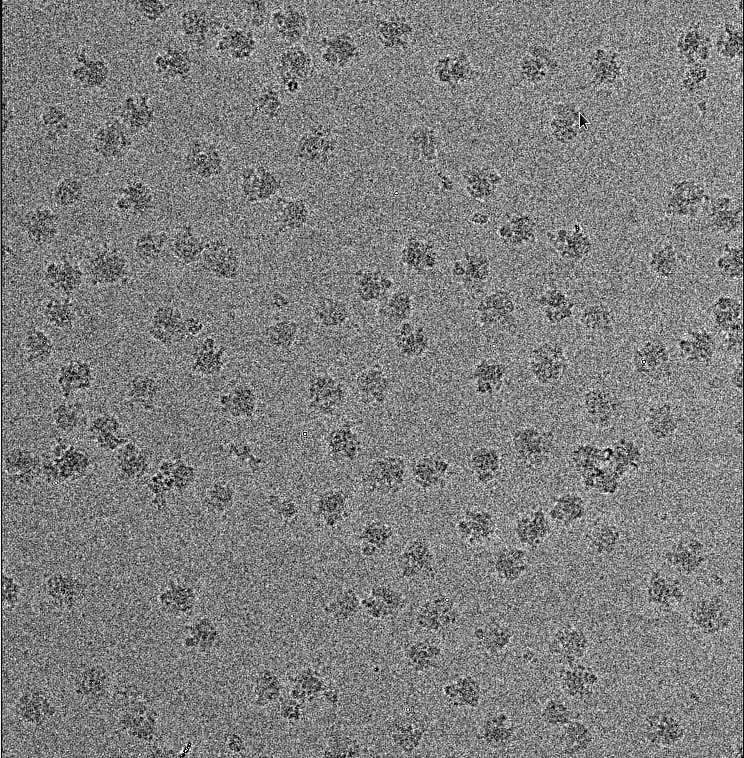
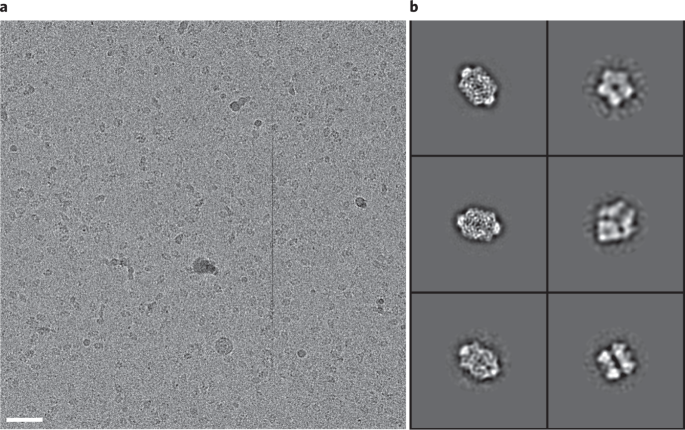
Cryo-electron microscopy
The invention of …, in which samples are imaged at cryogenic temperatures (below −150◦C), and using gentler electron beams, combined with significantly improved direct detection cameras and sophisticated image processing methods, have enabled the study of intact biomolecules in their native configuration, at (sub)atomic resolution.
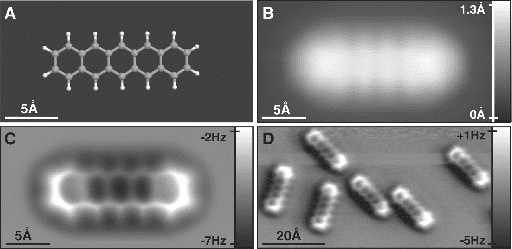
AFM (contact/tapping mode)
Measures the force between a sharp pointed tip and the object’s srface as a function of position. The main advantage of … with respect to STM, is that the object is not required to be electrically conductive. Alas, the resolution is lower. … consists of a lever with a sharp tip at its end that scans the specimen surface. The amount of bending or the resonance frequency of this cantilever is used as a measure of force.
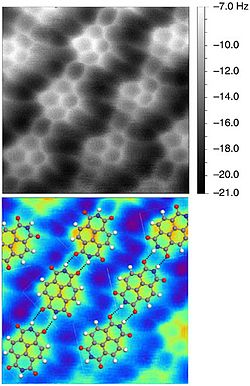
STM
measures the tunnelling current between a sharp metal tip and an
electrically conducting surface as a function of position. Tunnelling is a quantum-mechanical effect which allows electrons to jump from the tip to the sample (or vice versa) even if the energy barrier
exceeds the energy of the electrons. This barrier arises because of the small (a few ̊Angstr ̈oms) distance between the tip and the sample. The tunnelling current decreases rapidly with increasing distance, which makes it extremely sensitive for recording the smallest details, less than 1 ̊A, enabling the imaging of individual atoms, orbitals and molecular structures. Scanning Tunnelling Microscopy
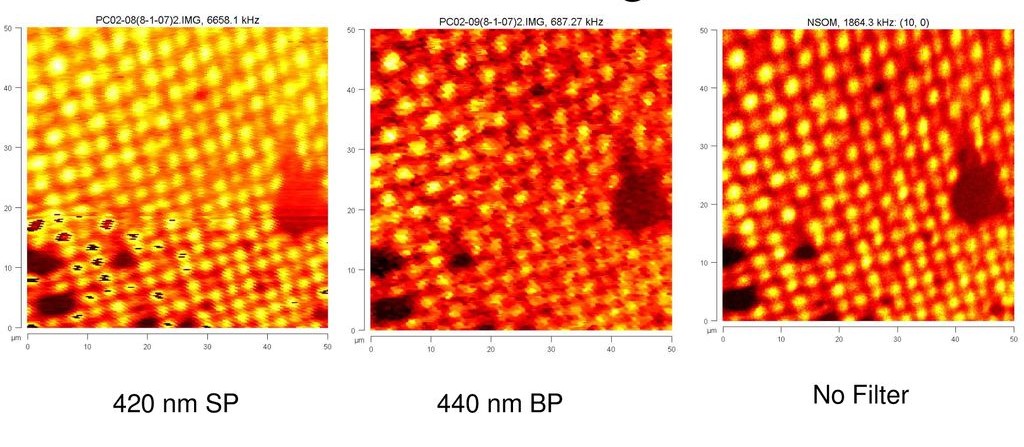
SNOM
by placing a thin plate of metal foil with an ultra-small hole in close
proximity to the object. The light that leaves the object is focused by a lens onto a detector. The illumination is near-field while the detection is far-field. If the metal plate (or the object) is translated while scanning, an image is obtained showing the optical properties of the surface as a function of position. A problem is that the yield of the light is very small. The intensity, I, that passes through the hole decreases with a decreasing hole diameter, w, according to I ∝ w6. Therefore, a very sensitive photomultiplier detector is required, which can detect single photons in some cases.
The second, more serious problem is to keep the distance, d, between the hole and the object constant at approximately 10 nm.
Nyquist’s sampling theorem
The object has to be sampled using a frequency that is at least two times the maximum desired frequency. If observable detail needs to be 1 mm, the distance between two pixels must be smaller than 0.5 mm. Lower resolution yields in loss of signal. Higher resolution yields less noice and avoids aliasing, but is results in bigger image to store.
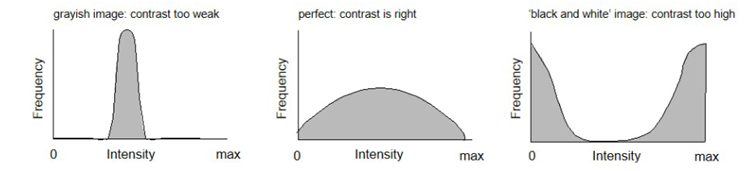
H(I) histogram shows the frequency of intensities (how often every intensity I(x,y) occurs in the image) as a function of I.
Geomteric transformation
I(x,y) → I(x’,y’)
Correction of image distortion due to drift, rotation, mirroring or deformation by poor optics, by transformation of coordinates
Point operators
I(x,y) = O{I(x,y)}
Mostly optimization of image intensity and contrast; in some case segmentation.
Local operators
O{I(x,y)+surrounding pixels}
Global operators
O{all pixels in I}
Storage capacity for an N x M image with n bits
- Black and white: N x M x n / (8 x 1024) kbytes
- Color: 3 x N x M x n / (8 x 1024) kbytes
The undeviated beam
these electrons pass the object unperturbed
elastically scattered electrons
the energy of the electrons remains the same, however, the direction is changed due to collisions with the atoms in the object
non-elastically scattered electrons
the electrons have transferred part of their energy to the object upon collision. This part is often relatively small.
Absorption within the object
an electron collides with another electron in one of the lower electronic shells of an atom in the object, ejecting it from its orbit. The incoming electron loses a lor of its kinetic energy.
backscattered electrons
electrons that have been rebounded elastically off the object’s atoms. Their energy remains nearly unchanged.
secondary electrons
a low-shell electron of the object is ejected from its orbit by an accelerated electron. Due to this, a seconf free electron is created aside from the original one. these electrons leave the object (after several additional collisions and other absorption events, freeing even more electrons), with a low velocity. This velocity corresponds to an energy of appr 50 eV. The advancement direction of the electrons leaving the object generally differs form the direction of the incident beam.
X-ray radiation
due to the generation of a secondary electron, a vacancy is created in a lower orbit of the atom. This vacancy is then filled by an electron from a higher orbit, thereby emitting an X-ray photon. The X-ray radiation, a side product of the creation of secondary electrons, has a discrete emission spectrum that is characteristic for each element. The X-ray emission spectra can be used to unravel the elemental composition of an area of one square micrometer on the object’s surface quite accurately.
Cathodeluminescene
due to collision events, it is possible for outer-shell electrons to be excited into a higher orbit or be freed completely (ionisation). A visible-light photon is emitted when such an electron falls back into its original orbit. This phenomenon is called …. and it is also used in computer screens which are irradiated by a scanning beam of electrons. The wavelength of the emitted photons is characteristic for molecules and crystal defects.

Histogram H(I) is an important diagnostic tool to analyse an image. It shows the frequency of intensities as a function of I. It can be used to verify if all possible intensities are used in equal amounts.
Far-field techniques
Capturing info at a distance far (in terms of the desired detail) from the object of interest. Examples: optical and electron microscopy, objective is located far from the specimen to be observed in both cases. Methods alter the object very little, but the maximum resolution is limited by the wavelength of the light or electrons that are used.
Near-field techniques
Capturing the information occurs very close to the object. The distance between the detector and the specimen is of the same order of magnitude as the desired detail. This category includes scanning probe techniques such as scanning tunning microscopy and atomic force microscopy. Technique uses an ultra-sharp tip that probes the surface of the object. Interaction between the tip and the object is very strong for this group techniques, although the resolution is remarkably high: individual atoms can be resolved.
Processing
by … the image details can be enhanced, which makes it easier to interpret images. Adapting the image can be done in the microscope itself as well as afterwards by using image processing techniques on a computer.

Spherical aberration
Rays of light entering the lens far from the optical axis do not meet the same focus point as those close to the optical axis; The result is a circle-symmetrical blurred image

Coma
Rays of light originating from the same point away from the optical axis do not meet in exactly one point. Coma causes specific, fanned out patterns
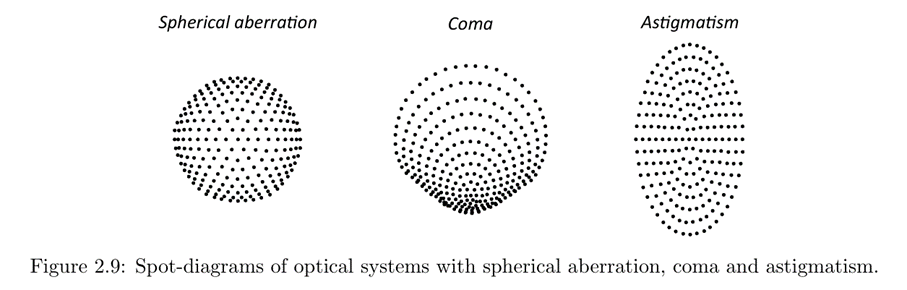
Astigmatism
Rays of light originating from one point away from the optical axis do not meet in one point, but a line close in front of the image plane, a circle in the image plane, and a line again behind the image plane. The second line is perpendicular to the first one
Curvature of the image
A sharp image of a at object perpendicular to the optical axis is no longer at but projected on a spherical surface. Either the center or the edges of the image could be focused sharply when looking at the object directly. This defect is catastrophic when a photo- or CCD-camera is used because the resulting image is never sharp over the whole area
Image deformation
The magnification changes with the distance to the optical axis. A square object is shown as barrel-shaped when the magnification decreases with the distance. A pincushion-shaped image is the result for the opposite situation
Chromatic dispersion
The focal length of the lens depends on the wavelength of the light. Images will get colored edges. This effect is a direct result of dispersion, i.e., the index of refraction of the glass varies slightly with the color of the light.
Kohler principle
Current microscopes use the Kohler principle for illuminating the sample. This method of illumination, shown in Figure 2.12, is defined by two independent paths of light, each with its own set of conjugated planes. Conjugated planes are optically equivalent planes, i.e. an object that is projected sharply in the first plane, will be sharp in each of the consecutive planes of the sequence.
Enhancement
Processing an image such that the desired information is visualized better compared to the original image. This can be used to enhance details by, for example, sharpening, noise filtering, contrast amplification and using false colours instead of greyscale.
Restoration
Whenever the original image is deformed during recording because of preparation faults, optical errors, detector flaws, or other problems, the image has to be restored. This is particularly important for quantitative measurements, when corrections for geometrical deformation, blurriness, vibrations, and drift are required.
Quantification
This comprises segmentation (recognition of distinct objects in an image), pattern recognition, counting and describing. It is used in missile guidance (e.g., homing target missiles) or text and human face recognition.