Energy and nutrient flow in ecosystems - Topic 9
1/84
There's no tags or description
Looks like no tags are added yet.
Name | Mastery | Learn | Test | Matching | Spaced | Call with Kai |
|---|
No analytics yet
Send a link to your students to track their progress
85 Terms
What is an ecosystem
Community of living organisms interacting with each other and with their physical environment
Ecosystems consist of both WHAT and WHAT components
Ecosystems consist of both BIOTIC and ABIOTIC components
Examples of abiotic components
Elements, climate, sunlight, air
Examples of biotic components
Microbes, plants, animals
Ecosystems can be studied by following the movement of WHAT from one level to another
Ecosystems can be studied by following the movement of ENERGY from one level to another
What are the two laws of thermodynamics
WHAT
WHAT
What are the two laws of thermodynamics
Law of conservation of ENERGY
Law of ENTROPY
Law of conservation of energy
Energy can be TRANSFORMED from one form into another or transferred from one place to another, but it cannot be CREATED or DESTROYED
Law of entropy
The entropy of a system and the surroundings will INCREASE—energy will always become MORE SPREAD OUT.
Entropy is the measure of how much energy has moved from being WHAT to becoming WHAT
Entropy is the measure of how much energy has moved from being LOCALIZED to becoming WIDELY DISPERSED
Ecosystems depend on a constant input of WHAT, and that energy transfer between trophic level is WHAT, limiting the structure and productivity of WHAT
Ecosystems depend on a constant input of ENERGY, and that energy transfer between trophic level is INEFFICIENT, limiting the structure and productivity of FOOD WEBS
There is always a WHAT of energy do to WHAT when you move up tho food chain
There is always a LOSS of energy do to HEAT when you move up tho food chain
Law of conservation of matter
Matter can neither be created nor destroyed, only transformed from one form into another
Law of conservation of matter
Atoms like carbon, nitrogen and phosphorus are WHAT through ecosystems
Matter cycles through WHAT and the WHAT
Unlike energy, matter is WHAT and WHAT
Law of conservation of matter
Atoms like carbon, nitrogen and phosphorus are RECYCLED through ecosystems
Matter cycles through ORGANISMS and the ENVIRONMENT
Unlike energy, matter is CONSERVED and REUSED
Law of conservation of matter
On Earth, this means the total amount of matter, including essential elements like WHAT, WHAT, and WHAT stays essentially constant over time.
Individual atoms that compose living organisms have long histories as they WHAT through the biosphere.
Nutrients circulate between abiotic environment and living organisms in WHAT
Law of conservation of matter
On Earth, this means the total amount of matter, including essential elements like CARBON, NITROGEN, and PHOSPHORUS, stays essentially constant over time.
Individual atoms that compose living organisms have long histories as they CYCLE through the biosphere.
Nutrients circulate between abiotic environment and living organisms in BIOGEOCHEMICAL CYCLES
Radiant energy:
The source of virtually all energy on Earth is the WHAT
Radiant energy:
The source of virtually all energy on Earth is the SUN
Radiant energy:
About 33% of the energy received is WHAT by the atmosphere back into space
Radiant energy:
About 33% of the energy received is REFLECTED by the atmosphere back into space
Radiant energy:
Of the remainder, about 42% provides WHAT to the Earth’s surface and less than 1% is captured by WHAT and forms the basis for our WHAT
Radiant energy:
Of the remainder, about 42% provides HEAT to the Earth’s surface and less than 1% is captured by PHOTOSYNTHESIZERS and forms the basis for our ECOLOGICAL SYSTEMS
WHAT makes up most of the atmosphere
NITROGEN makes up most of the atmosphere
Autotrophs = WHAT
Autotrophs = PRODUCERS
Autotrophs definition
Synthesize their own organic compounds
What are the two types of autotrophs?
WHAT
WHAT
What are the two types of autotrophs?
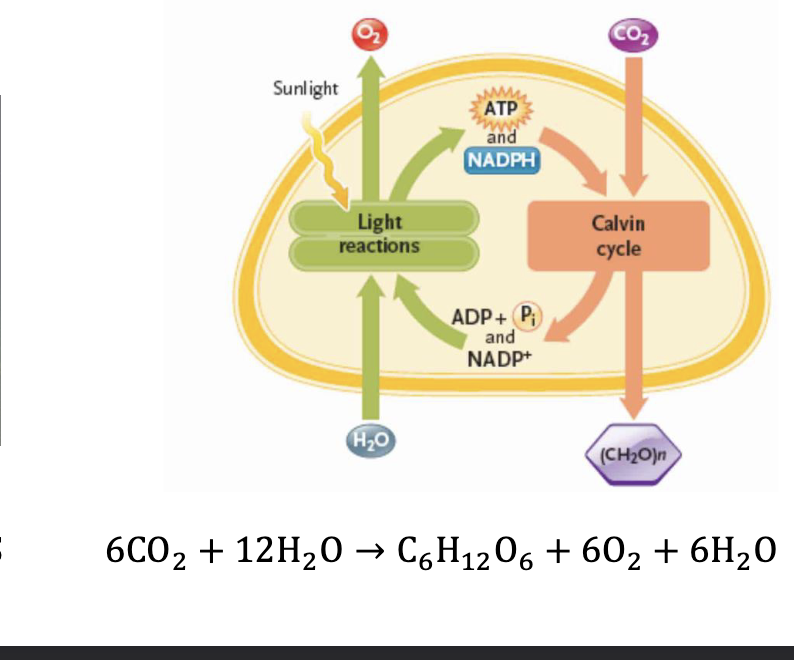
Photoautotrophs (phototrophs)
Chemoautotrophs
Photoautotrophs
The energy from LIGHT used to drive conversion of CARBON DIOXIDE into ORGANIC COMPOUNDS
Chemoautotrophs
Use CHEMICAL compounds as the source of ENERGY (no sunlight)
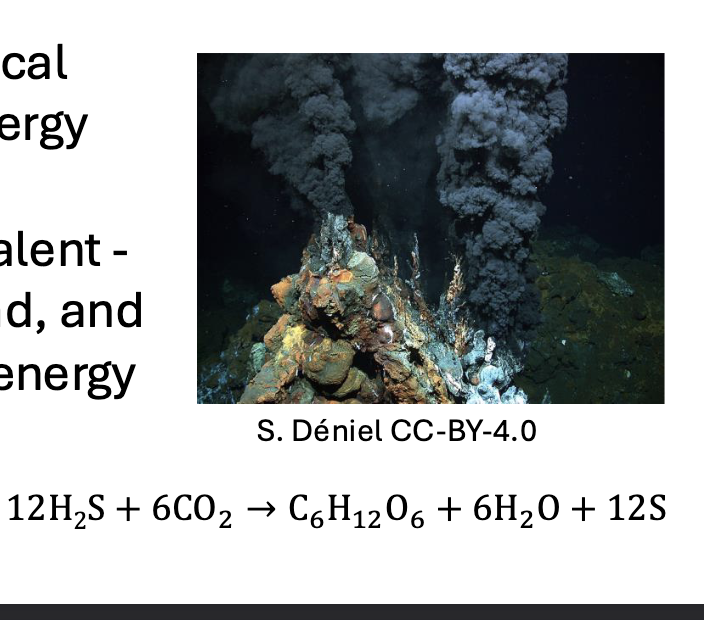
WHAT are more prevalent - sunlight is WHAT, widespread, and WHAT energy, whereas chemical energy sources are more WHAT and WHAT.
PHOTOAUTOTROPHS are more prevalent - sunlight is ABUNDANT, widespread, and HIGH energy, whereas chemical energy sources are more LIMITED and LOCALIZED
What are the two measures of the productivity of an ecosystem
WHAT
WHAT
What are the two measures of the productivity of an ecosystem
Gross primary productivity (GPP)
Net primary productivity (NPP)
Gross primary productivity (GPP)
The rate at which PRODUCERS convert solar energy into chemical energy (photoautotrophs)
Net primary productivity (NPP)
The REMAINING chemical energy after deducting energy used for MAINTENANCE functions of producers
The measurements are measured in units if WHAT captured (WHAT) or in units of WHAT (carbon) created (WHAT)
The measurements are measured in units if ENERGY captured (kJ/m2/time) or in units of BIOMASS (carbon) created (C/m²/time)
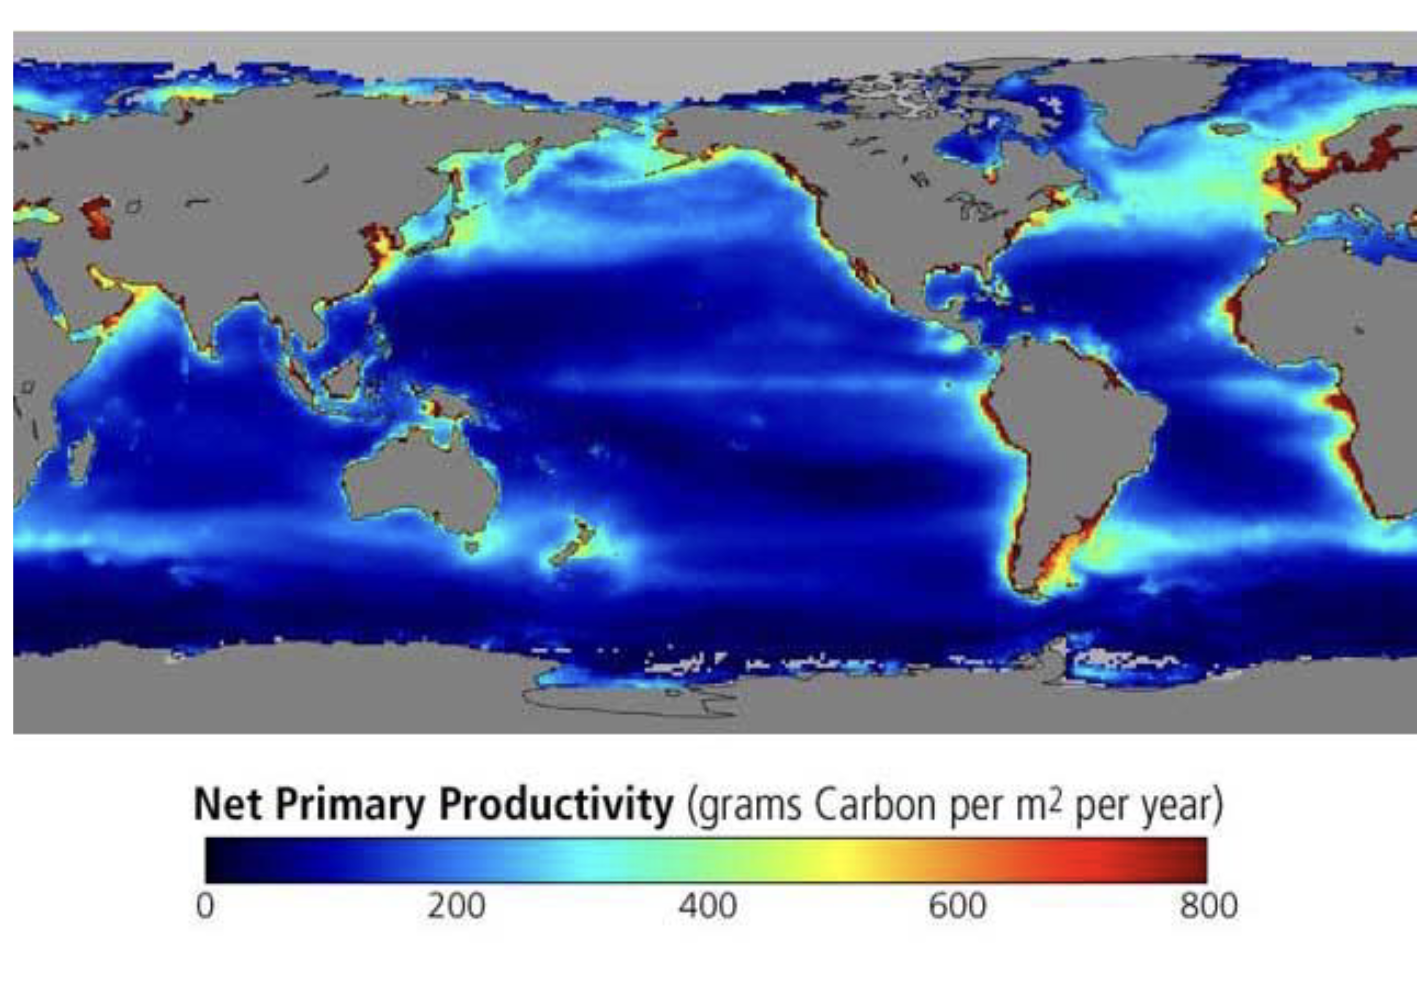
Primary productivity: In marine environments, the most productive areas are:
WHAT due to nutrient runoff, sunlight throughout shallower waters
Parts of the ocean where WHAT from the deep ocean return nutrients to the surface layers where photosynthetic activity occur
Primary productivity: In marine environments, the most productive areas are:
COASTAL ZONES due to nutrient runoff, sunlight throughout shallower waters
Parts of the ocean where UPWELLINGS from the deep ocean return nutrients to the surface layers where photosynthetic activity occur
Primary productivity can be limited by:
WHAT
WHAT
WHAT
WHAT
Primary productivity can be limited by:
Sunlight
Climate (annual temperature and precipitation)
Nutrients availability
How much PHOTOSYNTHETIC TISSUE is present
When is NPP highest in Canada
Summer because we get more sunlight, longer days, therefore more plant growth
Factors influencing primary productivity - Sunlight
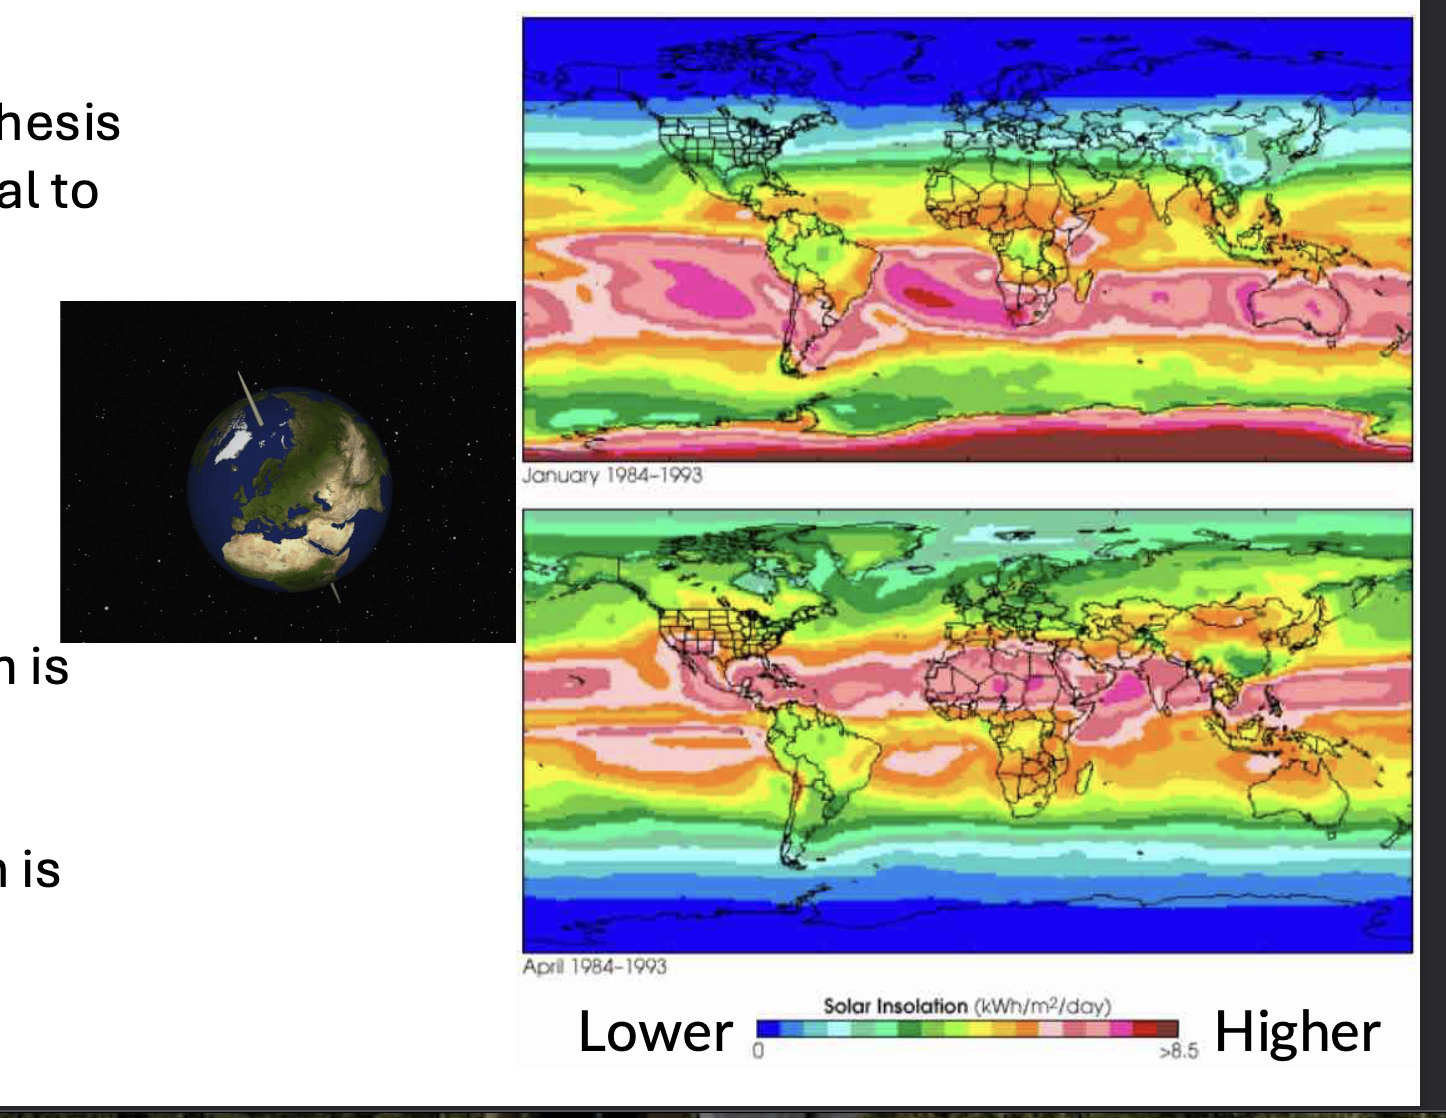
The potential rate of photosynthesis in an ecosystem is proportional to the HWAT and WHAT of sunlight, which varies geographically and seasonally
Factors influencing primary productivity - Sunlight
The potential rate of photosynthesis in an ecosystem is proportional to the INTENSITY and DURATION of sunlight, which varies geographically and seasonally
Factors influencing primary productivity - Sunlight
Sunlight is most intense and day length is least variable near the WHAT
Sunlight is less intense and day length is most variable near the WHAT
Factors influencing primary productivity - Sunlight
Sunlight is most intense and day length is least variable near the EQUATOR
Sunlight is less intense and day length is most variable near the POLES
Factors influencing primary productivity - Climate
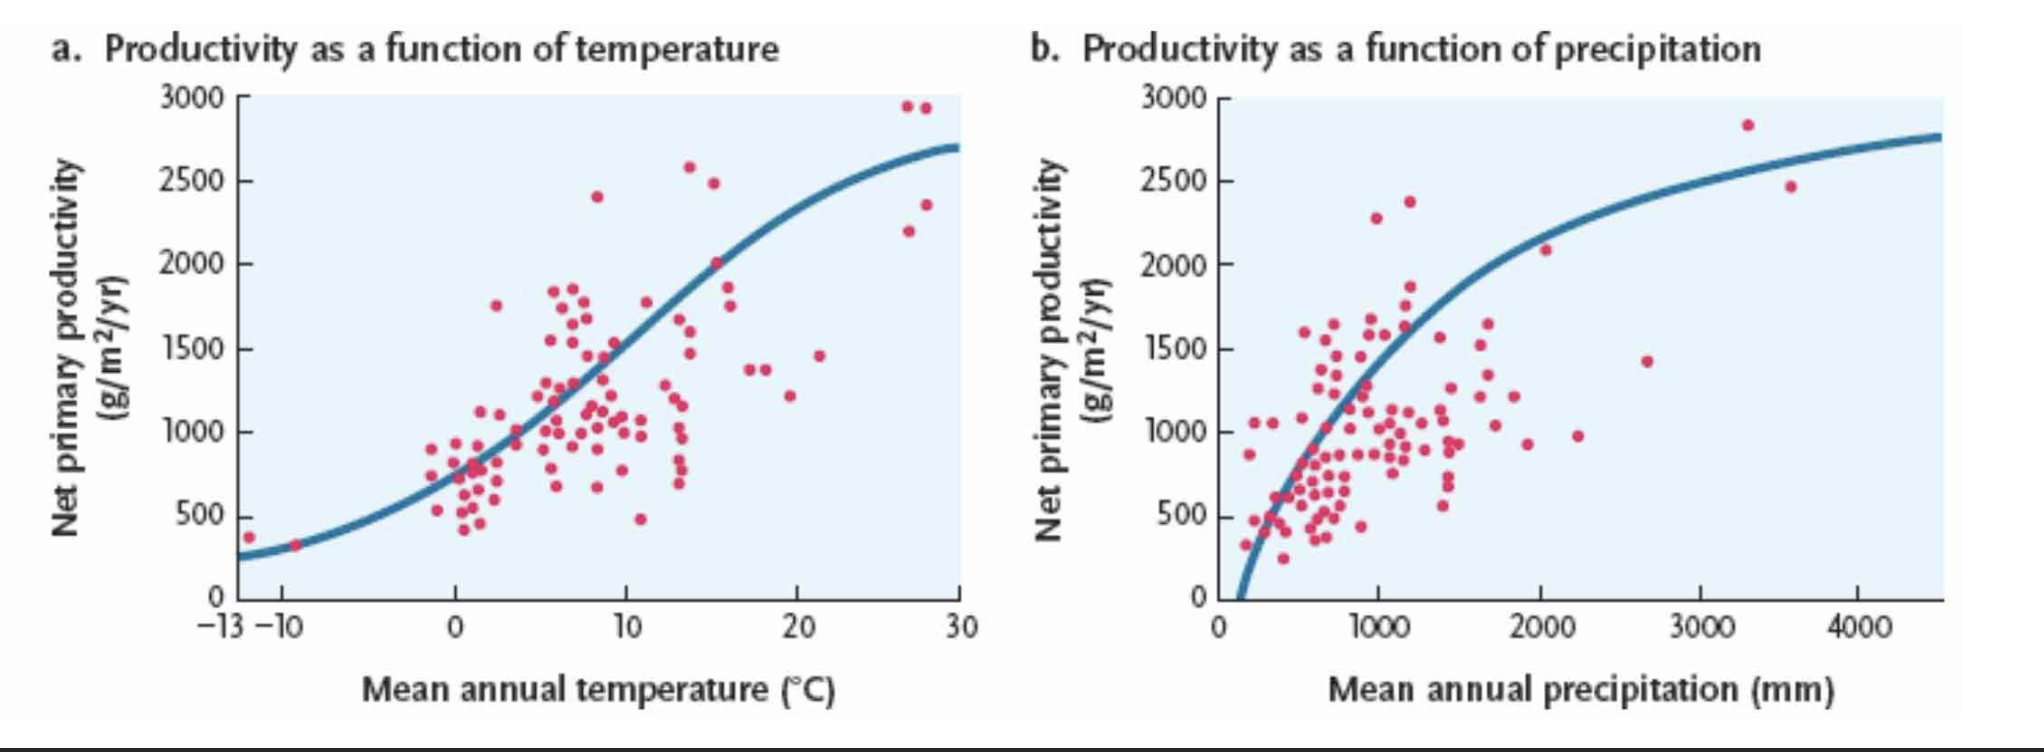
In terrestrial ecosystems, mean annual net primary productivity increases with both
mean annual WHAT
mean annual WHAT
Speeds up WHAT
Factors influencing primary productivity - Climate
In terrestrial ecosystems, mean annual net primary productivity increases with both
mean annual TEMPERATURE
mean annual PERCIPITATION
Speeds up PHOTOSYNTHESIS
Factors influencing primary productivity - Nutrients
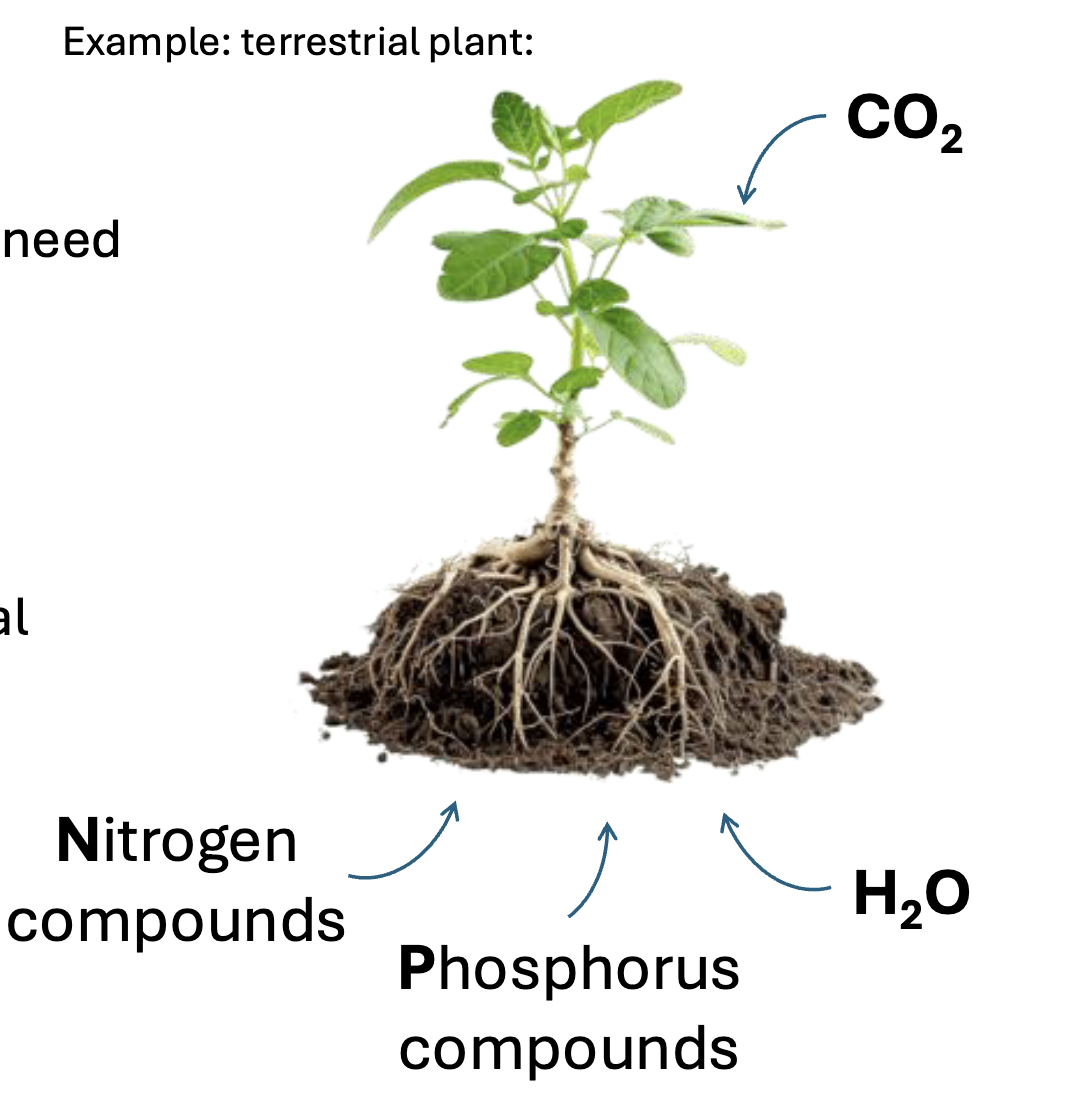
Where do organisms get the ingredients they need to make biomolecules
Need sources of: WHAT, WHAT, WHAT, WHAT and WHAT
Consumers get from WHAT organic matter
Producers get from the WHAT
Factors influencing primary productivity - Nutrients
Where do organisms get the ingredients they need to make biomolecules
Need sources of: C, N, P, O and H
Consumers get from EATING organic matter
Producers get from the ENVIRONMENT
What are made from these sources: C, N, P, O and H
DNA, Proteins
Factors influencing primary productivity - Nutrients
All plants need WHAT of nutrients for maintenance and photosynthesis
If the concentration of one nutrient drops below a critical level, WHAT (and thus WHAT) may stop
One nutrient usually becomes a WHAT (has the greatest effect on capping productivity
Factors influencing primary productivity - Nutrients
All plants need SPECIFIC RATIOS of nutrients for maintenance and photosynthesis
If the concentration of one nutrient drops below a critical level, PHOTOSYNTHESIS (and thus PRODUCTION) may stop
One nutrient usually becomes a LIMITING NUTRIENT (has the greatest effect on capping productivity
How to determine the limiting nutrient
Add nutrients and measuring increasing WHAT
Other nutrients may be partially limiting but not the principal bottleneck, addition may result in smaller increases in WHAT
How to determine the limiting nutrient
Add nutrients and measuring increasing NPP
Other nutrients may be partially limiting but not the principal bottleneck, addition may result in smaller increases in NPP
Limiting nutrients can WHAT among ecosystems
Limiting nutrients can VARY among ecosystems
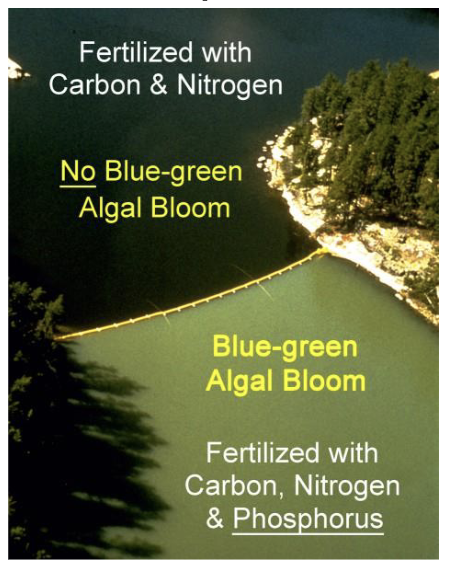
Freshwater ecosystem
generally limited by WHAT
WHAT binds strongly to soil, limited WHAT
Small increases cause large WHAT
Freshwater ecosystem
generally limited by PHOSPHOROUS
P binds strongly to soil, limited NATURAL RUNOFF
Small increases cause large ALGAL BLOOMS

Terrestrial ecosystems:
Generally limited by WHAT
Requires WHAT from atmosphere (by WHAT in soil, some plants)
Easily lost from soil through WHAT
Terrestrial ecosystems:
Generally limited by NITROGEN
Requires FIXATION from atmosphere (by BACTERIA in soil, some plants)
Easily lost from soil through LEACHING
Factors influencing primary productivity - Nitrogen
Nitrogen (N) is needed to build WHAT, but it is often WHAT
The positive response to N fertilizer in all but WHAT ecosystems can be interpreted as evidence for widespread N limitation to productivity
Factors influencing primary productivity - Nitrogen
Nitrogen (N) is needed to build PROTEIN, but it is often LIMITING
The positive response to N fertilizer in all but DESERT ecosystems can be interpreted as evidence for widespread N limitation to productivity
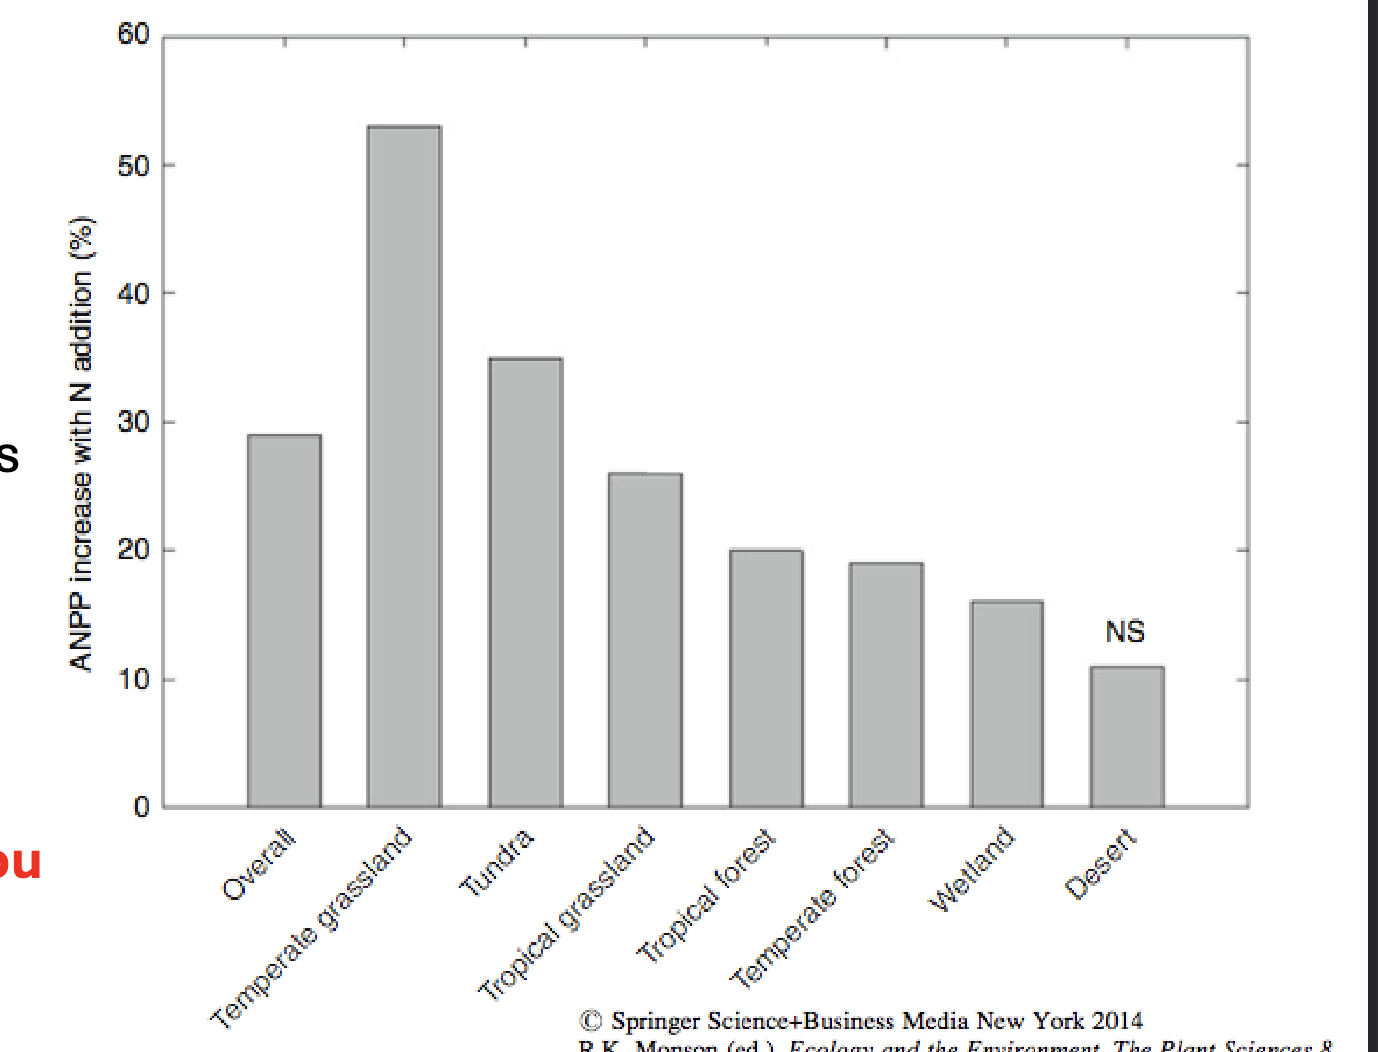
Why aren’t desserts limiting in nitrogen
Because they are more limiting in water than nitrogen
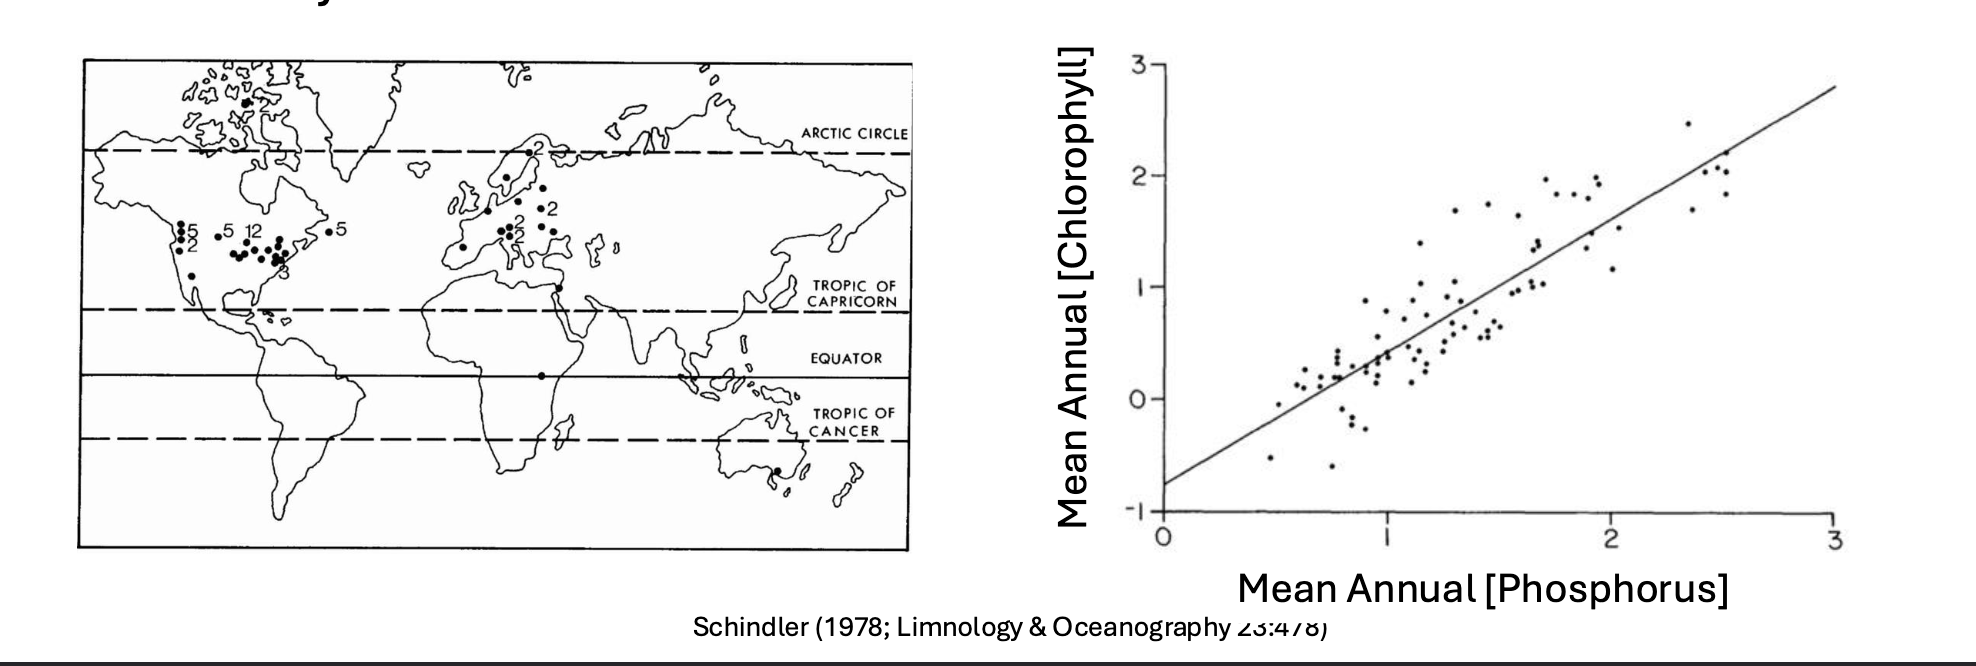
Factors influencing primary productivity - Phosphorus
Living things require phosphorous (ATP, DNA, phospholipids)
Phosphorus is usually the limiting nutrient for WHAT growth in freshwater systems.
When more phosphorus is available:
• Phytoplankton WHAT increases
• WHAT concentration (a proxy for algal biomass) increases
• Water WHAT decreases
Factors influencing primary productivity - Phosphorus
Living things require phosphorous (ATP, DNA, phospholipids)
Phosphorus is usually the limiting nutrient for PHYTOPLANKTON growth in freshwater systems.
When more phosphorus is available:
• Phytoplankton BIOMASS increases
• CHLOROPHYLL concentration (a proxy for algal biomass) increases
• Water CLARITY decreases
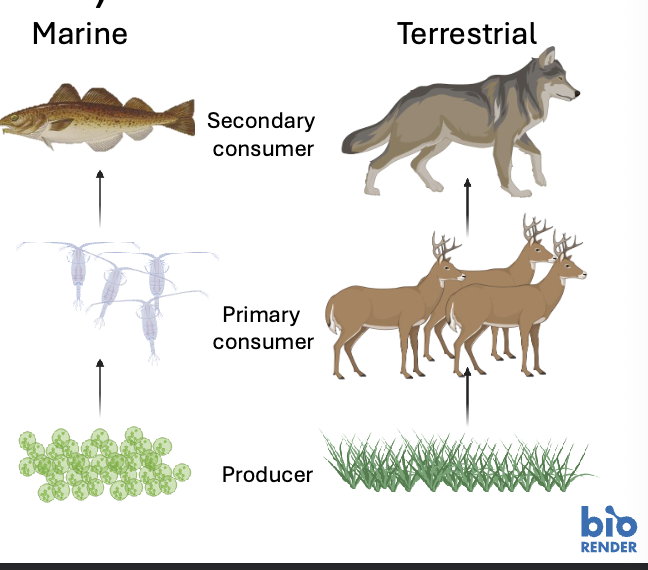
Heterotrophs (consumers)
Organisms that cannot make their own food

Heterotrophs (consumers) obtain energy by WHAT
Heterotrophs (consumers) obtain energy by EATING other organisms ( Plants, animals or both)

Heterotrophs (consumers) depend on WHO directly or indirectly
Heterotrophs (consumers) depend on PRODUCERS directly or indirectly

Secondary production
As animals eat plants, energy is transferred from producers to consumers
Some of this energy is stored in NEW consumer BIOMASS
How do we know who is eating who
WHAT
WHAT
WHAT
WHAT
WHAT
How do we know who is eating who
Observation (I saw something eat something else)
Stomach content analysis
Scat analysis (sorting through or DNA metabarcoding)
Stable isotopes (C, N, other tracers)
A combination of these
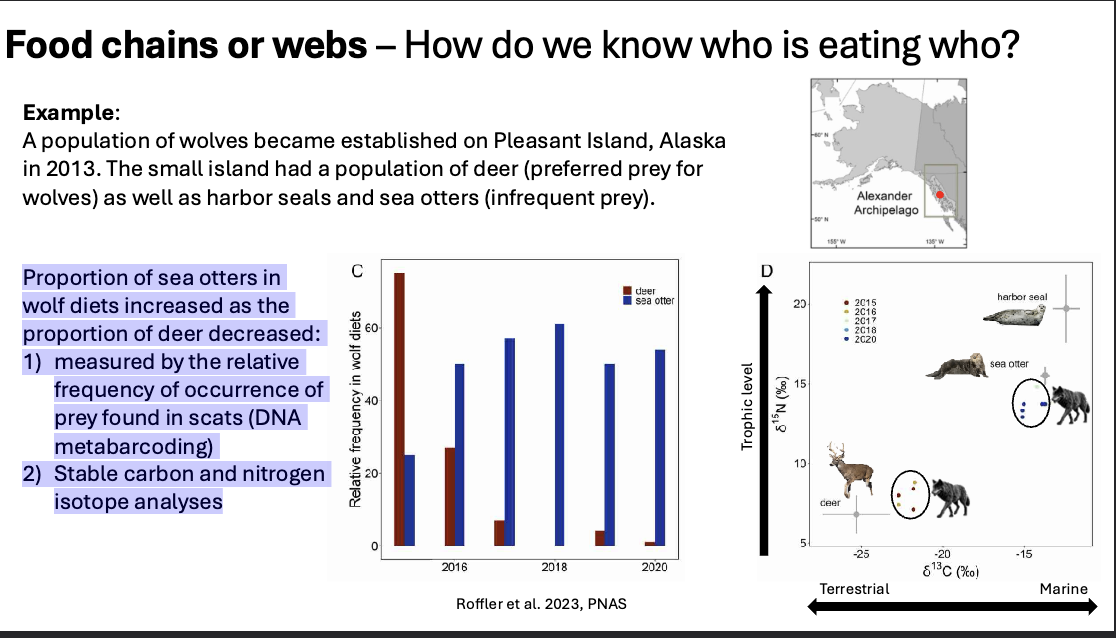
Food chains or webs - how do we know who is eating who
Example:
A population of wolves became established on Pleasant Island, Alaska in 2013. The small island had a population of deer (preferred prey for wolves) as well as harbor seals and sea otters (infrequent prey).
Proportion of sea otters in wolf diets increased as the proportion of deer decreased:
WHAT
WHAT
Food chains or webs - how do we know who is eating who
Example:
A population of wolves became established on Pleasant Island, Alaska in 2013. The small island had a population of deer (preferred prey for wolves) as well as harbor seals and sea otters (infrequent prey).
Proportion of sea otters in wolf diets increased as the proportion of deer decreased:
measured by the relative frequency of occurrence of prey found in scats (DNA metabarcoding)
Stable carbon and nitrogen isotope analyses
Food chains or webs - Energy and trophic levels
Inefficiency of WHAT from one trophic level to the next has profound effects on WHAT structure
Food chains or webs - Energy and trophic levels
Inefficiency of ENERGY TRANSFER from one trophic level to the next has profound effects on ECOSYSTEM structure

Food chains or webs - Energy and trophic levels
each trophic level contains only about WHAT as much energy as the trophic level below it
Food chains or webs - Energy and trophic levels
each trophic level contains only about 10% as much energy as the trophic level below it
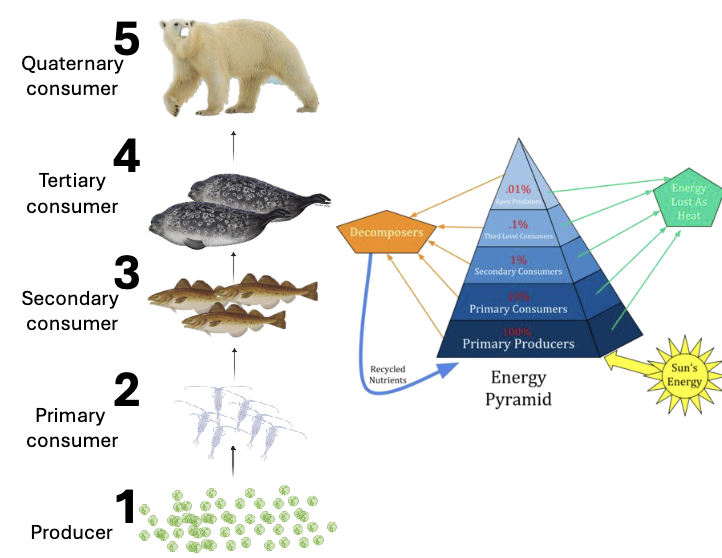
Food chains or webs - Energy and trophic levels
The reduction of energy and biomass with increasing trophic level affects sizes of populations of organisms at the WHAT of a food webs
Food chains or webs - Energy and trophic levels
The reduction of energy and biomass with increasing trophic level affects sizes of populations of organisms at the TOP of a food webs

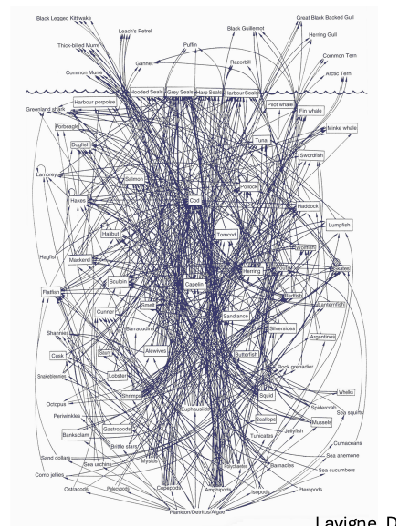
Food webs can be WHAT
Food webs can be COMPLEX

In nature, organisms may consume many different WHAT and WHAT, and trophic positions are often not whole numbers
In nature, organisms may consume many different PRODUCERS and CONSUMERS, and trophic positions are often not whole numbers
Secondary productivity
How much energy is stored
Secondary productivity
As animals eat plants, energy is transferred from WHAT to WHAT
Some of this energy is WHAT and some is stored in WHAT (WHAT)
Secondary productivity
As animals eat plants, energy is transferred from PRODUCERS to CONSUMERS
Some of this energy is USED and some is stored in TISSUE (CONSUMER BIOMASS)
Assimilation = WHAT
Assimilation = Ingestion (energy consumed) - Egestion (energy excreted)
Secondary productivity (sp) = WHAT
Secondary productivity (sp) = Assimilation (energy kept) - Respiration
Net production efficiency
How much energy is STORED relative to energy ASSIMILATED from food
Net production efficiency (NPE) = WHAT
Net production efficiency (NPE) = (Secondary productivity / Assimilation) x100
Ecological efficiency
How much energy is in consumer biomass relative to net primary productivity
Ecological efficiency (EE) = WHAT
Ecological efficiency (EE) = (Secondary productivity / Net production efficiency) x 100
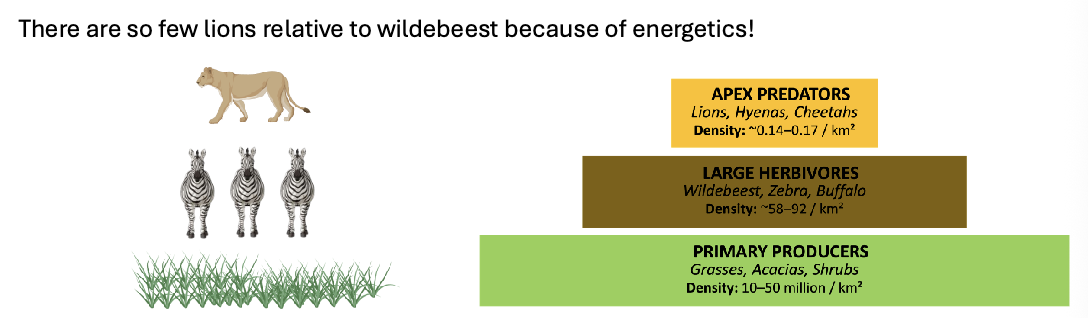
The vast grasslands capture enormous amounts of solar energy through photosynthesis (WHAT). What's left after plant respiration is potentially available to grazers (WHAT). The biomass wildebeest and zebra build (WHAT) from what they eat is only a fraction of what the grasses produced (WHAT). And of that wildebeest and zebra biomass, only around 10% is available to lions because energy is lost at every step of the food chain to respiration, waste, and inefficient transfer (WHAT).
There are so few lions relative to wildebeest because of WHAT!
The vast grasslands capture enormous amounts of solar energy through photosynthesis (GPP). What's left after plant respiration is potentially available to grazers (NPP). The biomass wildebeest and zebra build (SP) from what they eat is only a fraction of what the grasses produced (NPE). And of that wildebeest and zebra biomass, only around 10% is available to lions because energy is lost at every step of the food chain to respiration, waste, and inefficient transfer (EE).
There are so few lions relative to wildebeest because of ENERGETICS!
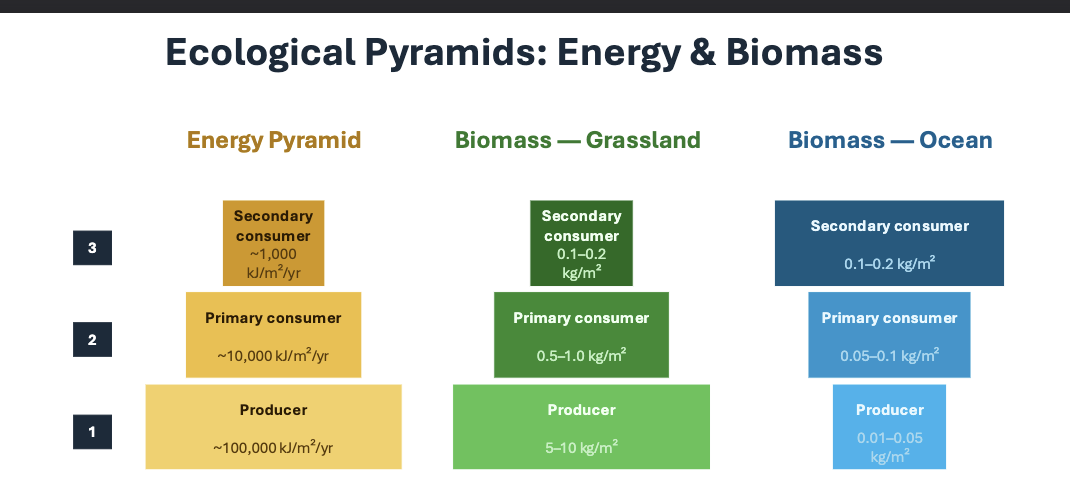
Why is there a inversion in the ocean biomass
Terrestrial producers: SLOW turnover → Relatively HIGH standing biomass
Phytoplankton (T1 producer): divides in hours → Relatively LOW standing biomass Inverted pyramid ≠ violation of thermodynamics

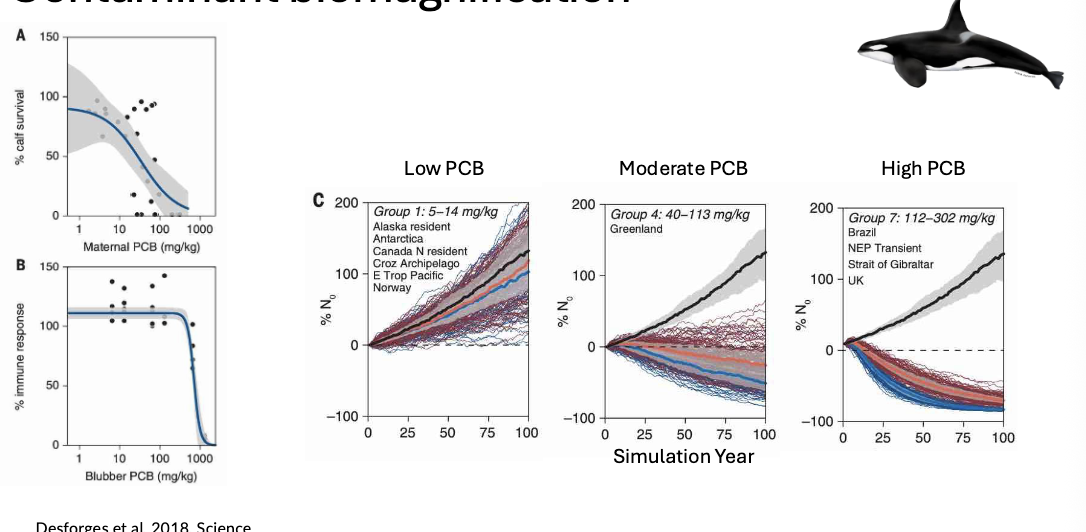
Contaminant biomagnification
Lipophilic, synthetic compounds, that:
WHAT
WHAT
Toxic at relatively WHAT concentrations
Contaminant biomagnification
Lipophilic, synthetic compounds, that:
BIOACCUMALATE
BIOMAGNIFY
Toxic at relatively LOW concentrations

bioaccumulate
increase in concentration over the LIFETIME of an organism

biomagnify
increase in concentration with increasing TROPHIC LEVEL
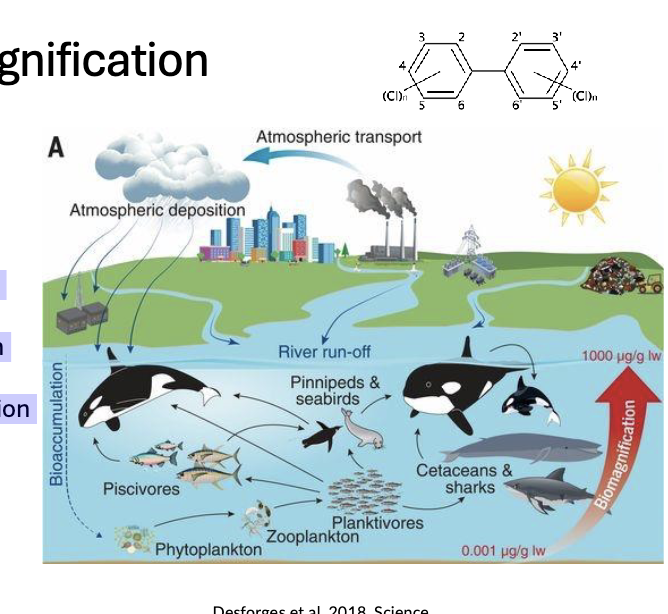
Example: Contaminant biomagnification
What are the two forces regulating trophic structure:
WHAT
WHAT
What are the two forces regulating trophic structure:
Bottom-up control
Top-down control
Bottom up control
When the abundance of organisms at LOWER trophic levels (plants or phytoplankton) determines the abundance of organisms at HIGHER trophic levels
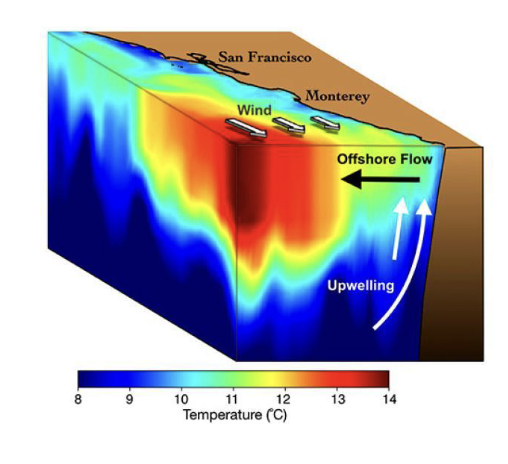
Bottom-up control
WHAT - cold, nutrient-rich deep water moves to the surface
Nutrients fuels WHAT blooms, which in turns supports WHAT abundances of plankton, fish, seabirds and marine mammals
Bottom-up control
UPWELLING - cold, nutrient-rich deep water moves to the surface
Nutrients fuels PHYTOPLANKTON blooms, which in turns supports HIGHER abundances of plankton, fish, seabirds and marine mammals

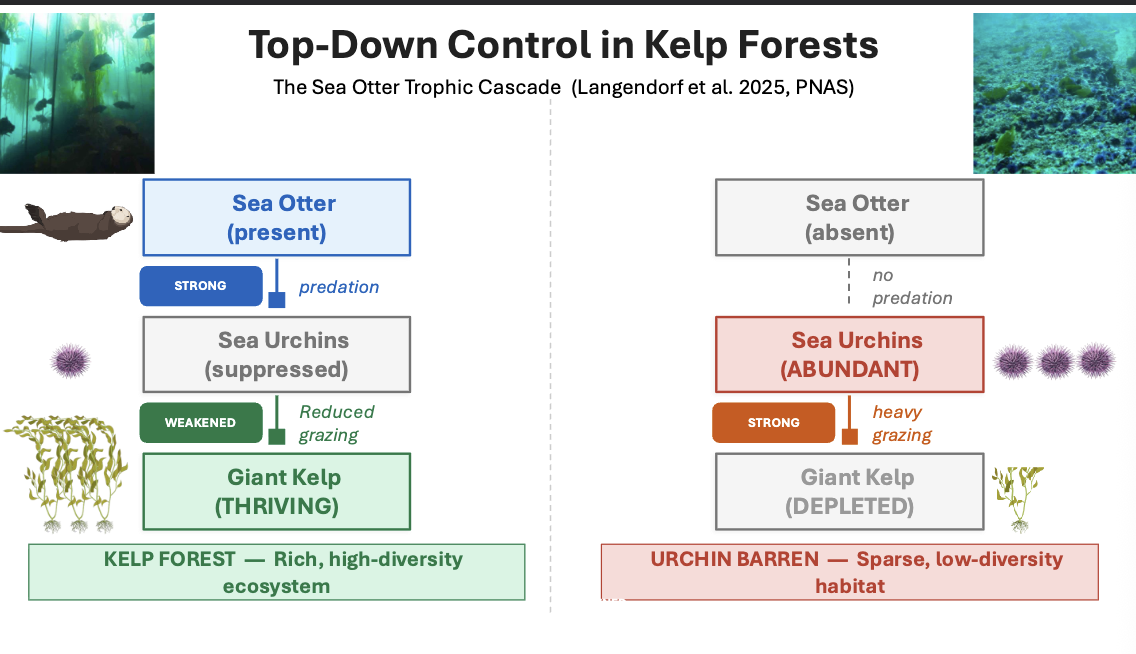
Top-down control
When predators at the TOP of the food web influence both the herbivores they eat and the plants on which herbivores feed

Top-down control
Sea otters consume WHAT , which feed on kelp
Removal of sea otters leads to WHAT of kelp forests
Top-down control
Sea otters consume URCHINS, which feed on kelp
Removal of sea otters leads to DEGRADATION of kelp forests
Disrupting biogeochemical cycles - Phosphorous
Whole-lake experiments that identified phosphorus as the culprit behind toxic WHAT formations (eutrophication) in lakes
Disrupting biogeochemical cycles - Phosphorous
Whole-lake experiments that identified phosphorus as the culprit behind toxic BLUE-GREEN ALGAL BLOOM formations (eutrophication) in lakes
Disrupting biogeochemical cycles - Nitrogen
Nitrogen is the most prevalent gas (N2) in the atmosphere, so why is it often limiting
N2 is not a WHAT form for plants, It has a WHAT bond that requires significant energy to break
Disrupting biogeochemical cycles - Nitrogen
Nitrogen is the most prevalent gas (N2) in the atmosphere, so why is it often limiting
N2 is not a USABLE form for plants, It has a TRIPLE bond that requires significant energy to break
Disrupting biogeochemical cycles - Nitrogen
Fritz Haber produced a method to make WHAT from N2 and hydrogen gas
Carl Bosch was an engineer who helped to scale the process
Disrupting biogeochemical cycles - Nitrogen
Fritz Haber produced a method to make AMMONIA from N2 and hydrogen gas
Carl Bosch was an engineer who helped to scale the process
Disrupting biogeochemical cycles - Nitrogen
Today, the Haber-Bosch process accounts for roughly half of all WHAT on Earth, affecting ecosystems and contributing to WHAT.
Disrupting biogeochemical cycles - Nitrogen
Today, the Haber-Bosch process accounts for roughly half of all REACTIVE NITROGEN on Earth, affecting ecosystems and contributing to EUTROPHICATION.
Disrupting biogeochemical cycles - Nitrogen
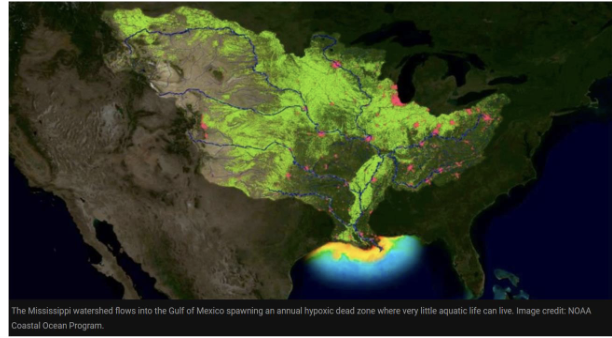
Excess nitrogen-based fertilizer from agriculture in the Mississippi River basin can wash off fields during rainstorms or leach through soil into streams and eventually to the Gulf of Mexico.
In the Gulf, the extra nitrogen fuels massive WHAT. When algae die and sink, bacteria that decompose them use up WHAT in the bottom waters.
This eutrophication process creates very WHAT levels - fish and other marine life either flee or die, forming the seasonal “WHAT.”
Disrupting biogeochemical cycles - Nitrogen
Excess nitrogen-based fertilizer from agriculture in the Mississippi River basin can wash off fields during rainstorms or leach through soil into streams and eventually to the Gulf of Mexico.
In the Gulf, the extra nitrogen fuels massive ALGAL BLOOMS. When algae die and sink, bacteria that decompose them use up OXYGEN in the bottom waters.
This eutrophication process creates very LOW OXYGEN levels - fish and other marine life either flee or die, forming the seasonal “DEAD ZONE.”
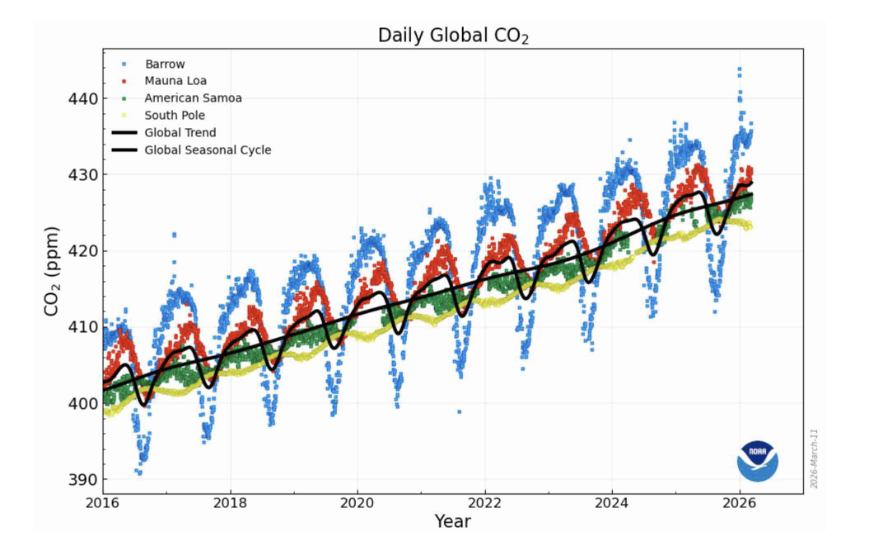
Disrupting biogeochemical cycles - Carbon
Carbon has been WHAT in recent years
CO2 decreases in summer because HWAT
CO2 increases in winter because WHAT
Disrupting biogeochemical cycles - Carbon
Carbon has been INCREASING in recent years
CO2 decreases in summer because Trees bloom and take in CO2
CO2 increases in winter because leaves die and get decomposed releasing CO2
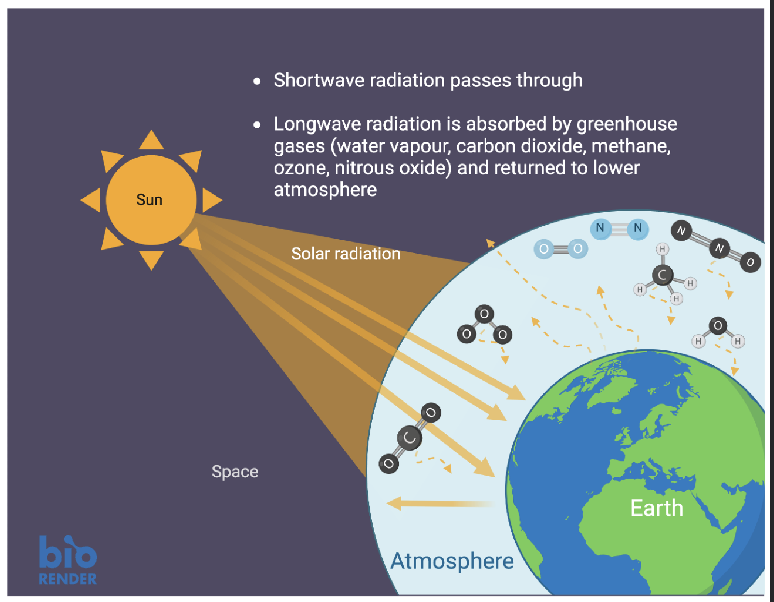
Greenhouse effect
What do you think would happen if you removed all water vapour, carbon dioxide, and methane from the atmosphere?
What would happen if you increased the amounts of water vapour, carbon dioxide, and methane in the atmosphere?
Greenhouse effect
What do you think would happen if you removed all water vapour, carbon dioxide, and methane from the atmosphere? TOO COLD
What would happen if you increased the amounts of water vapour, carbon dioxide, and methane in the atmosphere? TOO HOT
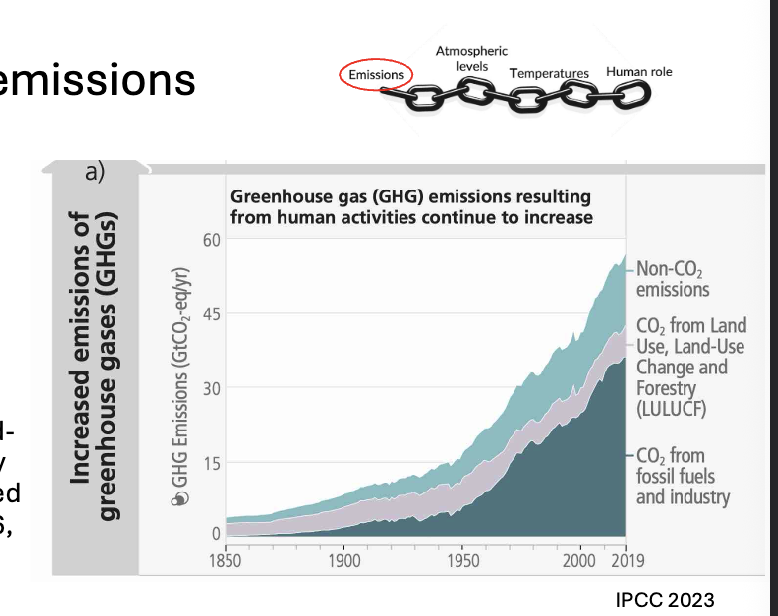
Climate change A causal chain - emissions
Emissions of WHAT have increased rapidly over recent decades.
Global net GHG emissions from humans include
CO2 from WHAT combustion and industrial processes
CO2 from land use, land- use change and forestry
WHAT; WHAT and fluorinated gases (HFCs, PFCs, SF6, NF3)
Climate change A causal chain - emissions
Emissions of GHG have increased rapidly over recent decades.
Global net GHG emissions from humans include
CO2 from FOSSIL FUEL combustion and industrial processes
CO2 from land USE, land- use change and FORESTRY
CH4; N2O and fluorinated gases (HFCs, PFCs, SF6, NF3)
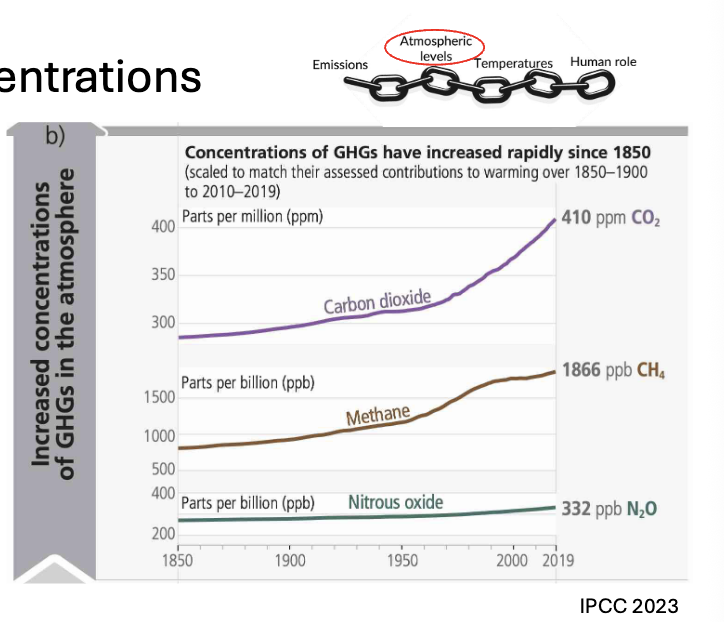
Climate change Atmospheric concentrations
Emissions have led to increases in the atmospheric concentrations of several GHGs including the three major well- mixed GHGs WHAT, WHAT and WHAT
Concentrations of WHAT and WHAT have increased to levels unprecedented in at least 800,000 years
Current WHAT concentrations are higher than at any time over at least the past two million years.
Climate change Atmospheric concentrations
Emissions have led to increases in the atmospheric concentrations of several GHGs including the three major well- mixed GHGs CO2, CH4 and N2O
Concentrations of CH4 and N2O have increased to levels unprecedented in at least 800,000 years
Current CO2 concentrations are higher than at any time over at least the past two million years.
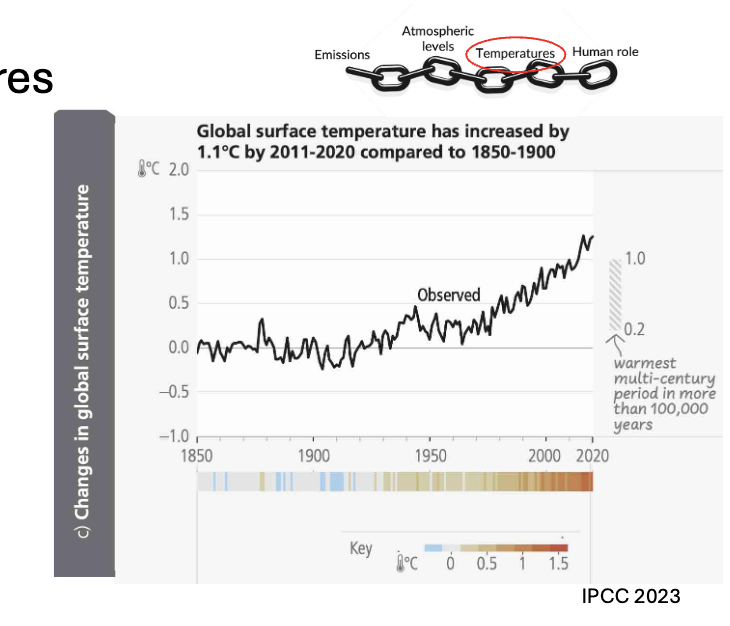
Climate change Global temperatures
The global surface temperature (shown as annual anomalies from a 1850–1900 baseline) has increased by around WHAT°C since 1850–1900
Climate change Global temperatures
The global surface temperature (shown as annual anomalies from a 1850–1900 baseline) has increased by around 1.1°C since 1850–1900
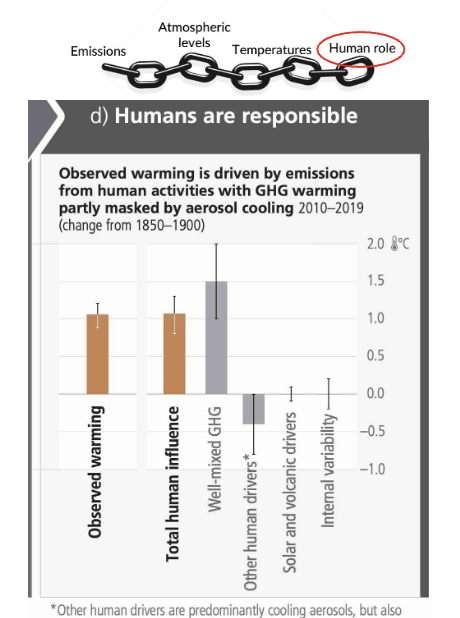
Climate change Human role
Human activities, principally through emissions of greenhouse gases, have unequivocally caused WHAT
Climate change Human role
Human activities, principally through emissions of greenhouse gases, have unequivocally caused GLOBAL WARMING