Test 4 - Module 15 - Quantitative Genetics
1/43
There's no tags or description
Looks like no tags are added yet.
Name | Mastery | Learn | Test | Matching | Spaced | Call with Kai |
|---|
No analytics yet
Send a link to your students to track their progress
44 Terms
What are polygenic traits?
traits that are determined by more than one gene
Many polygenic traits are...?
complex traits
What are complex traits?
Traits that are influenced by several genes as well as environmental factors.
3 categories of complex traits?
▪ Continuous traits: do not fall into discrete categories.
▪ Meristic traits: can be counted and expressed in whole numbers.
▪ Threshold traits: traits that show genetic predisposition, but ultimately determined by the contribution of several genes and environment, e.g., diabetes, heart disease.
What are quantitative traits?
traits that can be described numerically, e.g., height, weight, metabolic rate.
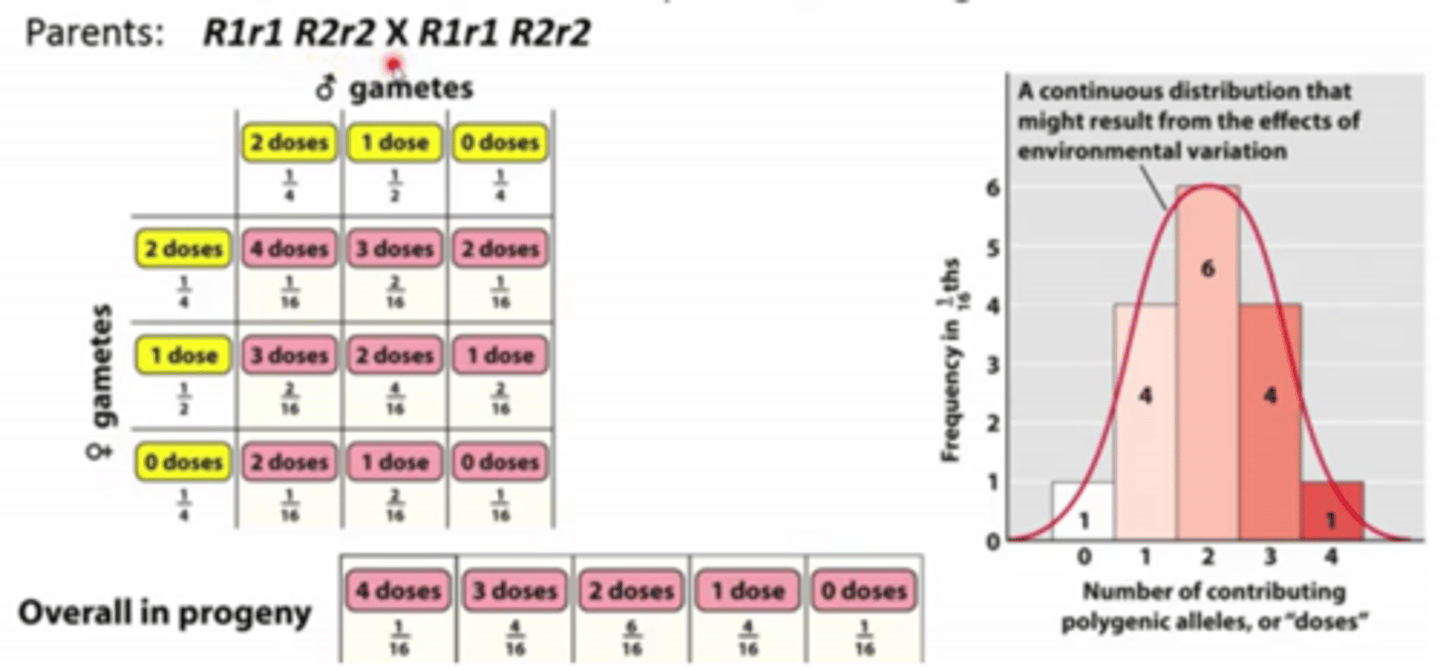
What is polygenic inheritance?
Inheritance of traits determined by more than one gene.
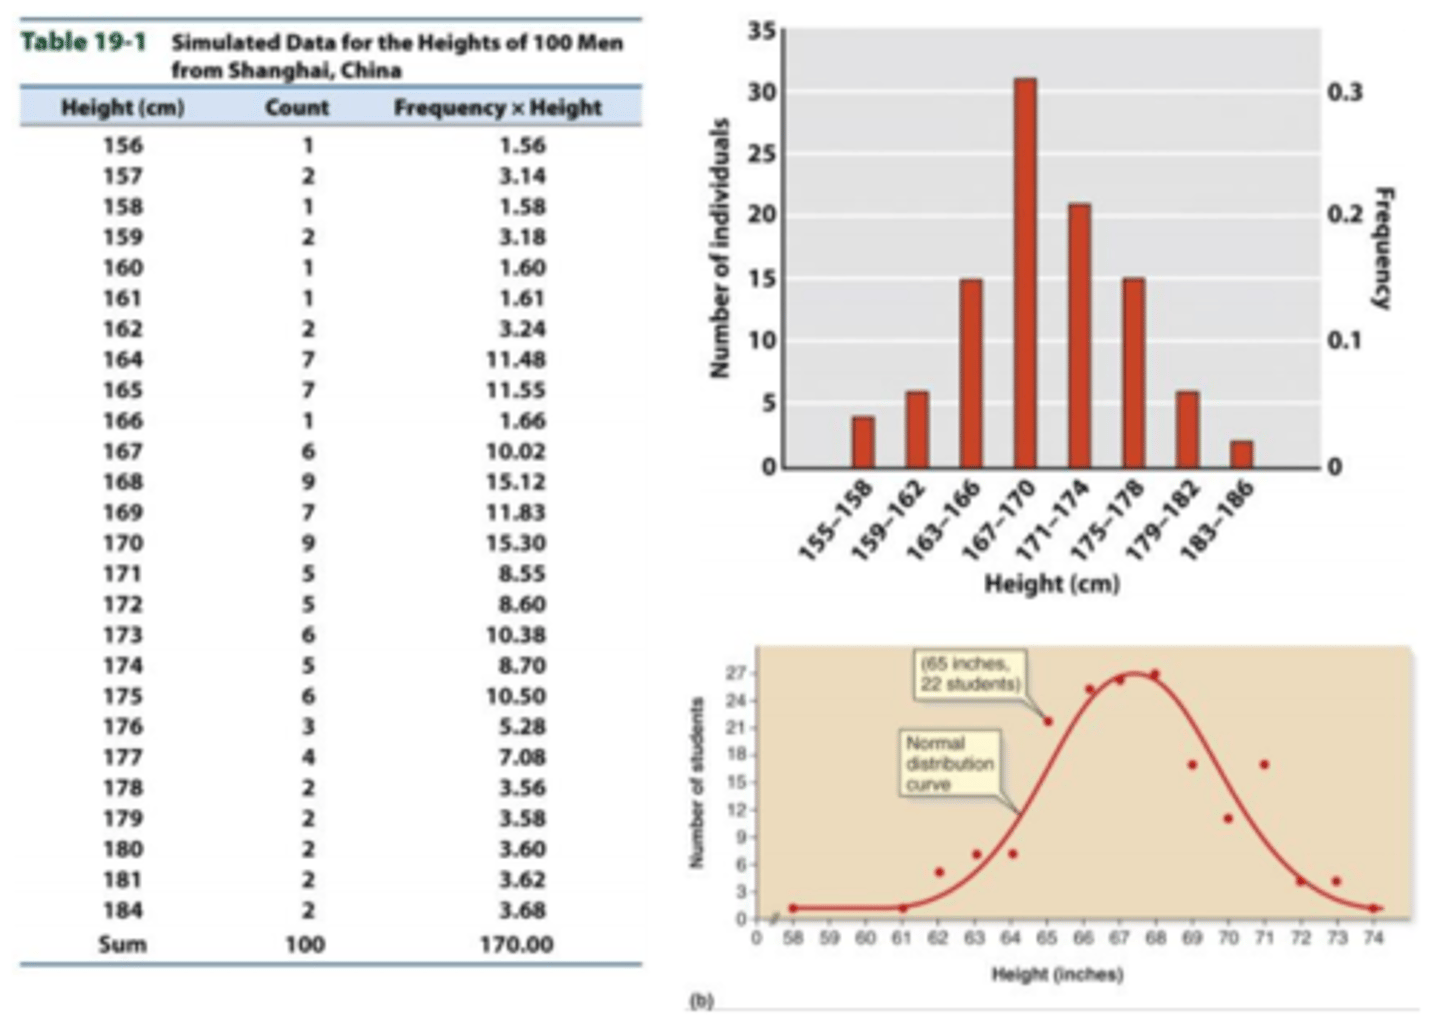
Frequency Distribution
1) What kind of traits can be described with a frequency distribution?
2) How is it done?
3) What do normal distributions look like?
1) Quantitative, continuous traits can be described with a frequency distribution
2) Quantitative, continuous traits can be described with a frequency distribution
3) Normal distributions show a bell shaped curve with symmetrical variation about an average value.
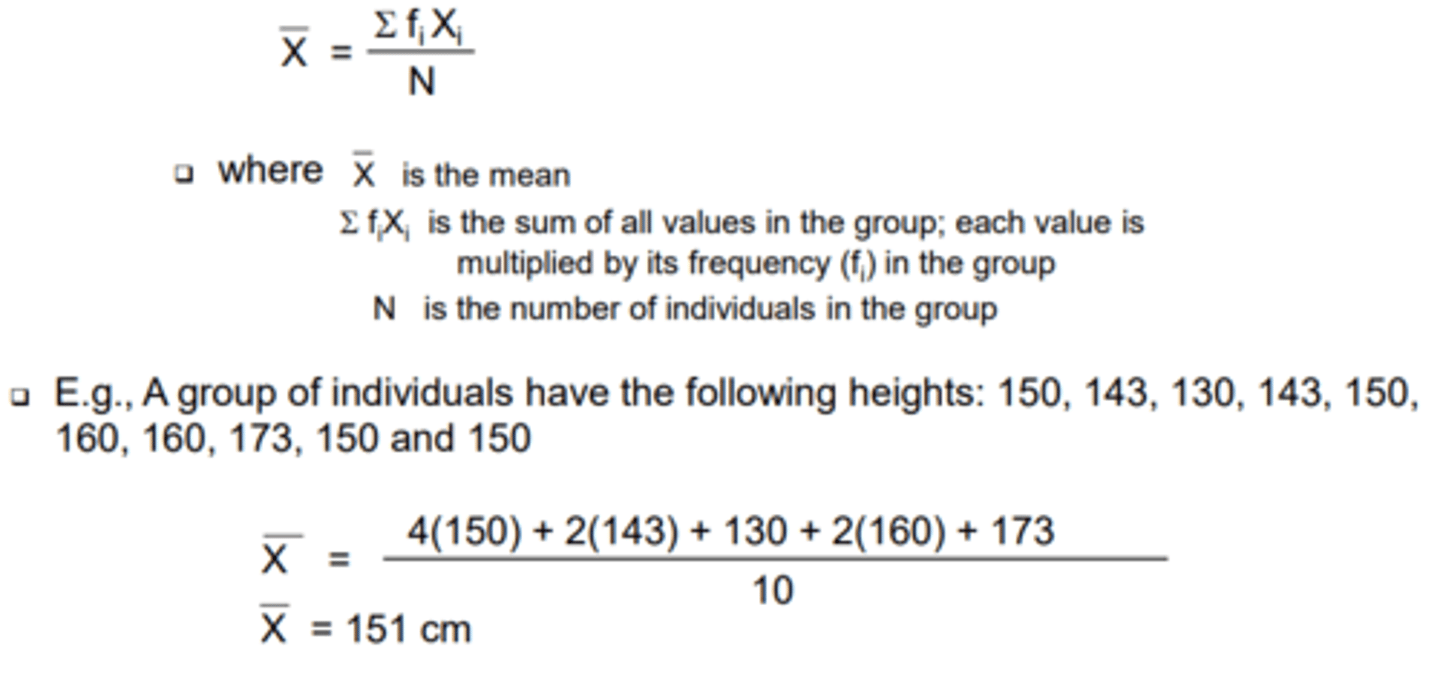
Statistical methods for evaluating quantitative traits - Mean
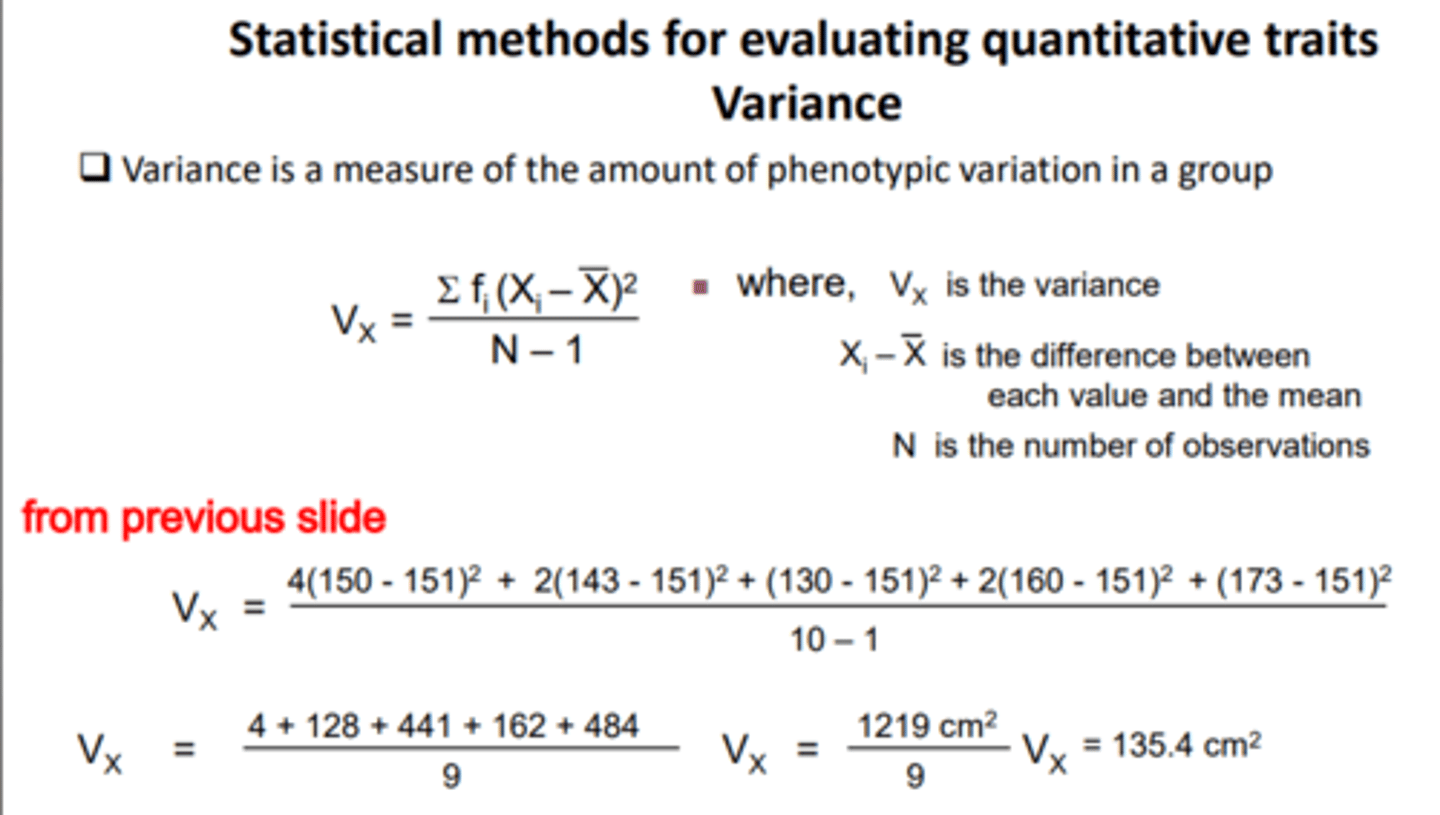
Statistical methods for evaluating quantitative traits - Variance
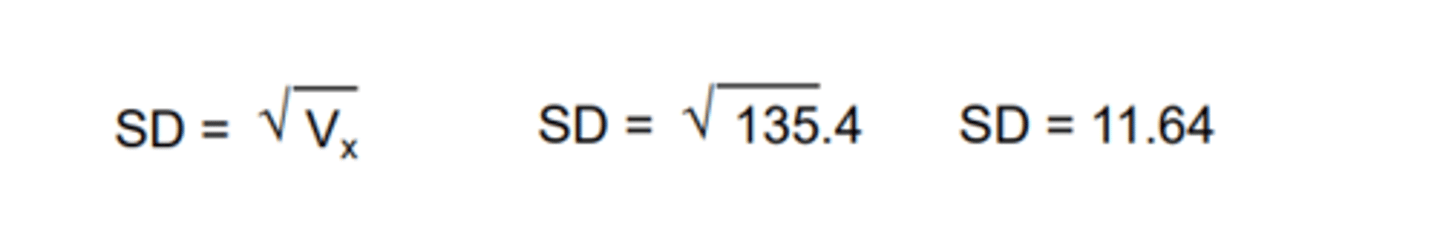
Statistical methods for evaluating quantitative traits - Standard deviation
1) It is easier to appreciate the amount of variation using...?
1) standard deviation
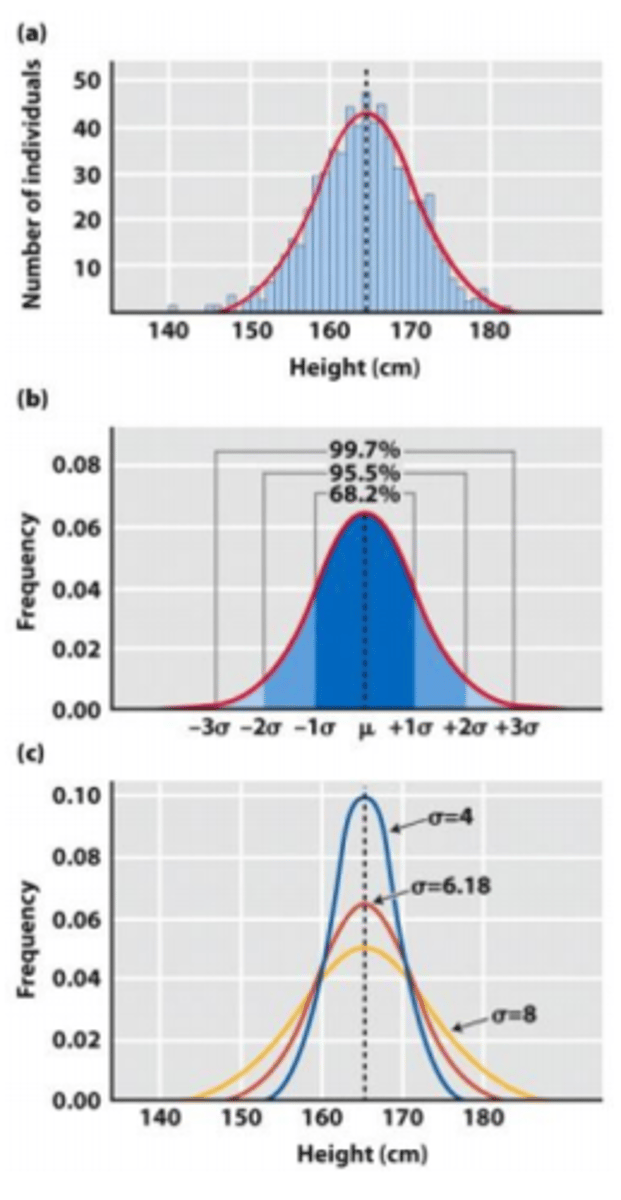
The Normal Distribution
1) What is normal distribution?
(a) Shape is determined by...?
2) A normal distribution allows us to predict the number of observations that will...?
(a) ____ of observations will fall within 1 s.d. from the mean
(b) _____ of observations will fall within 2 s.d. from the mean
1) bell shaped curve with a peak at the mean value and symmetrical distribution about the mean.
(a) the mean and standard deviation
2) fall within a certain distance from the mean.
(a) 68%
(b) 95.5%
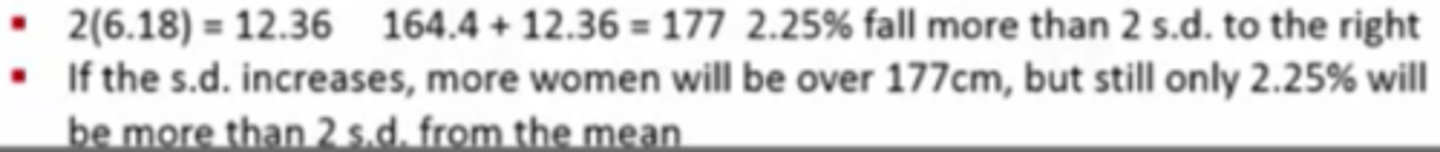
Normal Distribution Example
If the mean height of women is 164.4 cm and the s.d. is 6.18 cm, then how tall does a woman need to be to be in the top 2.25% for height?
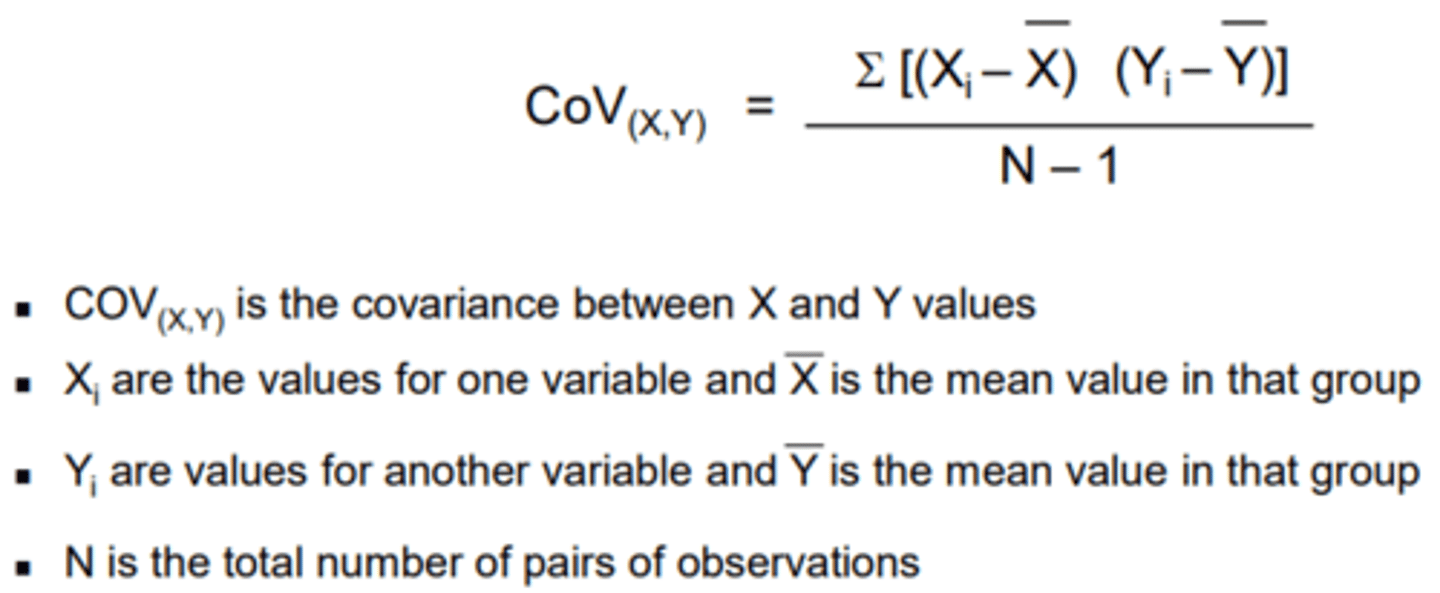
Comparing the relationship between 2 variables: Co-variance
1) What does it do?
2) What kind of variables can it relate?
1) Describes the relationship between two variables within a group
2) ▪ The occurrence of 2 phenotypic traits
▪ Traits and environmental factors
▪ Traits and genetic relationships
Comparing the relationship between 2 variables: Co-variance
Formula and variables?
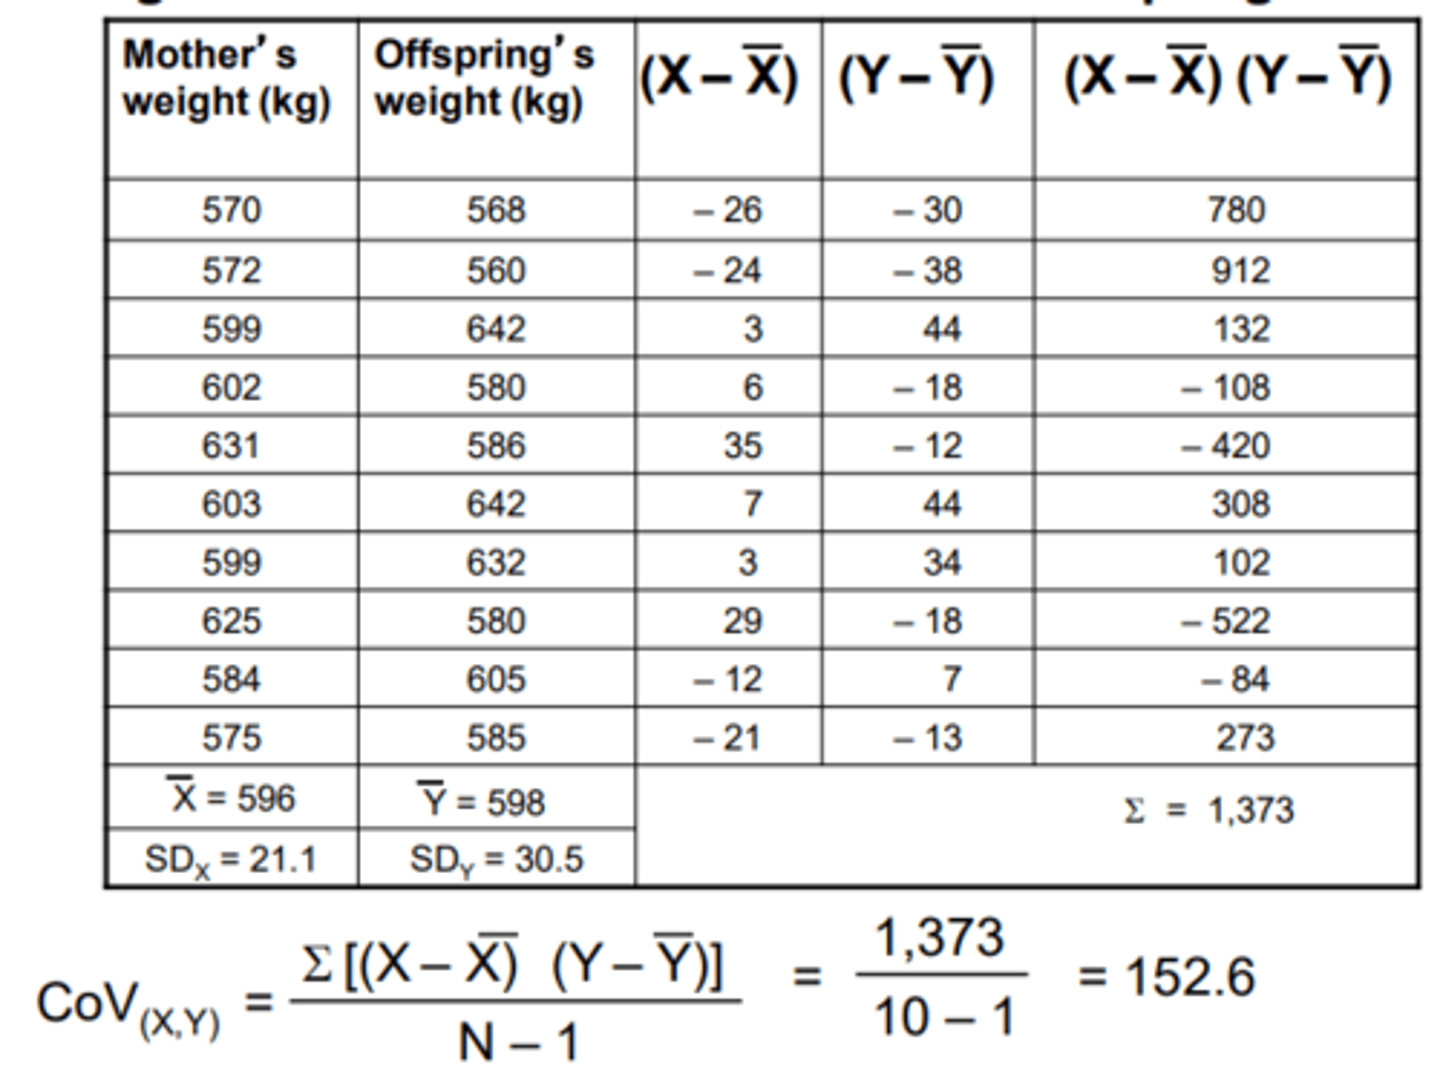
Calculating co-variance between mother and offspring for weight
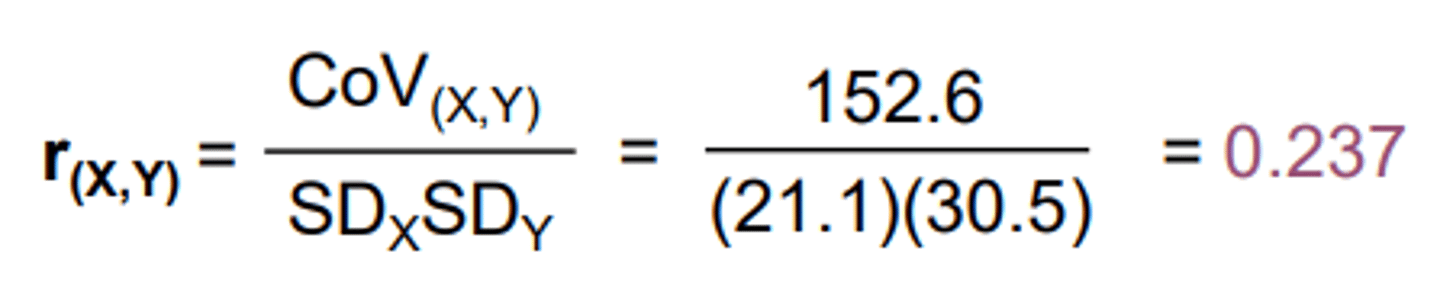
The correlation co-efficient
1) What does it do?
2) How does it work?
3) We must then evaluate whether...?
1) The correlation coefficient (r) measures the strength of association between two variables
2) This value ranges between +1 and -1 and indicates how two factors can vary in relation to each other
▪ If r > 0 As one factor increases, the other factor will increase with it
▪ If r = 0 The two factors are not related
▪ If r < 0 As one factor increases, the other factor will decrease
3) the r value represents a true association between the variables or whether it is simply due to chance

Correlation coefficient formula?
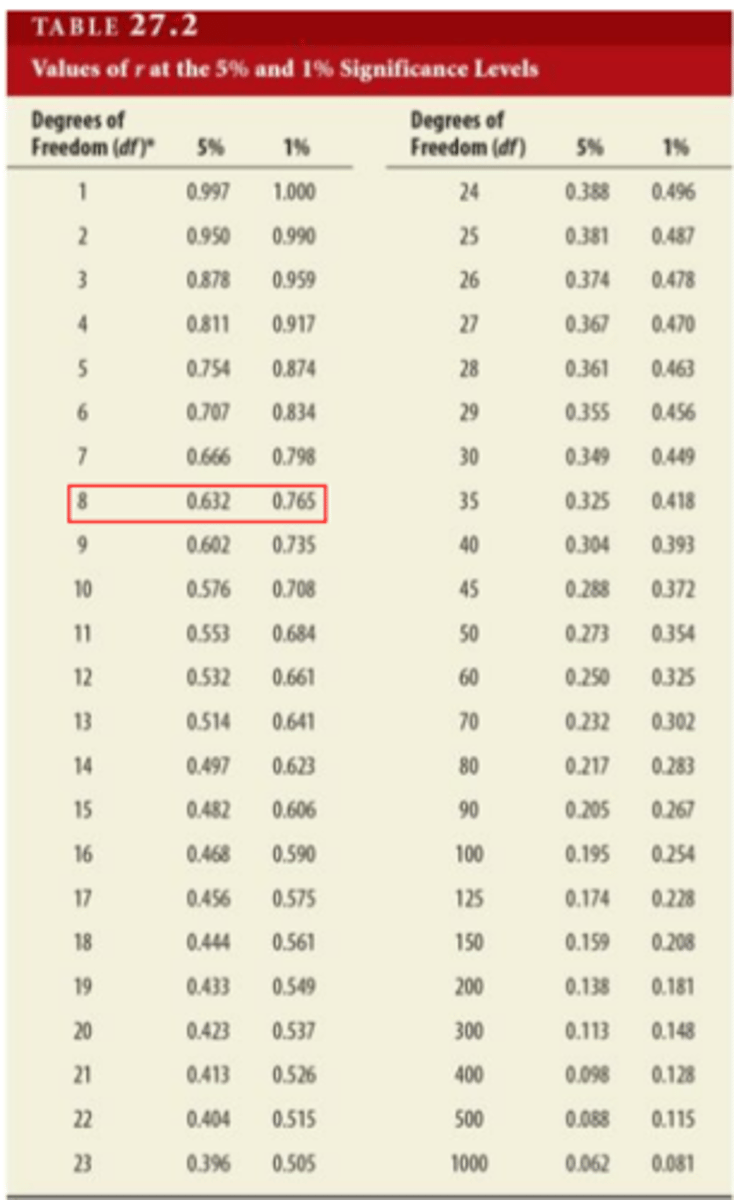
The correlation co-efficient
1) If the correlation coefficient is significant it indicates that...?
2) Find the row for the correct degrees of freedom and determine whether...?
3) Degrees of freedom = ?
4) Significant association does not imply...?
1) there is a strong association between 2 variables.
2) the r value is significant at the 5% or 1% significance level.
3) N - 2
4) cause and effect
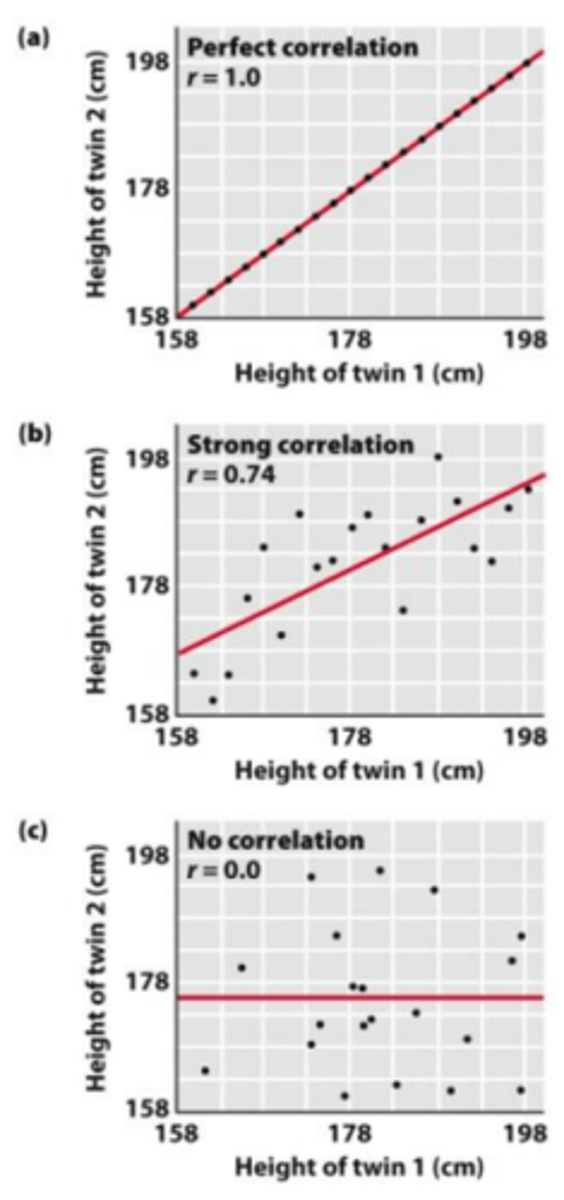
Correlation Between Variables
1) What can scatter plots be used for?
2) What is the correlation coefficient?
(a) r = 1 means?
(b) r = 0 means?
1) can be used to visualize the degree of correlation.
2) measure of association between 2 variables
(a) r = 1 for perfect correlation
(b) r = 0 for no correlation
Broad sense heritability
1) Variance has what two components?
2) What is it?
3) hB2 provides a measure of...?
4) Estimates of hB^2 apply only to...?
(a) Why?
1) Variance has a genetic and an environmental component
2) Broad sense heritability (hB2) is the ratio of the genetic variance (Vg) to the overall phenotypic (Vx) variance.
3) the extent to which differences among individuals within a population are due to genetic factors.
4) the population and environment in which they were made.
(a) The environment affects different populations differently
Broad-sense heritability
1) What does broad sense heritability measure?
2) What is the formula and what do the variables mean?
1) phenotypic differences due to genetic factors
2)
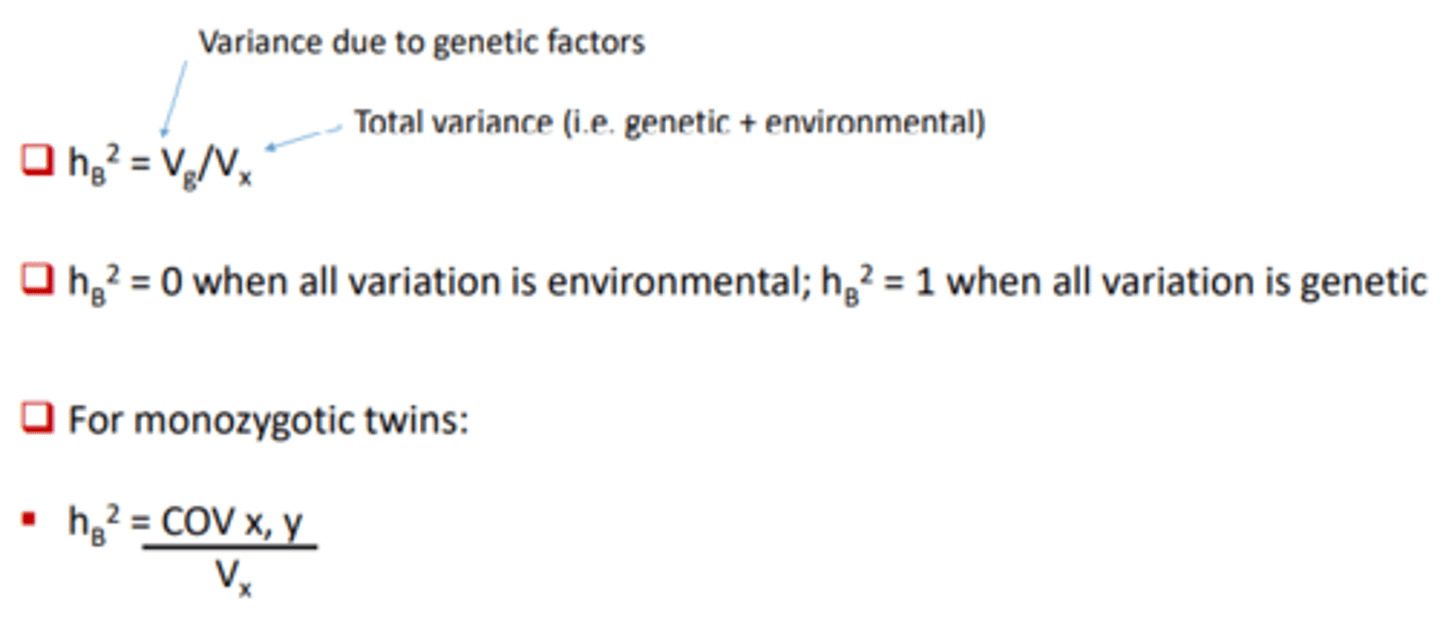
Measuring heritability in humans using monozygotic twins
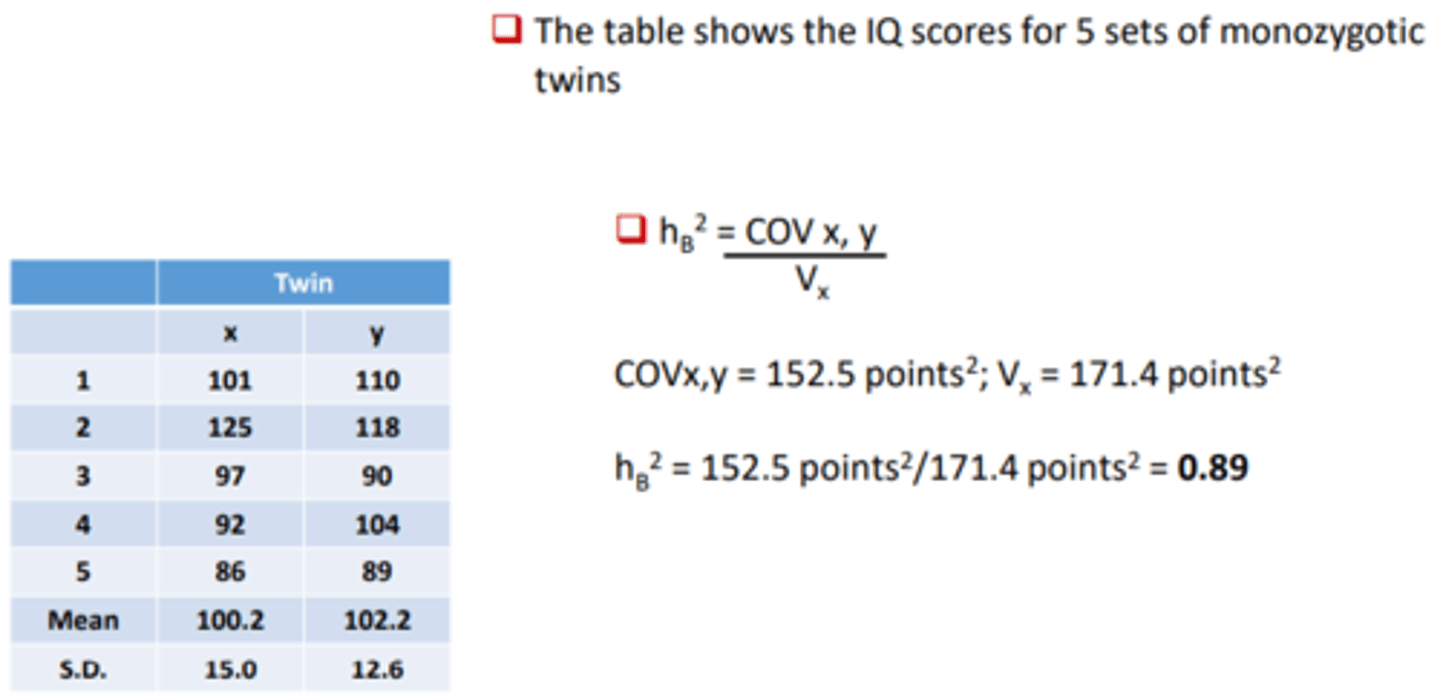
Measuring heritability in humans using monozygotic twins pt 2
Narrow-sense heritability
1) The genetic component of variance can be...?
(a) VA = ?
(b) VD = ?
(c) VI = ?
2) What is it the ratio of?
3) What does it measure?
4) Estimates of hN2 apply only to...?
1) sub-divided
(a) variance due to additive effects of alleles
(b) variance due to effects of alleles that show a dominant/recessive pattern of inheritance
(c) variance due to effects of alleles that interact in an epistatic manner
2) Narrow sense heritability (hN2) is the ratio of additive genetic variance (VA) to the overall phenotypic (Vx) variance.
3) Measures the extent to which variation between individuals can be predictably transmitted to offspring.
4) Estimates of hN2 apply only to the population and environment in which they were made.
What does narrow sense heritability determine?
phenotypic differences due to additive genetic variance
narrow sense heritability formula and variable?
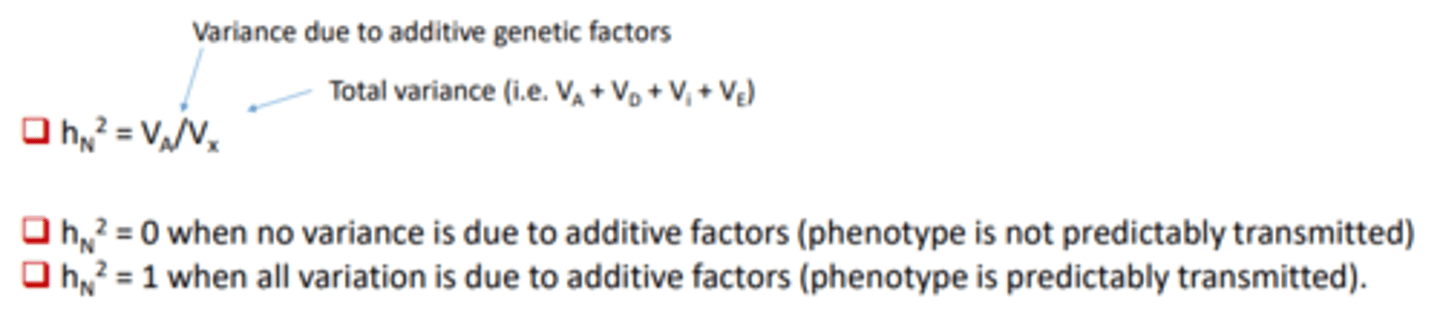
What does it mean when hN^2 = 0?
hN2 = 0 when no variance is due to additive factors (phenotype is not predictably transmitted)
What does it mean when hN^2 = 1?
hN2 = 1 when all variation is due to additive factors (phenotype is predictably transmitted).
Calculating narrow sense heritability
1) Narrow sense heritability can be determined by...?
2) Formula?
(a) What are the variables?
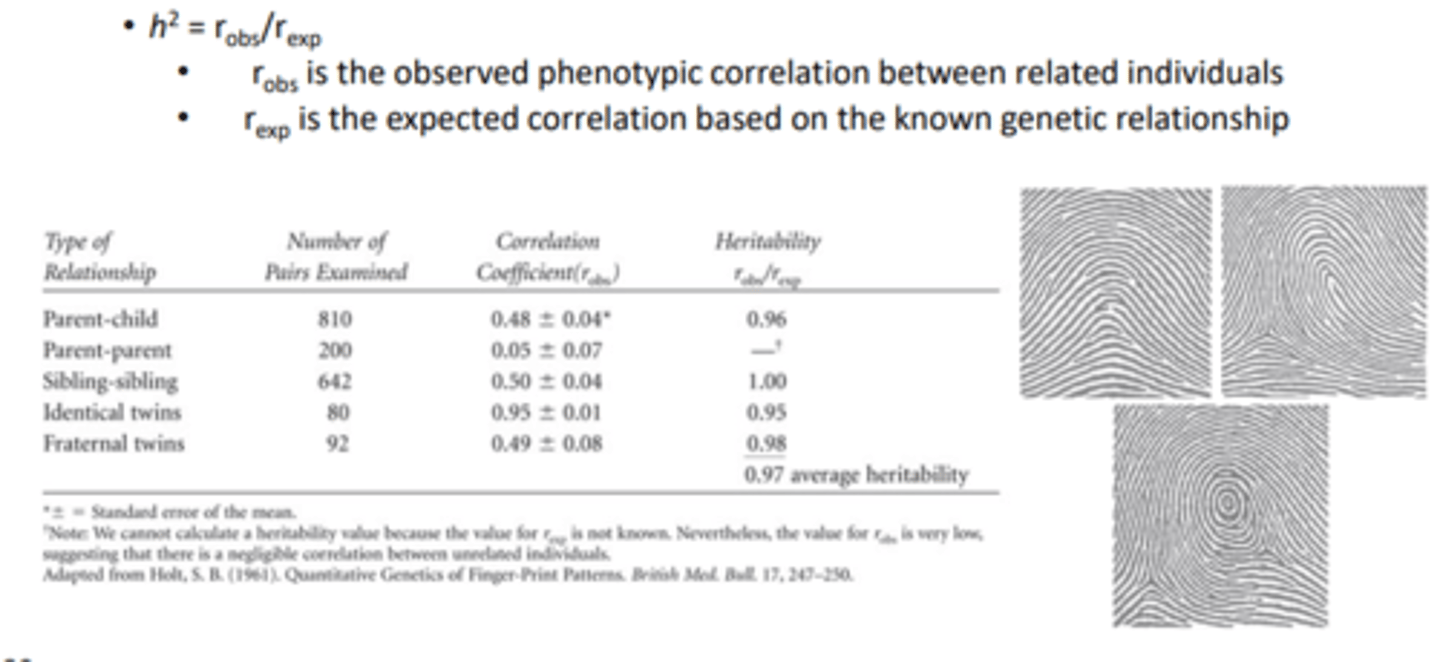
1) comparing the expected phenotypic correlation coefficient with the observed correlation coefficient.
2) h^2 = robs/rexp
(a) • robs is the observed phenotypic correlation between related individuals
• rexp is the expected correlation based on the known genetic relationship
Narrow-sense heritability can be estimated from selective breeding
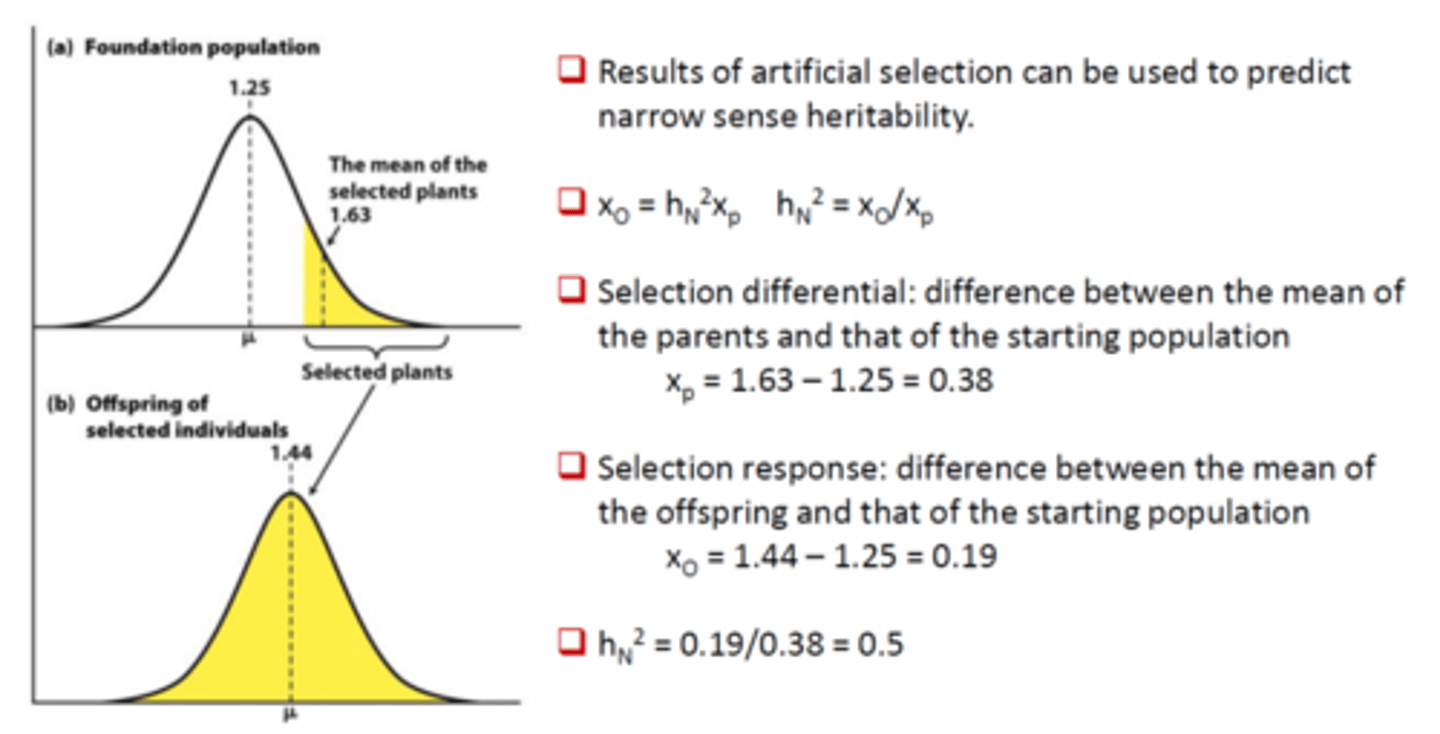
What is a selection differential?
The difference between the mean of the parents and that of the starting populations
What is a selection response?
The difference between the mean of the offspring and that of the starting population
What are the following traits: complex trait, quantitative trait, polygenic trait, continuous trait, meristic trait, threshold trait?
Complex trait: determined by multiple genes and significantly influenced by environmental factors.
Quantitative trait: can be described quantitatively, i.e., numerically.
Polygenic trait: determined by multiple genes (complex traits are polygenic)
Continuous trait: shows a continuous phenotypic distribution in the population i.e., phenotypes do not fall into discrete categories
Meristic traits: can be counted and described in whole numbers (i.e., multiple whole number discrete categories)
Threshold traits: phenotypes take discrete values, but multiple genes contribute to the likelihood of developing the condition.
Complex continuous traits usually show normal distribution. What is normal distribution?
In a population, most individuals have the mean phenotype and there is symmetrical phenotypic variation at either side of the mean. When plotted on a graph (number of individuals vs. phenotype) the curve shows a bell-shaped curve with symmetrical variation about the mean
Complex traits show phenotypic variance in a population. What is variance? What is the relationship between variance and standard deviation?
Variance is a measure of how much phenotypic variation is present in a population. Standard deviation is the square root of variance.
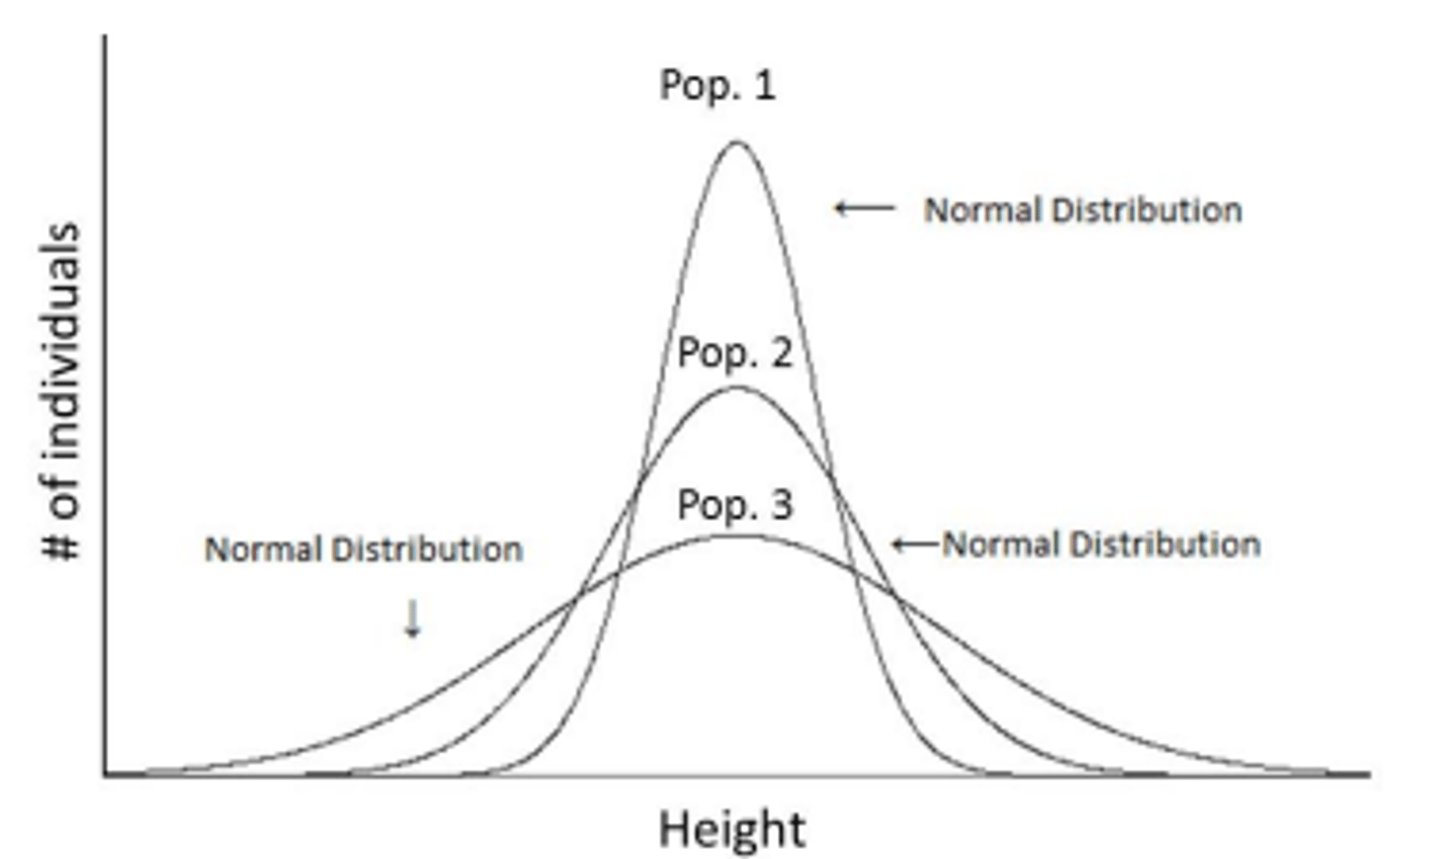
Height was measured in 3 populations. Which population has the greatest variance?
Population 3 has the greatest variance as it has the broadest spread about the mean
If a trait shows normal distribution, we can predict the proportion of individuals that will fall within 1 and 2 standard deviations from the mean.
The average US male is 69.1 inches tall and the standard deviation is 2.9 inches. How tall would a male be to be in the top 15.85% of the population? How short would a male be to be in the shortest 2.3% of the male population?
For normal distribution, 31.7% of observations are outside 1 SD from the mean; of those 15.85% are less than 1 SD and 15.85% are more than 1 SD. Therefore, a height of 69.1 + 2.9 = 72 in would put a male in the top 15.85% for height.
For a normal distribution, 4.6% of individuals are outside 2 SD from the mean; of those 2.3% are less than 2 SD from the mean and 2.3% are more than 2 SD from the mean. Therefore, a height of 69.1 - (2.9 x 2) = 63.3 in would put a male in the bottom 2.3% for height
We determine the covariance of IQ score for 10 mother/daughter pairs.
Mother Daughter
135 121
127 131
124 112
120 115
115 99
112 118
104 106
96 89
94 92
85 90
a. What would it indicate if the correlation coefficient (r) is:
- Greater than 0:
- Equal to 0:
- Less than 0:
b. The actual correlation coefficient value for this data set is 0.86. Is this value significant at
the 5% and 1% significance levels (use 8 degrees of freedom)? The table is in the folder.
c. Does the correlation coefficient value indicate that IQ score is largely determined by
genetics?
a. What would it indicate if the correlation coefficient (r) is:
- Greater than 0: daughter IQ score increases with mother IQ score
- Equal to 0: there is no relationship between daughter and mother IQ score
- Less than 0: daughter IQ score decreases as mother IQ score increases
b. The value is significant at both the 5% and 1% significance levels. This means that there is less than a 1% chance that we would have obtained this value simply due to chance.
c. No. The correlation coefficient tells us that daughter IQ score increases with mother IQ score, but it does not tell us the reason for the positive correlation. It could be due to genetic factors, environmental factors (e.g., education), or a combination of genetic and environmental factors.
What is broad sense heritability? (represented by either H^2 or hB^2 )
Broad-sense heritability is an estimate of how much phenotypic variation about the mean is due to genetic factors (it is the ratio of variance due to genetic factors over total variance).
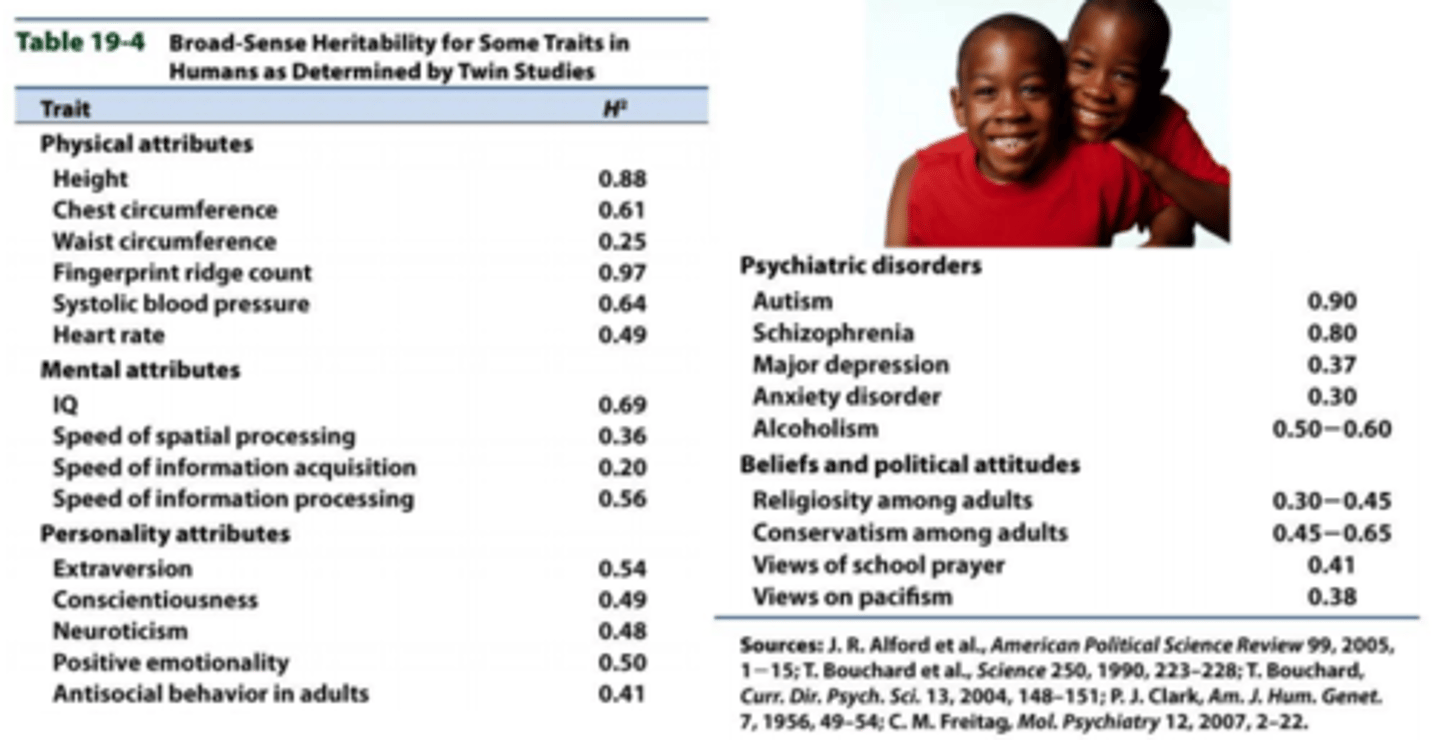
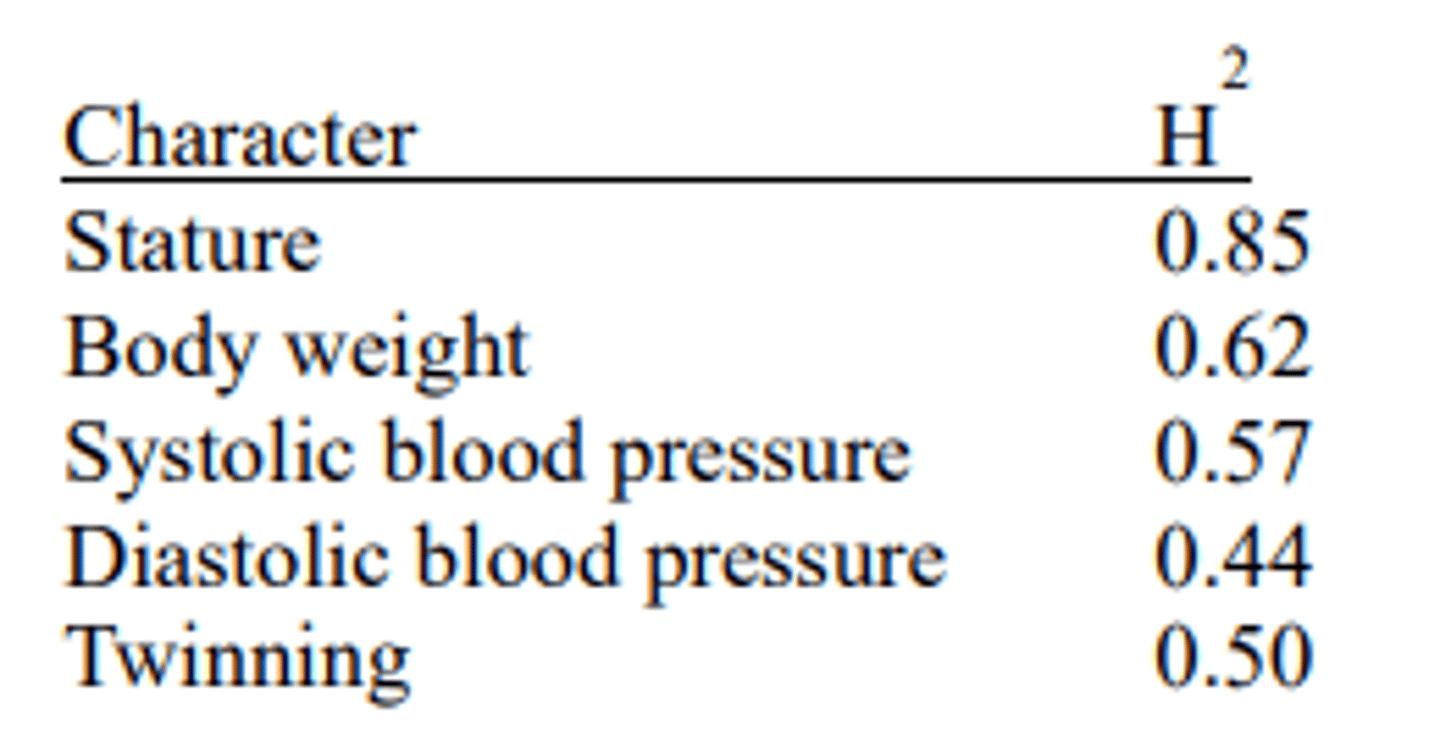
For which of the following traits does genetics have the greatest effect on variance in a population? Does this tell us that the trait can be predictable inherited?
Stature, because it has the highest broad-sense heritability value. Compared to the other traits, genetic factors have a greater influence on phenotypic variance about the mean. Although stature has a high broad-sense heritability, it does not tell us that the phenotypic variance can be predictably inherited; narrow-sense heritability tells us whether the phenotypic variance can be predictably inherited.
On the other hand, diastolic blood pressure has the lowest broad-sense heritability. Compared to the other traits, genetic factors have less of an influence on phenotypic variance about the mean.
Ten pairs of monozygotic twins separated at birth and raised apart were tested for their waist circumference. The variance in waist circumference within the twenty subjects (measured in in2 ) was 40. The covariance for waist circumference between twins was 20 in2 . In this study, what is the broad-sense heritability of waist circumference? Does this value indicate that variance in waist circumference is controlled more by genetic or environmental factors? How might the broad sense heritability value be different if the twins were raised in the same household?
Broad sense heritability (H 2 )= COV(x,y)/Vx = 20in2 /40in2 = 0.5
The value of 0.5 tells us that variance in waist circumference is equally due to genetic factors and environmental factors.
If the twins were raised in the same household, we would expect the broad-sense heritability value to be greater because the twins would share the same environment (e.g., similar diet and exercise regime), so environment would have less of an effect on phenotypic difference.
What is narrow-sense heritability? (represented by either h^2 or hN^2)
Narrow-sense heritability is an estimate of how much phenotypic variance in a population can be predictably inherited (it is the ratio of variance due to additive genetic factors over total phenotypic variance).
Narrow-sense heritability for heart rate in a particular study was calculated to be 0.17. Does this indicate that variance in heart rate can be predictably inherited?
A value of 0.17 tells us that only 17% of variance can be predictable inherited, so most of the phenotypic variance in heart rate is not predictably inherited.
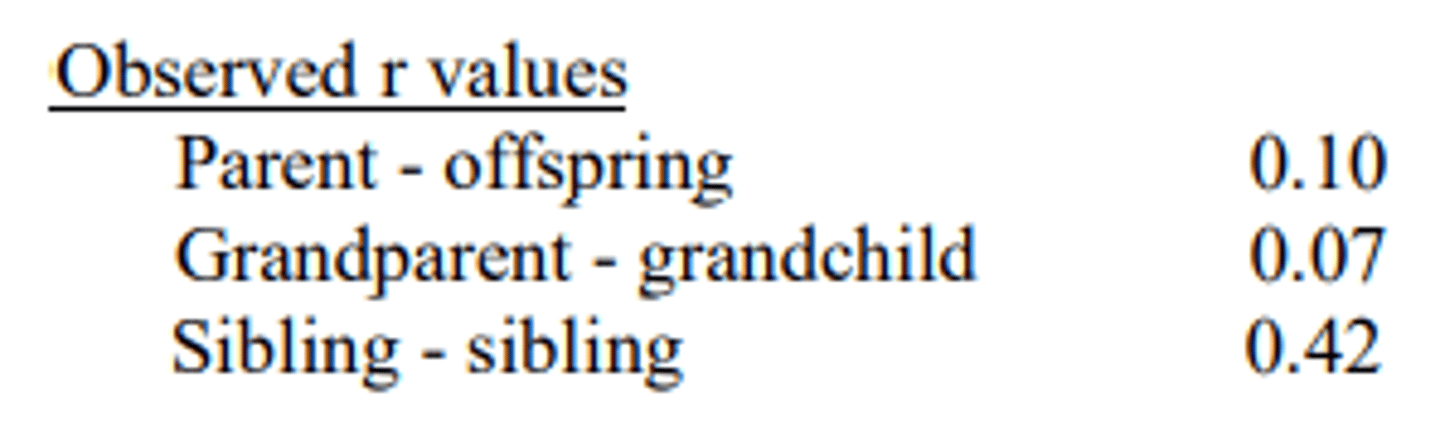
The correlation coefficients for age of onset of Huntington disease were determined for 15 pairs of individuals with the following relationships. What is the narrow sense heritability for age of onset of Huntington disease in this study? Why is this value probably an overestimate? (h2 = robs/rexp)
Parent-offspring 0.1/0.5 = 0.2
Grandparent-grandchild 0.07/0.25 = 0.28
Sibling-sibling 0.42/0.5 = 0.84
Average robs/rexp = (0.2+0.28+0.84)/3 = 0.44
The h2 value of 0.44 is probably an overestimate because the sibling-sibling value is much higher than for other relationships. Of all the pairs, siblings are most likely to have been raised in a similar environment, so the sibling-sibling value probably overestimated genetic influence and underestimated environmental influence