Chapter 9: Short Term Profit Planning
1/33
There's no tags or description
Looks like no tags are added yet.
Name | Mastery | Learn | Test | Matching | Spaced | Call with Kai |
|---|
No analytics yet
Send a link to your students to track their progress
34 Terms
Cost-volume-profit analysis (CVP)
a method for analyzing how various operating and marketing decisions affect short term profit based on an understanding of the relationship between variable costs, fixed costs, unit selling price, and the output level
-there are tool within CVP that can aid decision making
applications for CVP analysis
-setting prices for products and services
-determining whether to introduce a new p/s
-determining the short term cost or profit implications of many decisions
-determining the desirability of replacing a piece of equipment or other fixed asset
-determining the BE point
-deciding whether to make or buy a given p/s
-determining the best product mix
-performing strategic 'what-if' analyses
five factors that determine the amt of short-term operating profit
-variable cost per unit, total fixed costs, sales volume, selling price per unit, and sales mix
-the CVP analysis is based on an explicit model of the relationships among these five factors
CVP Model
Operating Profit = Sales - Total Costs
operating profit
the profit exclusive of unusual or nonrecurring items and is before tax
-When ther are no unusual or nonrecurring items, operating profit is simply before-tax income
--> Operating profit = sales - VC - FC = (units sold x selling price per unit) - (units sold x VC per unit) - FC
Contribution margin per unit
difference between selling price and variable cost per unit
-measures the change in operating profit for each unit change in sales
-revenue minus VC
-The Contribution Margin per unit tells you exactly how much profit is generated by selling one more item.sales
Total contribution margin
the contribution margin per unit multiplied by the number of units sold; also sales x CM ratio
Contribution margin ratio
a measure of the profit contribution per sales dollar
-the ratio of the contribution margin per unit to the selling price per unit (p-v)/p
-
The Contribution Margin Ratio (CMR) tells you how much profit is generated by every individual dollar of revenue. A ratio of 0.47 means that 47% of every dollar remains after accounting for the costs of producing that battery
Contribution Income Statement
-focuses on cost behavior because it seperates fixed costs and variable costs
-Sales - VC = Contribution margin - FC = operating profit
-the conventional income statement focuses on costs type (product and nonproduct costs) where sales - product costs = gross margin - operating expense = operating profit
Strategic questions that can be addressed by CVP analysis
1. What is the expected profit from a given change is sales volume for existing products, and is that change in sales volume sufficient to support strategic objectives?
2. Is the decision to add a new customer or product profitable, and is it consistent with the organization's competitive strategy?
3. Given the organization's strategy and future expectations for sales volume, is it best for the company to manufacture a certain part in-house or to purchase the part from another vendor?
4. Given the organization's strategy and future expectations for sales volume, should the organization invest in future expansion?
Breakeven point
the point at which total revenue equals total costs so that operating profit is zero
-starting point for many businesses
-find by setting operating profit equal to zero
Breakeven in units/dollars
operating profit (0) = (sales price x q) - (V price x q) - FC
operating profit (0) = [(selling price per unit - variable cost per unit) x (total sales revenue (in dollars) at the break-even point./selling price per unit)] - FC
Quantity of units produced and sold formula
= fixed costs/contribution margin per unit
Total sales revenue (in dollars) at the break-even point formula
= FC/ [(p-v)/p]
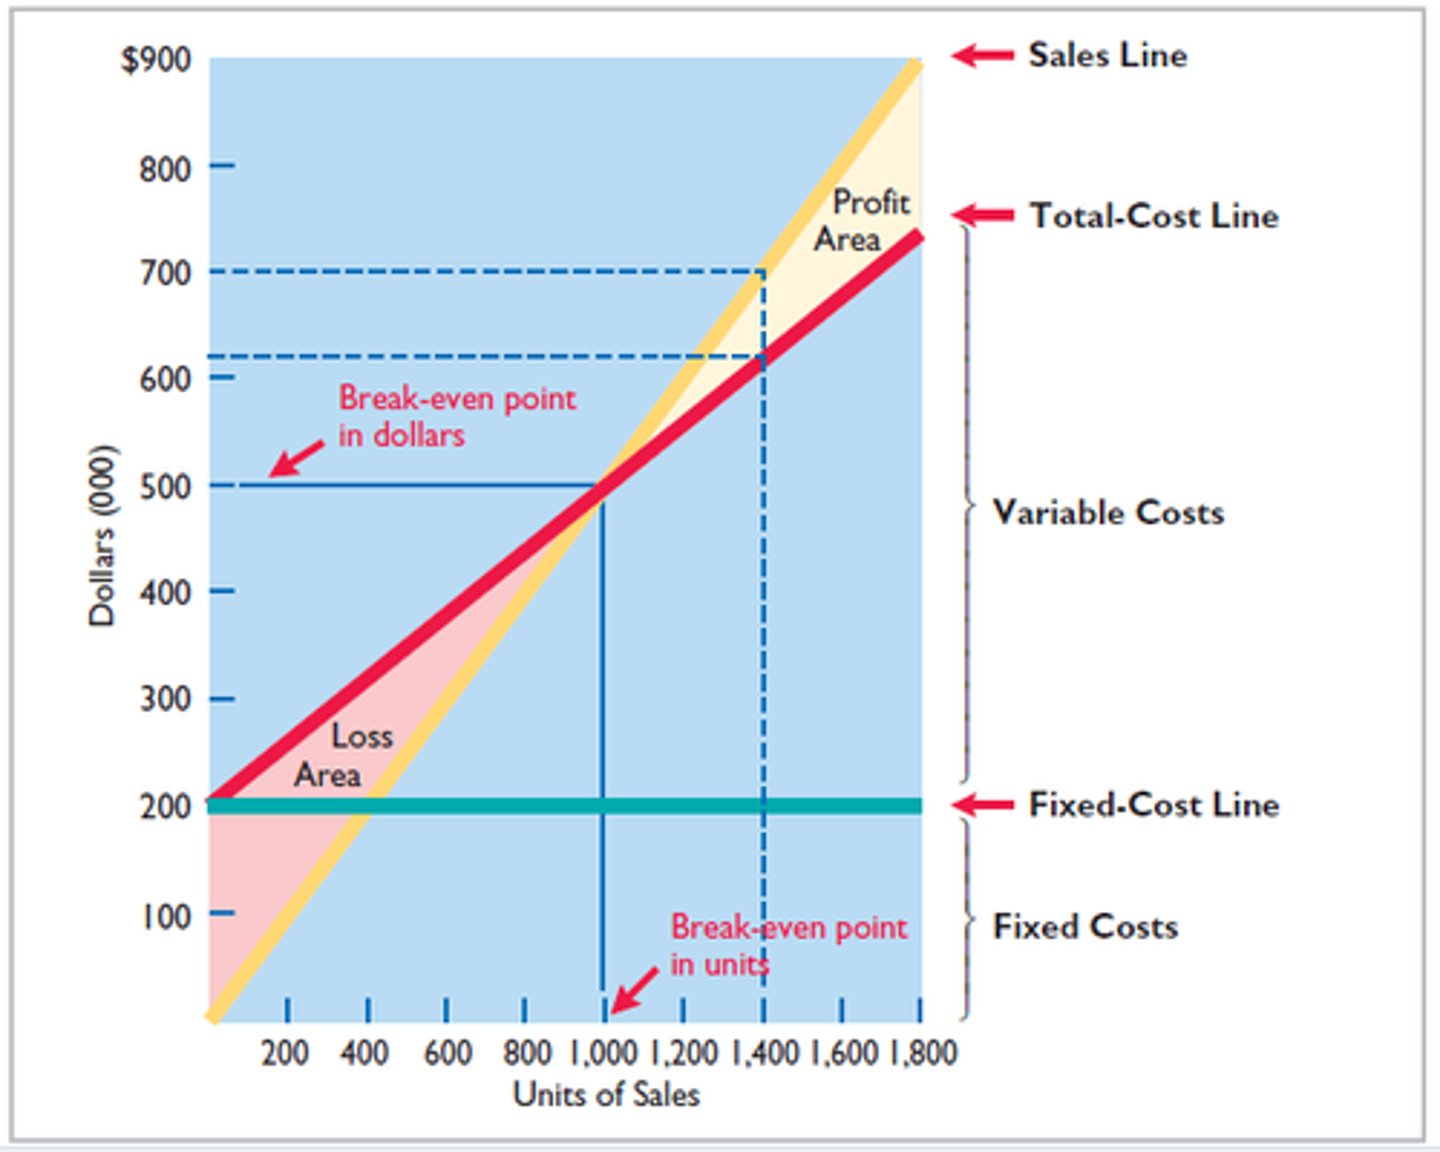
CVP Graph
A diagram illustrating how the levels of revenues and total costs change over different levels of sales volume as expressed in units
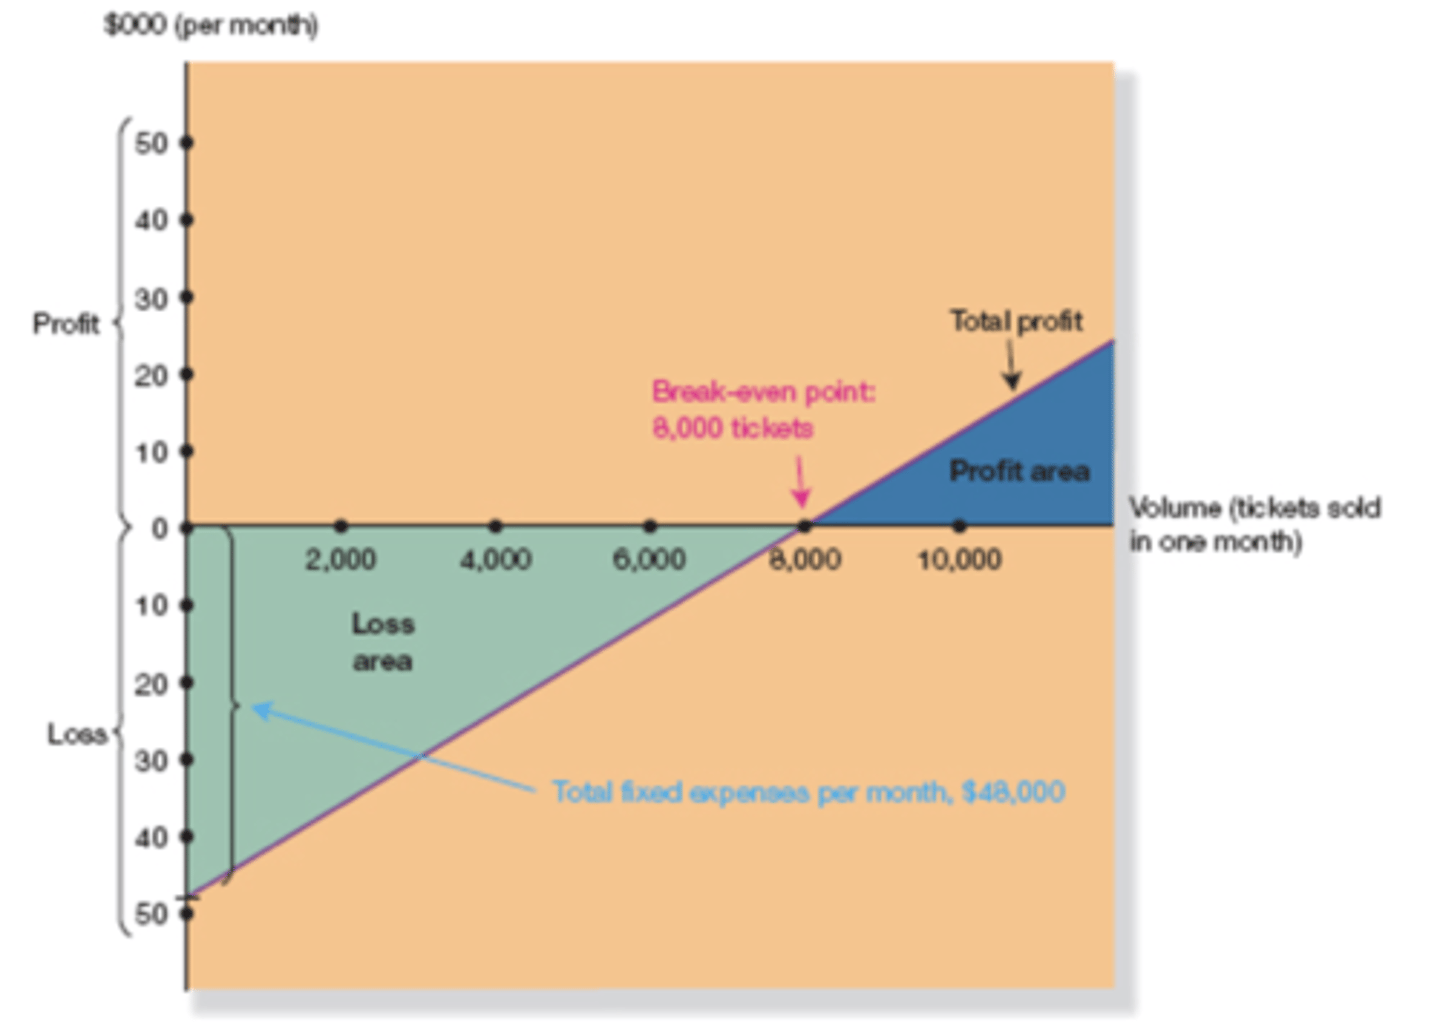
Profit-volume graph
illustrates how the level of operating profit changes over different levels of sales volume, expressed in units
CVP Analysis for profit planning
can be used to determine the level of sales needed to achieve a desired level of profit, determined on either a pretax or after-tax basis
-revenue planning, cost planning, and accounting for the effect of income taxes
Revenue planning
-determining the revenue required to achieve a desired profit level
Q = (F + pretax operating profit)/(p-v)
Y = p x Q
Cost planning
the manager assumes that the sales volume and the desired profit are known but what the find the required variable cost per unit or the total fixed costs
--> Trade offs between FC and VC: One machine: v = p - [(F + operating profit)/Q]
--> Trade offs between FC and VC: Two Machines: cost of machine A = Cost of machine B and solve for Q
--> Sales commissions and Salaries:
v = commission rate x sales price per unit) + Other noncommission-based variable costs per unit
F = Current monthly fixed costs + increase in monthly salary
v = p - [(F + operating profit)/Q]
Including Income taxes in CVP Analysis
Q = [F + (pretax operating profit/ 1 - t)] / (p-v)
CVP Analytics for ABC
-ABC identifies cost frivers for indirect activities, such as machine setup, materials handling, inspection, and engineering
-activities can be classified into four levels: unit, batch, product, and facility
-unit levels are volume-based so they are treated the same under ABC and Volume costing
-traditional VBC CVP classifies the other three levels as cost that do not vary with volume (fixed costs). However batch and product level vary with number of batches or number of products so ABC takes these into account.
-Facilities level costs are not avoidable in a short term planning horizon so they are treated as fixed costs under both methods
-if product level costs do not change in more than a year thnan they are considered fixed
Q = (the portion of short term fixed costs that do not vary with the activity cost driver + operating profit) / p - v - (the cost per unit of product for batch related costs for batch size b / b)
Dealing with uncertainty
-the basic CVP model is said to be deterministic in nature but we know that the inputs to the CVP planning model are at best estimates of future values
-uncertainty means that a number of different values can exist for one or more of the variables in a decision model
Sensitivity analysis
a variety of methods that examine how an amount changes if factors involved in predicting that amount change
-Two approaches: Basic 'what-if" analysis and construction of decision tables/trees
-used to determine the sensitivity of profits to possible changes in costs, selling price, or sales volume (if these change significantly the firms strategy might also have to change
Two metrics commonly associated with CVP
Margin of safety (MOS, including the MOS ratio; the degree of operating leverage
What-if analysis
the calculation of an amount given different levels of a factor that influences that amount
-results are put in a data table prepared in Excel
Decision tables/decision trees/ expected value analysis
include a set of managerial actions or decisions, a set of events, and a set of outcomes
-probabilities can be incorporated into the analysis by estimating a probability for each possible event
-probability is the likelihood that a given event would occur
-a probability distribution is the set of all possible events that could occur that must equal 100%
-that info is summarized into a decision table and from the decision table we calculate the expected value of each action
-expected value is the weighted average of all possible outcomes associated with each decision alternative. The weights in this calculation are equal to the outcome probabilities
Margin of Safety (MOS)
the amount of planned or actual sales above the breakeven point measured in units or dollars (amount your sales can decrease before you start incurring losses
-the MOS ratio is useful for comparing the risk of two or more alternative products. The one with the lowest MOS ratio is more risky
-planned or actual sales minus breakeven sales in units or dollars (if you go beyond this you will incur losses)
-MOS ratio= MOS/ planned revenue or planned sales
Operating Leverage
the extent to which the cost structure of an organization has fixed verses variable costs
-the higher the relative amount of fixed costs, the higher the operating leverage, and therefore the greater the sensitivity of operating income to changes in sales volume
-Degree of leverage= contribution margin/ operating profit
--> the DOL at any sales volume level represents the sensitivity of operating income to changes in sales volume (to increase operating leverage, move from variable costs to fixed costs)
CVP Analysis with two or more P/S
-if the multiproduct (or multiservice) company can reasonably allocate fixed costs to each product (and if there is no demand interdependencies across p/s), the the company can construct a series of CVP models—one for each p/s
-in the absence of this and if we are willing to assume that the company's p/s sold in a particular sales mix and that this mix remains constant as total volume changes, then we can build a single CVP model for profit-planning purposes
-use weighted average contribution margin per unit or ratio
Weighted-average contribution margin per unit
determined on the basis of the contribution margin per unit for a given product weighed by the sales mix percentage for that product
-sales mix percentages for the purposes of this calculation are based on relative physical units (not sales dollars) for the individual products
Weighted-average contribution margin ratio
determined on the basis of the contribution margin ratios of the individual products weighted by sales mix, as determined on the basis of relative sales dollars (not physical units)
-can be used for breakeven and profit planning for sales volume expressed in dollars rather than units
Value stream accounting and CVP Analysis
when families of products are grouped into value streams in lean accounting, there is an opportunity to use CVP for the product group rather than for a single product or for multiple products
CVP Analysis for Non-for-Profit Organizations
the funding of the not for profit = total fixed costs + total variable costs
Assumptions and limitations of conventional CVP Analysis
the conventional CVP model assumes that the revenue and total costs are linear over the relevant range of activity. (even though the actual cost behavior may not be linear) But many cost functions are nonlinear in nature when considering the entire range. Bunt when we confine our analysis to the relevant range we can use linearity assumption
-calculations performed within the context of the traditional CVP model should not be used outside the relevant range of activity
-step costs: makes an approximation via relevant range unworkable. More cumbersome
-assumes constant inputs: selling price, multiproduct sales mix, inventory levels