AP Stats Final
1/39
Earn XP
Description and Tags
Claude Answers
Name | Mastery | Learn | Test | Matching | Spaced | Call with Kai |
|---|
No analytics yet
Send a link to your students to track their progress
40 Terms
A commercial for a breakfast cereal is shown during a certain television program. The manufacturer of the cereal wants to estimate the percent of television viewers who watch the program. The manufacturer wants the estimate to have a margin of error of 0.1 at a level of 95% confidence. Of the following, which is the smallest sample size that will satisfy the manufacturer's requirements?

A Chi-square distribution with 13 degrees of freedom is a correct model for
Students in a large anthropology class measured the time, in seconds, that it took each of them to complete a certain task. The times were later converted to minutes. If a student had a standardized score of z = 1.72 before the conversion, what is the standardized score for the student after the conversion?
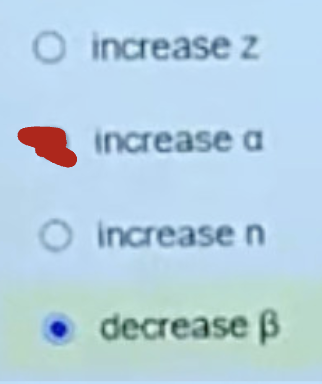
An independent research firm conducted a study of 100 randomly selected children who were participating in a program advertised to improve mathematics skills. The results showed no statistically significant improvement in mathematics skills, using α = 0.05. The program sponsors complained that the study had insufficient statistical power. Assuming that the program is effective, which of the following would be an appropriate method for increasing the power in this context?
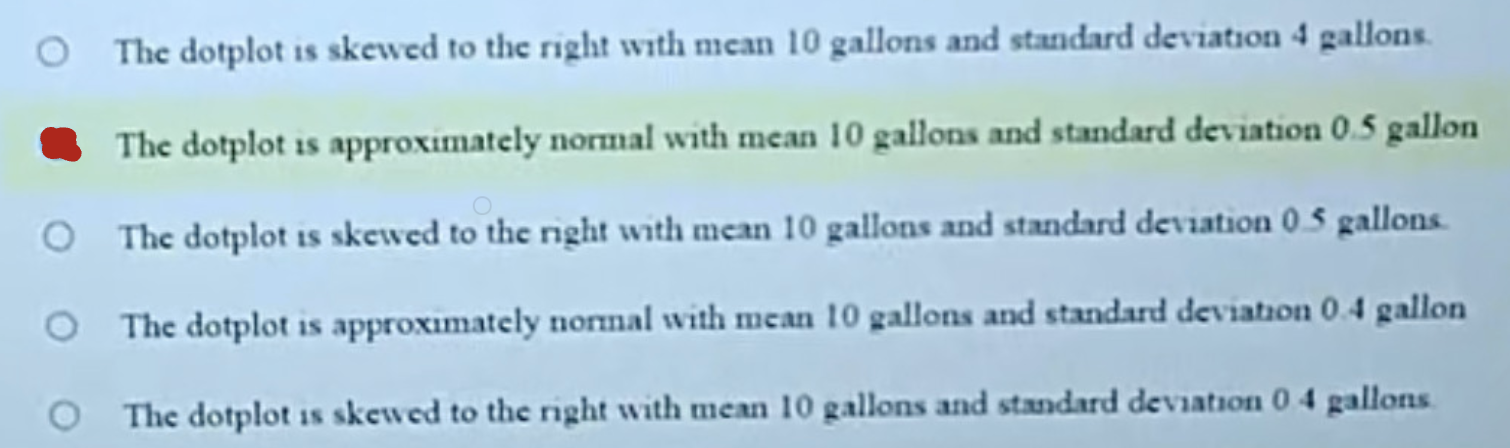
Based on records kept at a gas station, the distribution of gallons of gas purchased by customers is skewed to the right with mean 10 gallons and standard deviation 4 gallons. A random sample of 64 customer receipts was selected, and the sample mean number of gallons was recorded. Suppose the process of selecting a random sample of 64 receipts and recording the sample mean number of gallons was repeated for a total of 100 samples. Which of the following is the best description of a dotplot created from the 100 sample means?
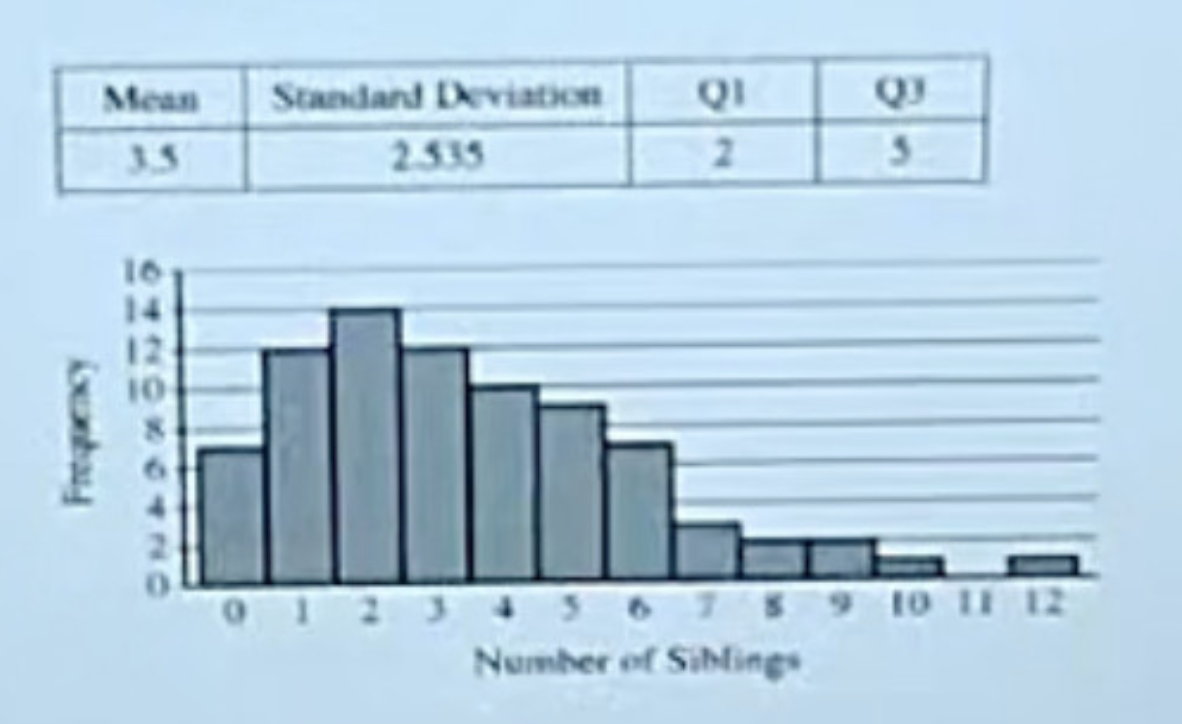
The number of siblings was recorded for each student in a group of 80 students.
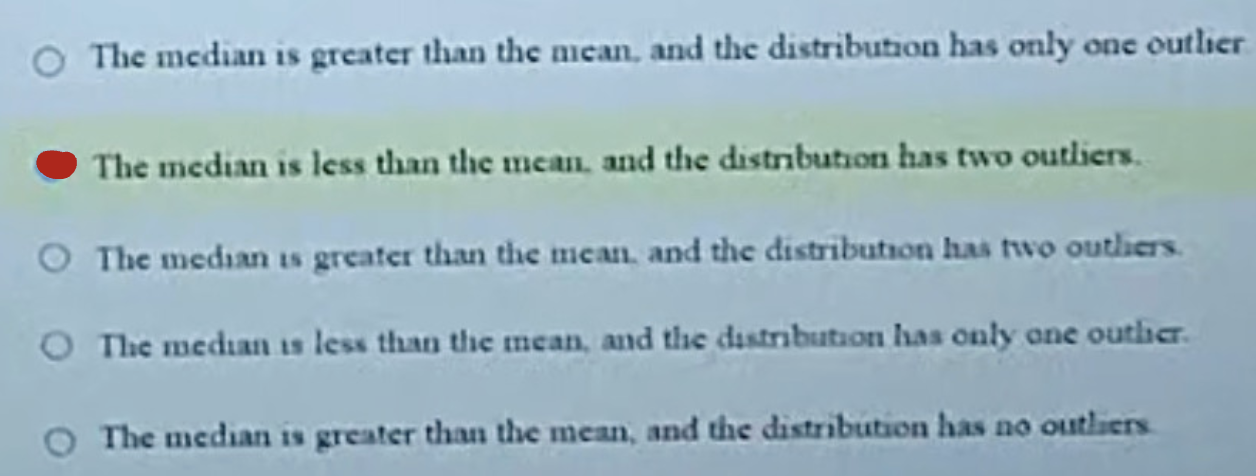
An outlier is often defined as a number that is more than 1.5 IQR below the first quartile or above the third quartile. Using that definition of an outlier and the given information, which of the following can be concluded?

The higher the level of confidence, the wider the confidence interval becomes.
B) True
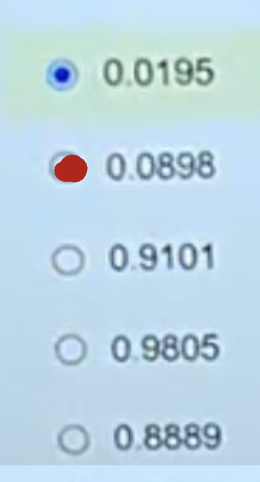
A blind taste test will be conducted with 9 volunteers to determine whether people can tell the difference between bottled water and tap water. Each participant will taste the water from two different glasses and then identify which glass he or she thinks contains the tap water. Assuming that people cannot taste a difference between bottled water and tap water, what is the probability that at least 7 of the 9 participants will correctly identify the tap water?
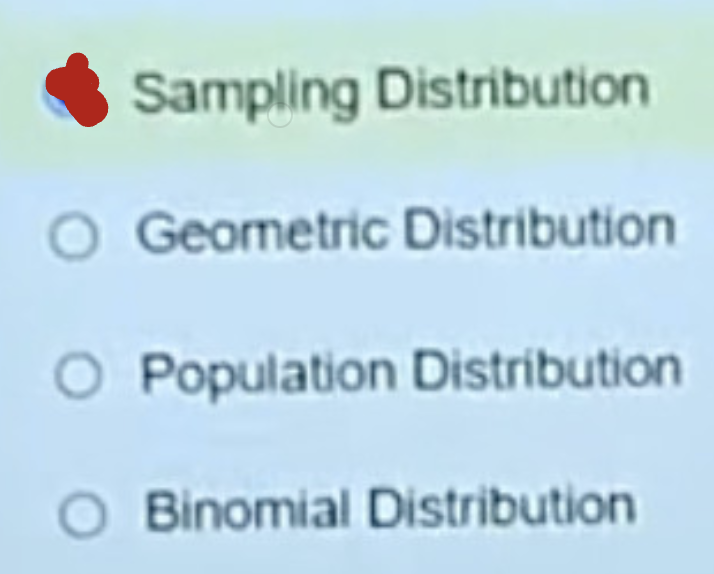
What is the distribution of means of all possible samples of size n of a population?
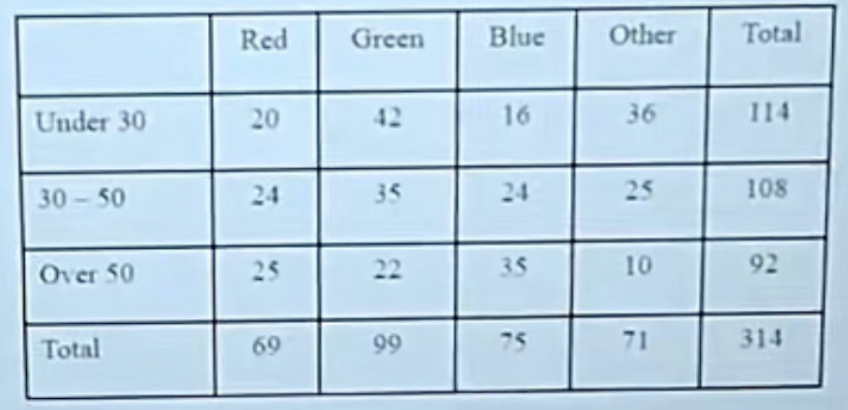
Each person in a random sample of adults indicated his or her favorite color. The results are reported by age group of the respondents.
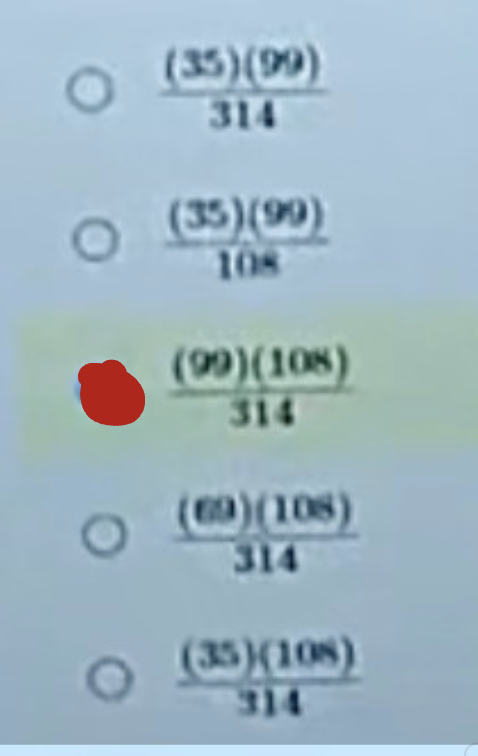
If choice is independent of age group, which of the following expressions is equal to the expected number of respondents who are aged 30 to 50, inclusive, and prefer green?
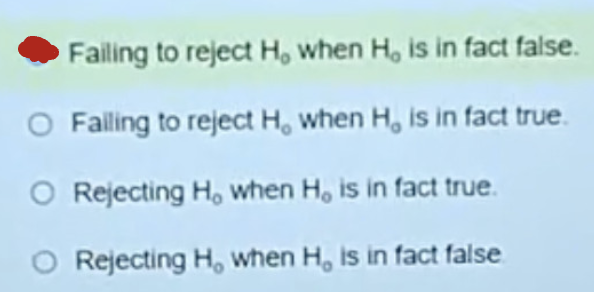
Which of the following is an example of a Type II error?
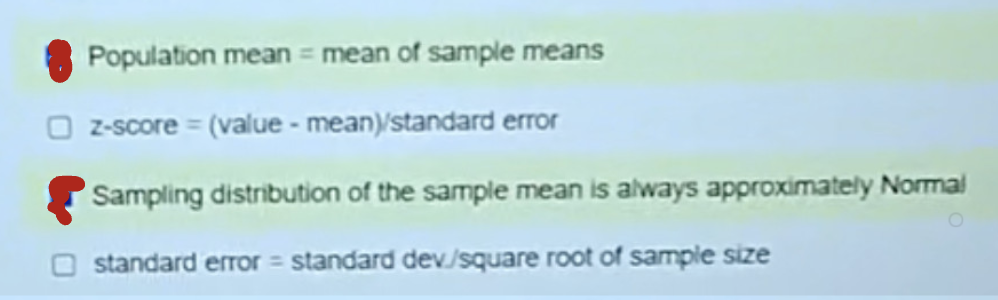
Which is part of the Central Limit Theorem? (Select all that apply)
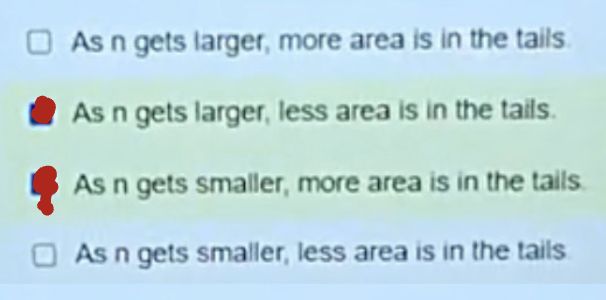
How does a t-distribution change based on sample size? (Select all that apply)
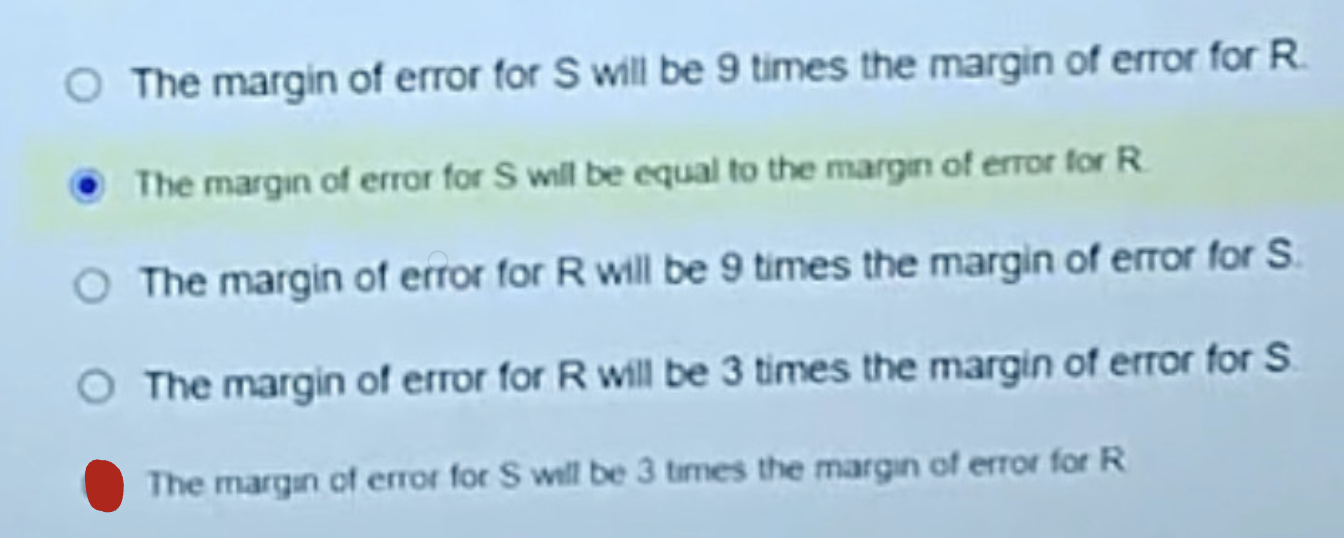
A 99 percent one-sample z-interval for a proportion will be created from the point estimate obtained from each of two random samples selected from the same population: sample R and sample S. Let S represent a random sample of size 1,000, and let R represent a random sample of size 9,000. If the point estimate obtained from R is equal to the point estimate obtained from S, which of the following must be true about the respective margins of error constructed from those samples?
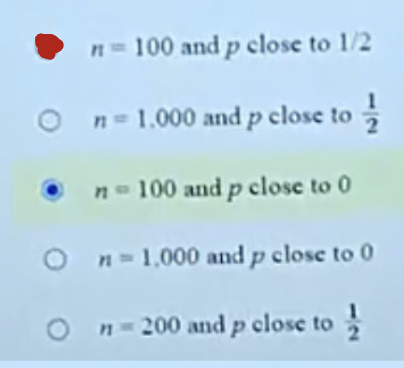
Which of the following sample size n and population proportion ppp would produce the largest standard deviation for the sampling distribution of a sample proportion p^\hat{p}p^?
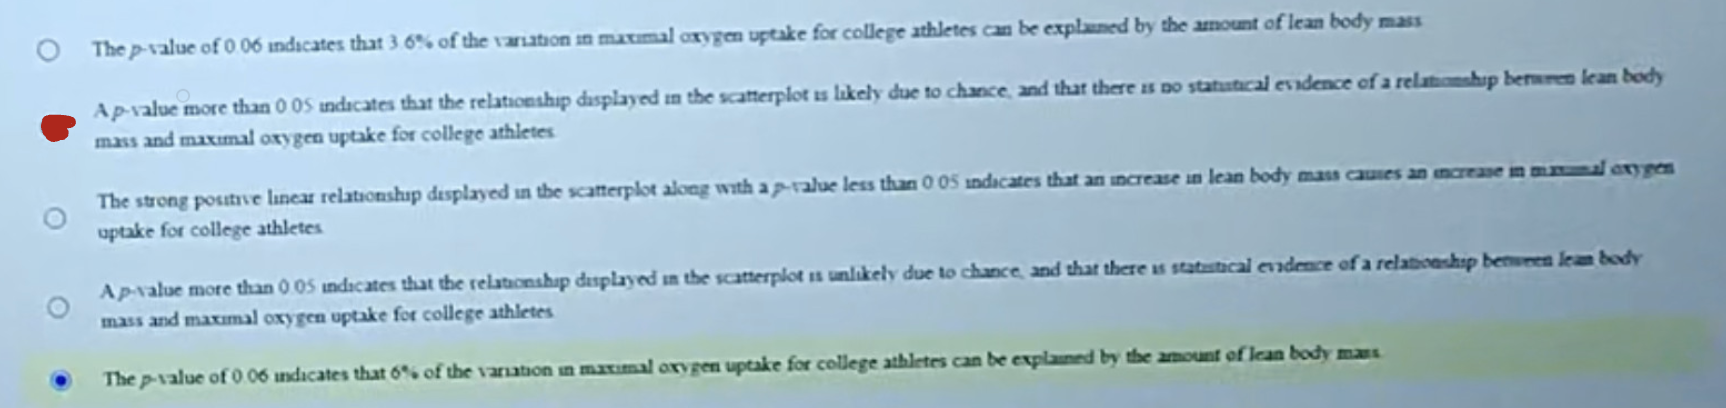
Researchers believed that an increase in lean body mass is associated with an increase in maximal oxygen uptake. A scatterplot of the measurements taken from 18 randomly selected college athletes displayed a strong positive linear relationship between the two variables. A significance test for the null hypothesis that the slope is 0 versus the alternative that the slope is greater than 0 yielded a p-value of 0.06. Which statement is an appropriate conclusion for the test
B) A p-value more than 0.05 indicates that the relationship displayed in the scatterplot is likely due to chance, and that there is no statistical evidence of a relationship between lean body mass and maximal oxygen uptake for college athletes
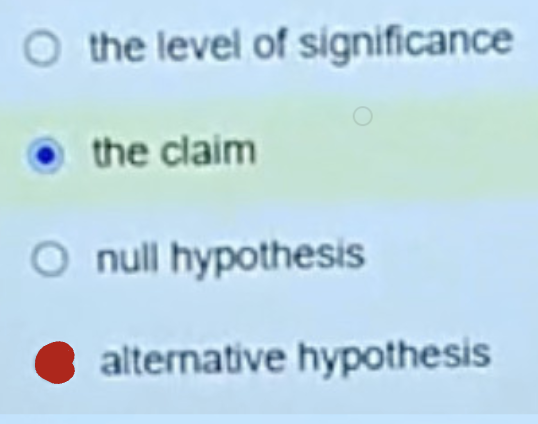
The type of tailed-testing (one or two) is always determined by the
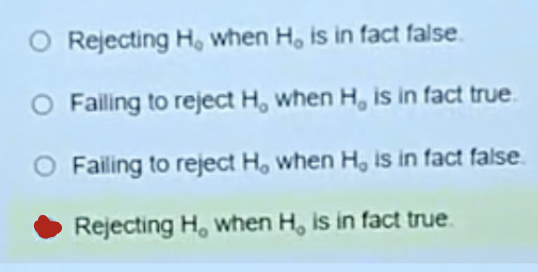
Which of the following is an example of a Type I error?
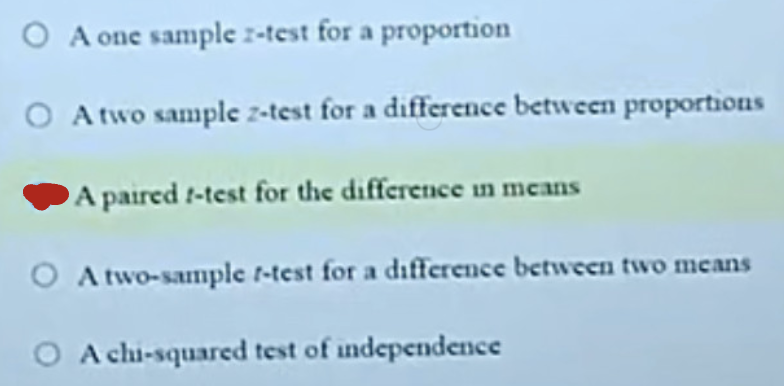
A team of psychologists studied the effect of multitasking on cognitive tasks. A group of 40 women participated in the study. Each woman owned a smartphone equipped with the same type of keyboard. The women typed a text passage on the phone twice, one time while sitting in a quiet room (a single task) and the other time while walking (a multitask). The orders of the single task and multitask was randomly determined for each woman. The psychologists recorded the time it took each woman to type the text for both tasks. If conditions are met, which of the following tests is most appropriate to analyze the data?
C) A paired t-test for the difference in means
Which is a matched pairs design?
D) Subjects are matched into pairs based on lurking variables
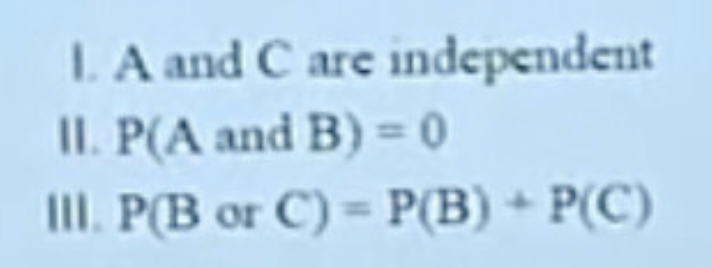
An experiment has three mutually exclusive outcomes, A, B, and C. If P(A) = 0.12, P(B) = 0.62, and P(C) = 0.26, which of the following must be true?

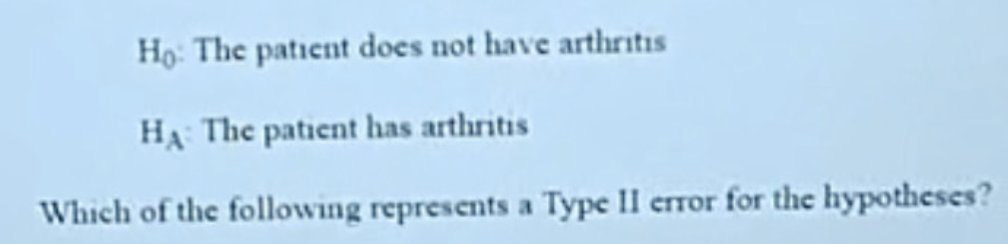
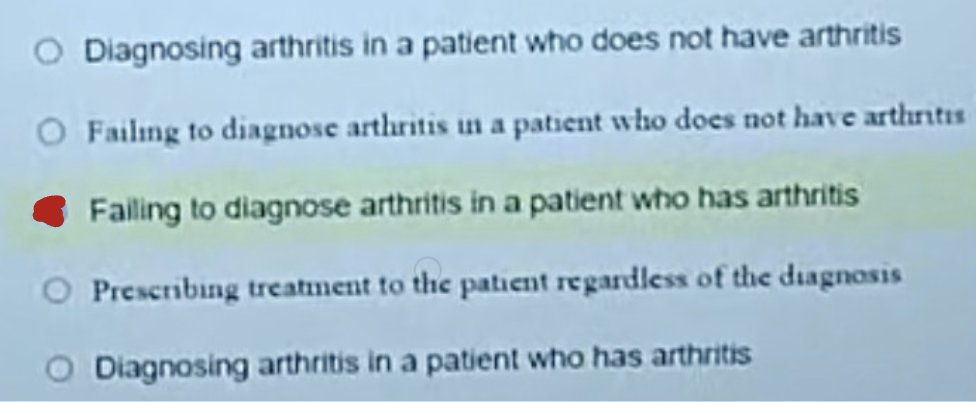
A medical doctor uses a diagnostic test to determine whether a patient has arthritis. A treatment will be prescribed only if the doctor thinks the patient has arthritis. The situation is similar to using a null and alternative hypothesis to decide whether to prescribe the treatment. The hypotheses might be stated as follows:
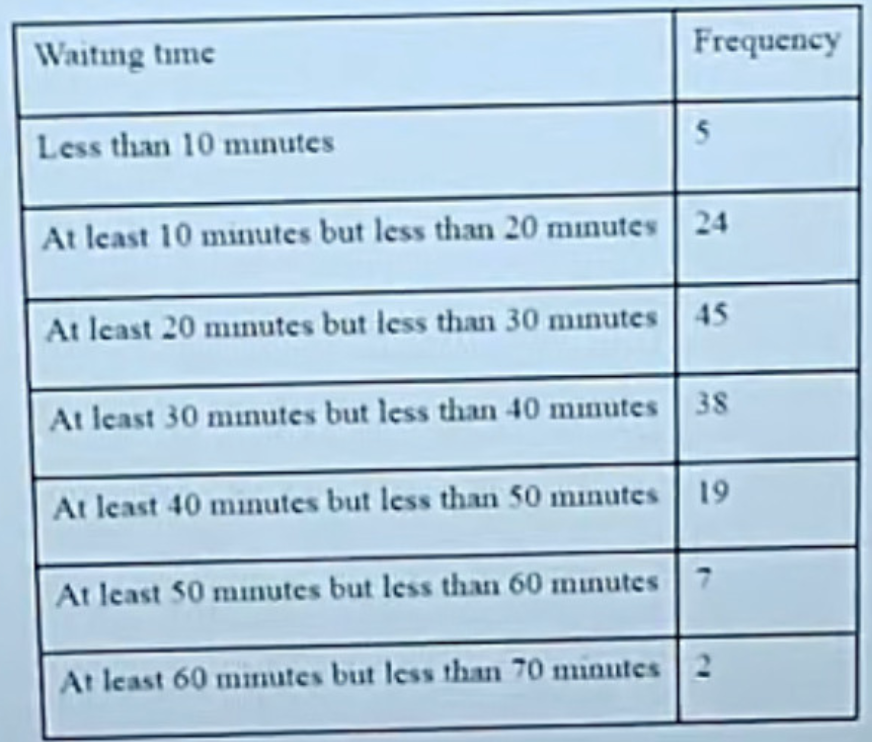
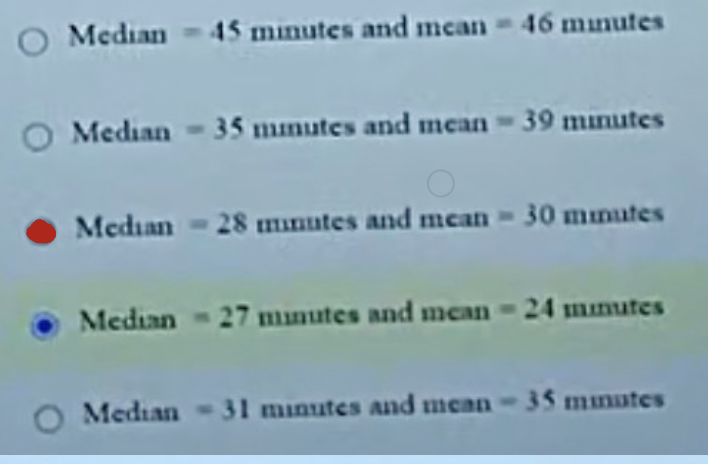
The frequency table below summarizes the times in the last month that patients at the emergency room of a small-time hospital waited to receive medical attention.
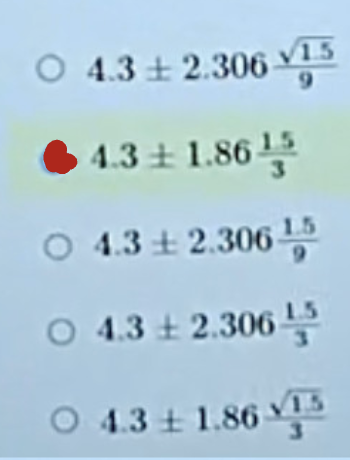
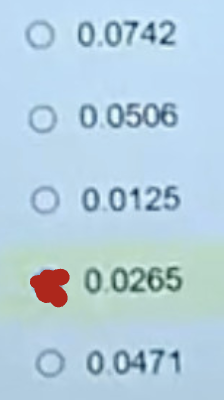
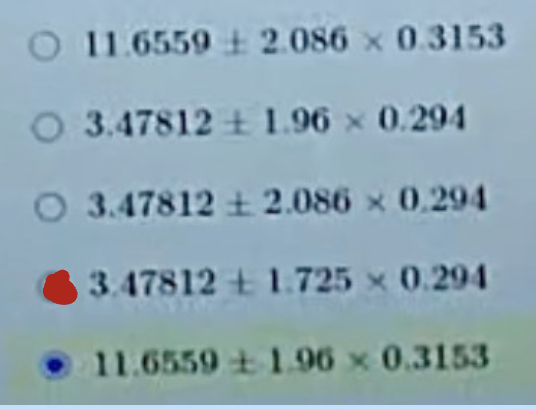
Ecologists wanted to estimate the mean biomass (amount of vegetation) of a certain forested region. The ecologists divided the region into plots measuring 1 square meter each, and they selected a random sample of 9 plots. The mean biomass of the 9 plots was 4.3 kilograms per square meter (kg/m²) and the standard deviation was 1.5 kg/m². Assuming all conditions for inference are met, which of the following is a 90 percent confidence interval for the population mean biomass, in kg/m²?
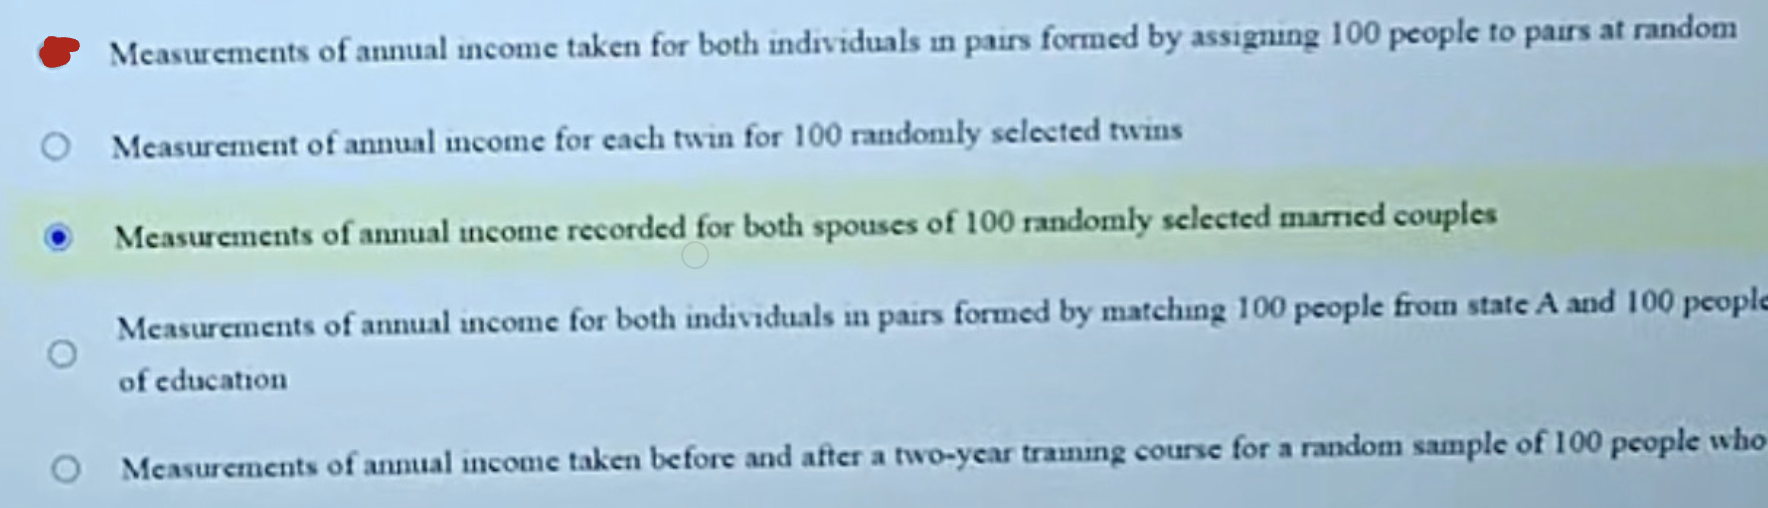
A paired t-test is NOT appropriate for which of the following?
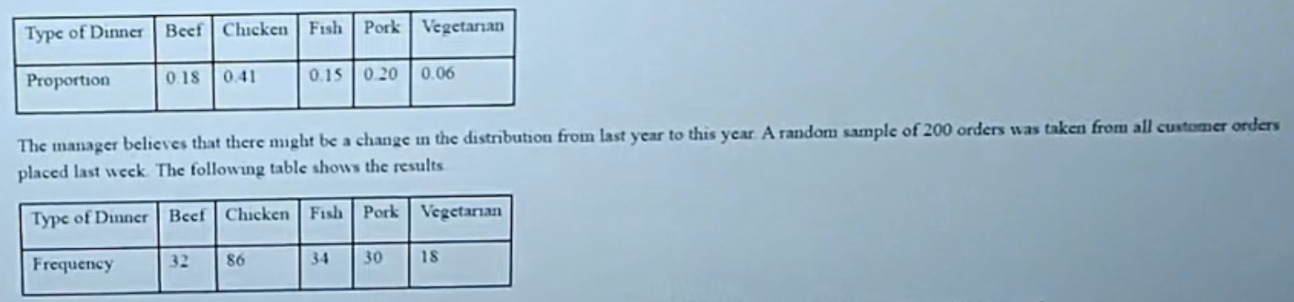
The manager of a restaurant tracks the types of dinners that customers order from the menu to ensure that the correct amount of food is ordered from the supplier each week. Data from customer orders last year suggest the following weekly distribution.
Assume each order is independent. For which type of dinner is the value of its contribution to the appropriate test statistic the greatest?
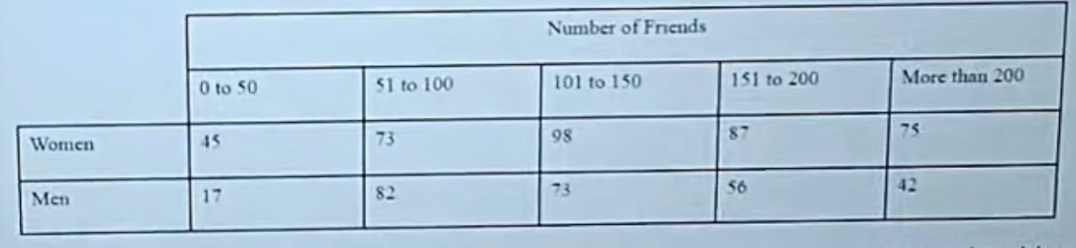
A group of men and women were surveyed to investigate the association between gender and the number of friends the person has on a social media website. Results are shown in the table below.
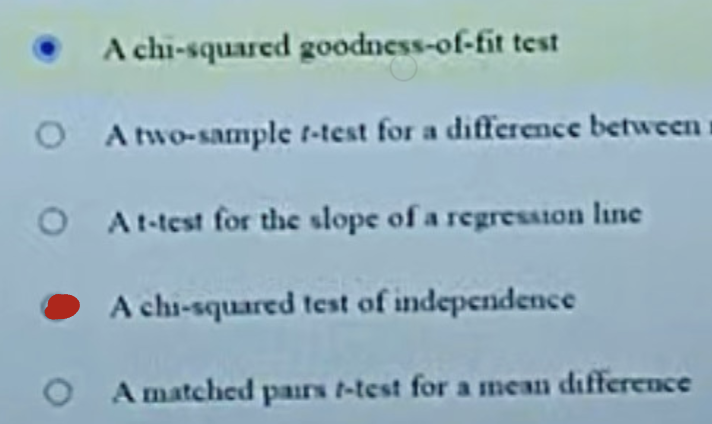
Which of the following procedures is most appropriate for investigating whether an association exists between gender and the number of friends a person has on a social media website?
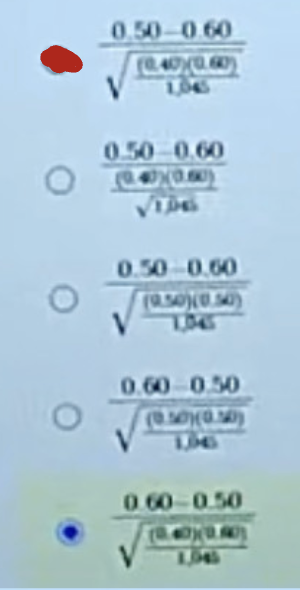
A survey of a random sample of 1,045 young adults found that 50 percent do not have a landline telephone number. A hypothesis test will be used to determine whether the data provide convincing statistical evidence that less than 60 percent of all young adults do not have a landline telephone number. Which of the following is the test statistic for the appropriate test?
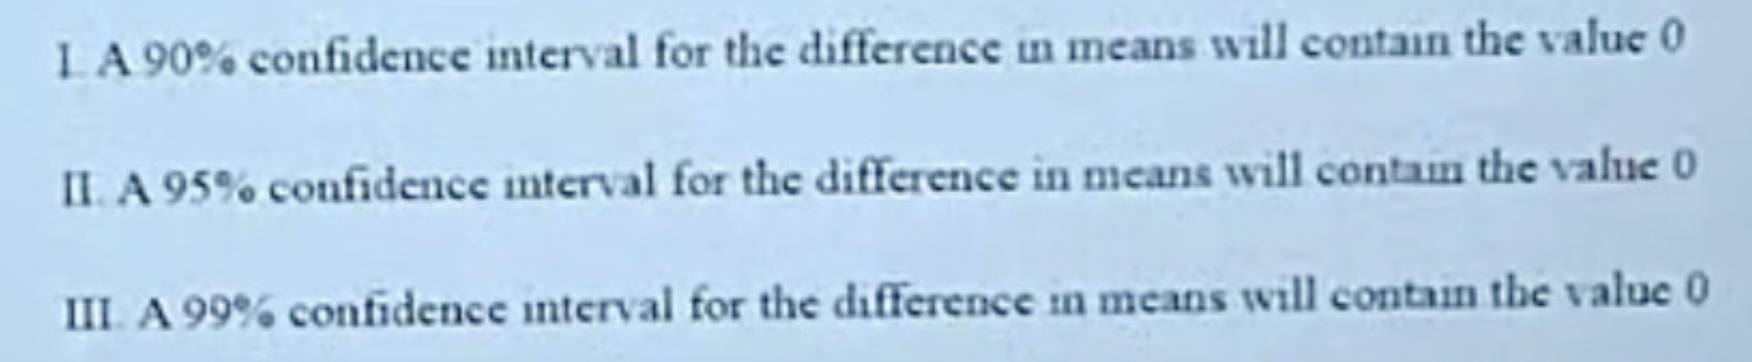
A two-sample t-test of the hypotheses H₀: μ₁ - μ₂ = 0 versus H_A: μ₁ - μ₂ > 0 produces a p-value of 0.06. Which of the following must be true?
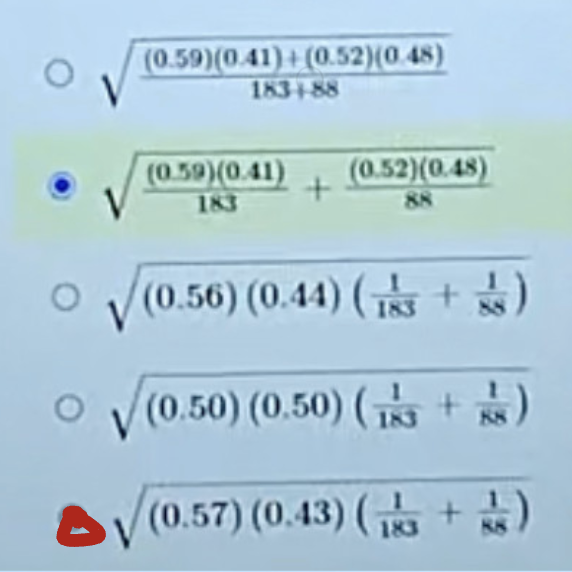
As part of a national sleep study, a random sample of adults was selected and surveyed about their physical activity and the number of hours they sleep each night. Of the 183 adults who exercised regularly (exercisers), 59% reported sleeping at least 7 hours at night. Of the 88 adults who do not exercise regularly (non-exercisers), 52% reported sleeping at least 7 hours at night. Which of the following is the most appropriate standard error for a hypothesis test for the difference in proportions of adults who sleep at least 7 hours at night among exercisers and non-exercisers?
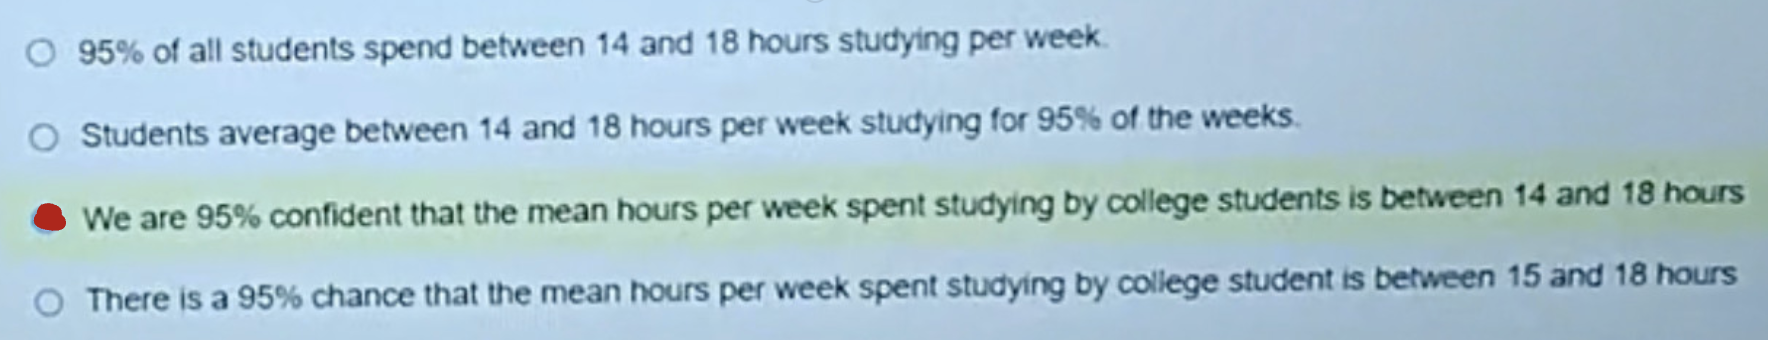
A 95% CI for mean hours per week studying by college students was (14, 18). Which is true?
A test of the hypothesis H₀: μ = 0 versus H_A: μ > 0 was conducted using a sample of size 4. The test statistic was t = 3.107. Which of the following is closest to the p-value of the test?
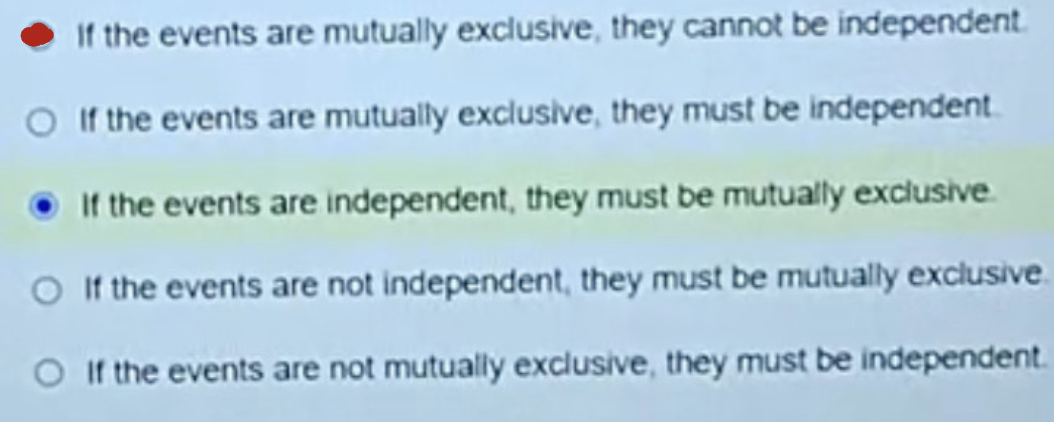
Which of the following statements is true for two events, each with a probability greater than 0?
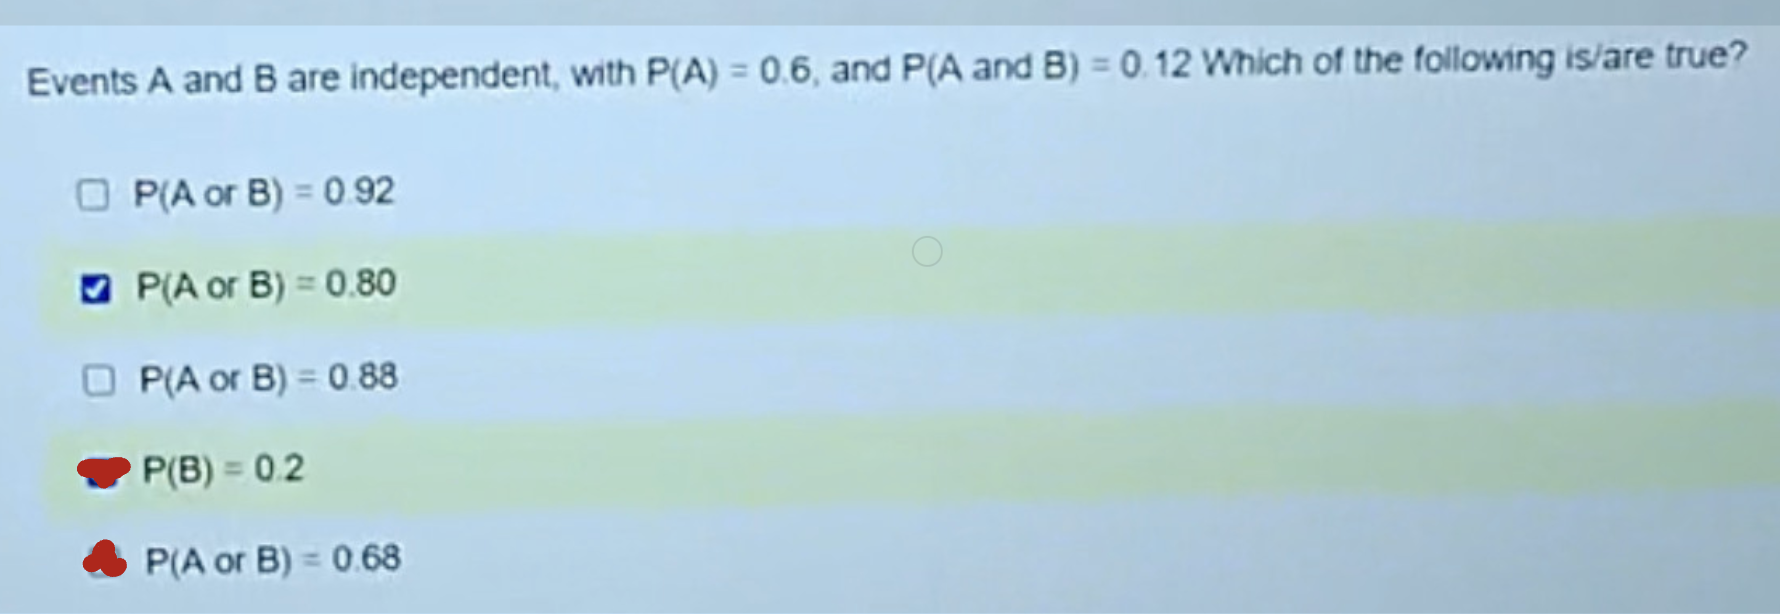
Events A and B are independent, with P(A) = 0.6, and P(A and B) = 0.12. Which of the following is/are true? (Select all that apply)
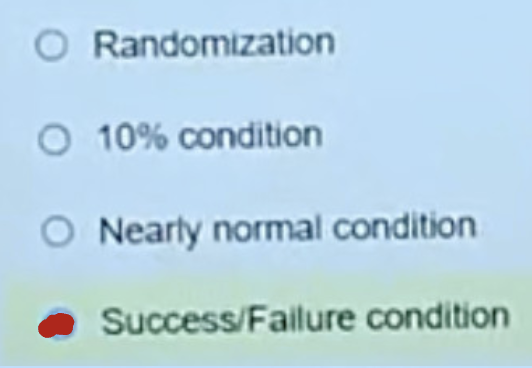
Which assumption does not need to be checked when using the t-distribution?
Which of the following will always increase the probability of making a Type I error?
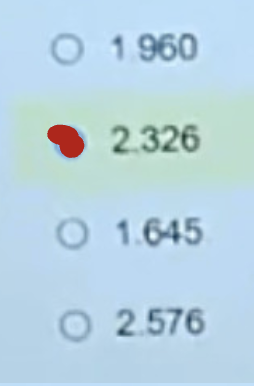
What z* is used for the 98% confidence interval?
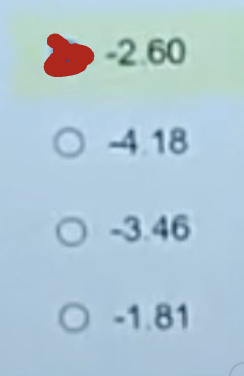
A McBurgers claims that the average weight of the meat on a burger is at least 120 grams, but a random sample of 12 burgers yielded a sample mean of 117 grams with a st. deviation of 4 grams. Is this evidence that the burgers served are less than 120 grams of meat? What is the value of your test statistic? (t or z)
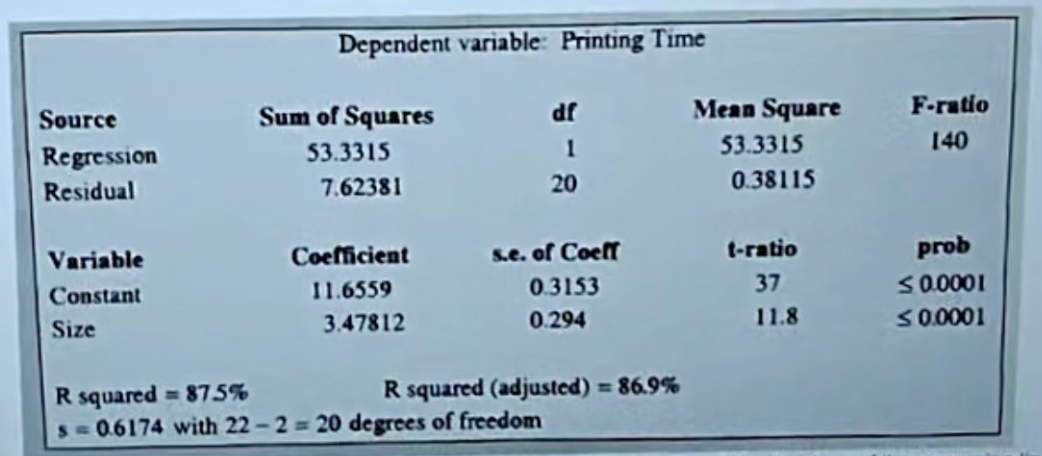
In a study of the performance of a computer printer, the size (in kilobytes) and printing time (in seconds) for each of 22 small text files were recorded. A regression line was a satisfactory description of the relationship between size and printing time. The results of the regression analysis are shown below.
Which of the following should be used to compute a 90% confidence interval for the slope of the regression line?
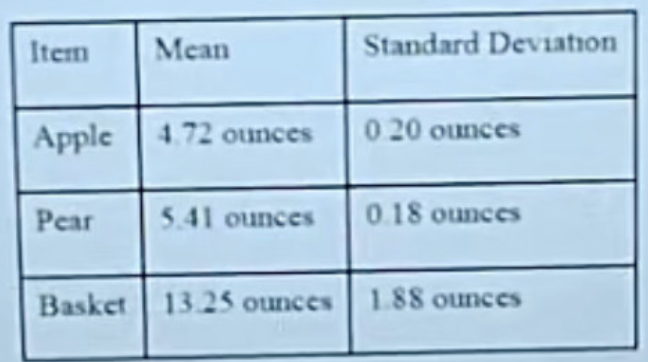
A company ships gift baskets that contain apples and pears. The distributions of the weights for the apples, pears and baskets are each approximately normal. The mean and standard deviation for each distribution is shown in the table below. The weights are assumed to be independent.
Let the random variable W represent the total weight of 3 apples, 5 pears, and 2 baskets. Which of the following is closest to the standard deviation of W?