4 Geography Population and Migration
1/24
There's no tags or description
Looks like no tags are added yet.
Name | Mastery | Learn | Test | Matching | Spaced | Call with Kai |
|---|
No analytics yet
Send a link to your students to track their progress
25 Terms
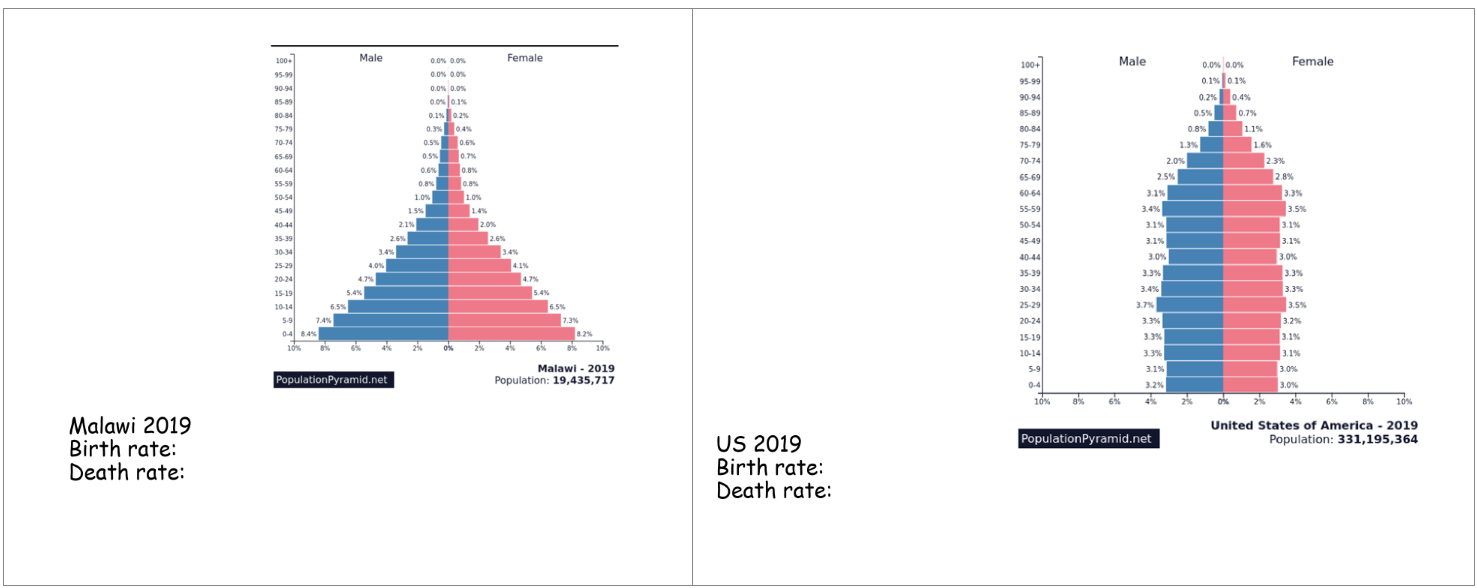
Define Birth rate
Live births per 1000 people per year
Define death rate
Deaths per thousand people per year
Define Total Fertility Rate(TFR)
Average number of children expected to be born to a woman over her lifetime assuming she survive
Replacement rate
2.1bpw
Define infant mortality rate
Number of deaths of children under 1 per 1000 live births
Ages of young population, working population and elderly population
Young population: 0-15
Working population: 16-64
Elderly population: 65+
Dependency ratio
Proportion of those economically active(16-64) to those who are not economically active
Factors affecting fertility
Female literacy/employment - Afghanistan around 7% woman employed, UK around 70%
Access to contraception - Taliban birth control ban in Afghanistan
Economic burden/asset of children
Religion/cultural norms - Catholics → discourages contraception - supports large families
Natalist policies - 1CP
Conflict
Factors affecting mortality rate
Access to healthcare
Nutrition
Population structure - Age
Lifestyle factors - smoking, alcohol, drugs - 40% of Serbians smoke
GDP per capita
Communicable/non-communicable diseases - heart diseases largest global cause of death
Pollution
War
Describe the population pyramid for a LIC, MIC and a HIC
How does gender ratio change as age changes and what is gap in life expectancy
At birth:
Slightly higher change of male birth
prenatal sex selection - 1CP
Elderly population:
5 year gap in life expectancy
Higher infant death rate in men
Men are more vulnerable to communicable diseases/genetic disorders/accidents/violences/suicide
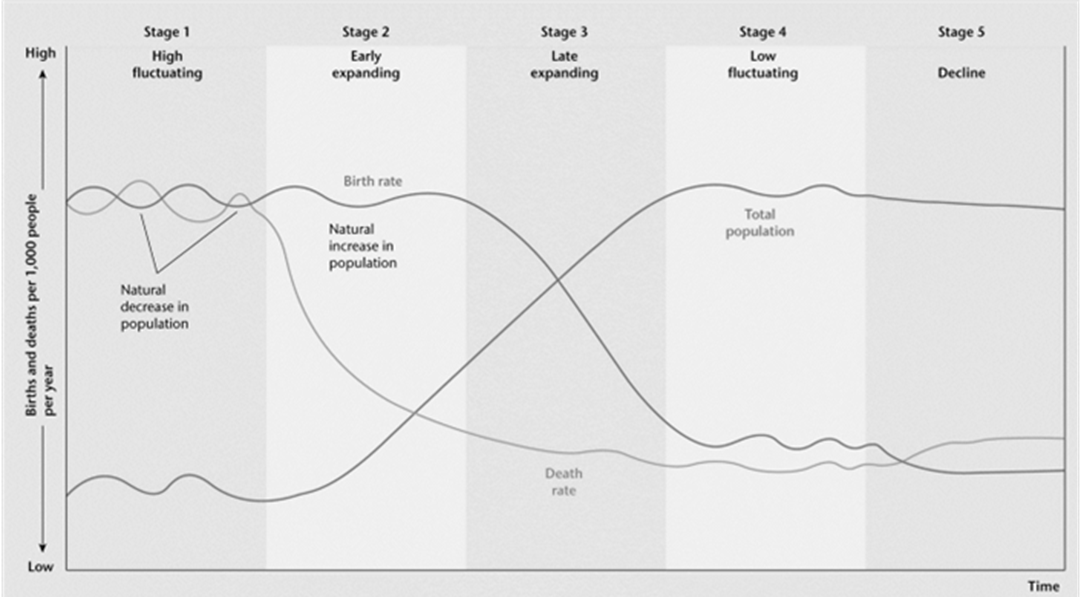
Describe each stage of the DTM
Stage1: High birth and death rate - no population change
Stage2: High birth and decreasing death rate - rapid population growth
Stage3: Decreasing birth and low death rate - slower population growth
Stage4: Low birth and lower death rate - very slow/no population growth
Stage5: Lower birth and low death rate - population decline
stage 1 of DTM
Birth rate: High and fluctuating
Death rate: High and fluctuating
Population change: None
Example country: Remote tribes

STAGE2 of DTM
Birth rate: High
Death rate: Decreasing
Population change: Rapid increase
Example country: Ethiopia

Stage 3 of DTM
Birth rate: Decreasing
Death rate: Low
Population change: Slower increase
Example country: Mexico
Stage 4 of DTM
Birth rate: Low
Death rate: Lower
Population change: None
Example country: France

Stage 5 of DTM
Birth rate: Lower
Death rate: Low
Population change: Decline
Example country: Japan
Evaluation of DTM
DISADVANTAGES
Migration - does not account for migration
Political anomalies - 1CP
Eurocentric model
Impacts of high natural increase
Low access to infrastructure/education
Higher taxes may be needed
House shortages
Congestion
Growing workforce
Unemployment/underemployment
Higher demand on resources - fossil fuels
Younger voters beliefs - environment/equality
Define distance decay
Number of migrants declines as distances between source area and destination increase
Economic migrants and remittances
Migrating for employment - sending money back to your family
Refugees vs asylum seekers vs Internally displaced persons(IDP)
Refugees: have been granted official refugee status and are legally allowed to stay in destination country due to risks in source country
Asylum seekers: Forced migrants who are yet to be granted refugee status
IDPs: forced migrants who remain in source country
Forced vs Impelled migration by who
W. Peterson
Forced: real threats
Impelled: perceived threats - element of choice remains
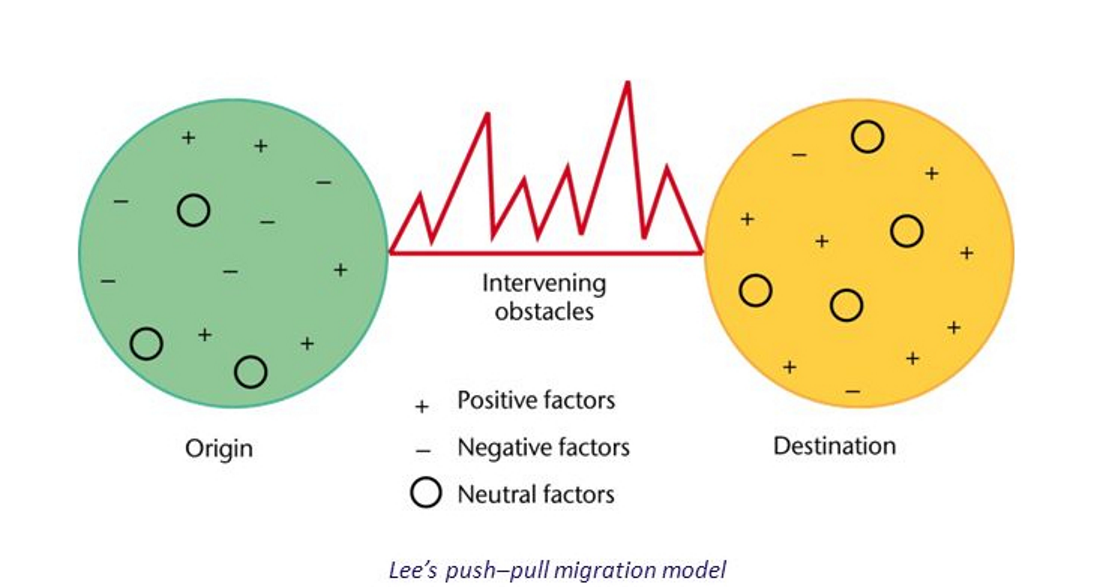
____’s Push-pull migration model
Lee’s 1966 model
If pull factors outweigh the push factors of a particular place and the intervening obstacles can be overcome then migration will take place
Intervening obstacles: cost of travel, leaving family behind, danger