MKTG 323 Devin Edwards Final
1/29
There's no tags or description
Looks like no tags are added yet.
Name | Mastery | Learn | Test | Matching | Spaced | Call with Kai |
|---|
No analytics yet
Send a link to your students to track their progress
30 Terms
When comparing groups with the t-test, one needs to use interval or ratio data as the testing variable, and nominal or ordinal data as the grouping variable.
Options:
● False
● True
True
A researcher decides to assign a value of 1 if the respondent is male and 2 if the respondent is female. This process is called:
Options:
● Editing
● Coding
● Data tabulation
● Validation
● Data summarization
Coding
For a retail store, a very strong positive relationship exists between TV advertising spending and sales. What correlation coefficient is most
appropriate?
Options:
● 0.05
● 0.90
● -0.05
● -0.80
● 0.70
0.90
Cross-tabulation is most often used with nominally or ordinally scaled data as both the grouping variable and the testing variable.
Options:
● False
● True
True
A scatterplot shows points roughly forming a circle. The relationship
between the two variables is:
Options:
● Very close to zero
● Circular, positive
● Linear, negative
● Circular, negative
● Linear, positive
Very close to zero
The strength of association between two variables is determined by the size of the correlation coefficient.
Options:
● False
● True
True
If a marketing manager wants to be 95% certain of a result, the p-value should be:
Options:
● 0.04
● 0.95
● 0.03
● 0.05
● 0.02
0.05
Which test is appropriate when comparing male vs. female students on the average number of hours they study per weekday?
Options:
● Compare means (T-test)
● Random groups
● ANOVA
● Cross tabulations (Chi-square test)
Compare means (T-test)
Which measure tells you how similar or dissimilar the numbers in a
dataset are?
Options:
● Standard deviation
● Mean
● Cross-tabulation
● Mode
● Median
Standard deviation
Which p-value is most statistically significant?
Options:
● 0.2
● 0.3
● 0.01
● 0.05
● 0.1
0.01
If consumers rate price at a McDonald's restaurant on a 7-point scale
using 1 for Unsatisfactory and 7 for Satisfactory, a mean score of 2.34
would be interpreted as:
Options:
● A neutral price
● An unsatisfactory price
● A very satisfactory price
● An average price
● A satisfactory price
An unsatisfactory price
While studying the relationship between advertising and sales growth, a researcher determines that the relationship is sometimes weak and at other times moderate. This variation from one situation to another is the variation in the _____ of the relationship between advertisement and sales growth.
Options:
● Dispersion
● Strength of association
● Type
● Direction
● Presence
Strength of association
What is the mode of the following: 2, 3, 3, 4, 5, 5, 6, 6, 6, 7, 8
Options:
● 7
● 5
● 6
● 4
● 8
6
When analyzing whether males vs. females study each weekday
(yes/no), which test should be used?
Options:
● Paired samples t-test
● Independent samples t-test
● Chi-square test with crosstab
● Random groups t-test
● Related samples t-test
Chi-square test with crosstab
Chi-square analysis compares observed frequencies with expected
frequencies.
Options:
● False
● True
True
A relationship being "positive or negative" refers to its:
Options:
● Type (linear vs. non-linear)
● Direction
● Strength of association
● None of the above
● Presence
Direction
A researcher is told that the average age of respondents in a survey is 49 years. She is interested in finding out if most respondents are close to 49 years or not. The measure most appropriate to answer this question is:
Options:
● Standard deviation
● Mean
● Median
● Mode
● Range
Standard deviation
Which measure best describes the central tendency for nominal data?
Options:
● Standard deviation
● Mean
● Median
● Variance
● None of the above
None of the above
When coding, researchers prefer using verbal codes (such as labels
"male" or "female") instead of numerical codes (such as "1" for male and "2" for female) because verbal codes are easier to interpret.
Options:
● True
● False
False
There are two types of data: quantitative and qualitative.
Options:
● False
● True
True
Which statement is false about cross-tabulation?
Options:
● It reports percentages of responses in each group in the percentage table.
● It is used to determine subgroup differences.
● It reports frequencies for each group in the original data table.
● Generally speaking, demographic variables are used as rows and other research variables are used as columns in a cross-tab
Generally speaking, demographic variables are used as rows and other research variables are used as columns in a cross-tab
A researcher wants to measure the degree of association between two variables, education and product knowledge. Education is measured by asking respondents to choose from one of the four options: less than high school, high school, some college, college graduate. Product knowledge is measured by asking respondents to pick from one of the three options: no knowledge, some knowledge, very knowledgeable. Given this information, which of the following measures would be appropriate?
Options:
● Scatter plot
● Coefficient of determination
● Pearson correlation
● Chi-square test
Pearson correlation
For a restaurant, there exists a weak relationship between the number of complaints managers received and sales. As the number of complaints increases, sales go down. Which of the following seems to be the most appropriate Pearson correlation coefficient for this relationship?
Options:
● 0.90
● -0.50
● -0.25
● 0.05
● 0.50
-0.25
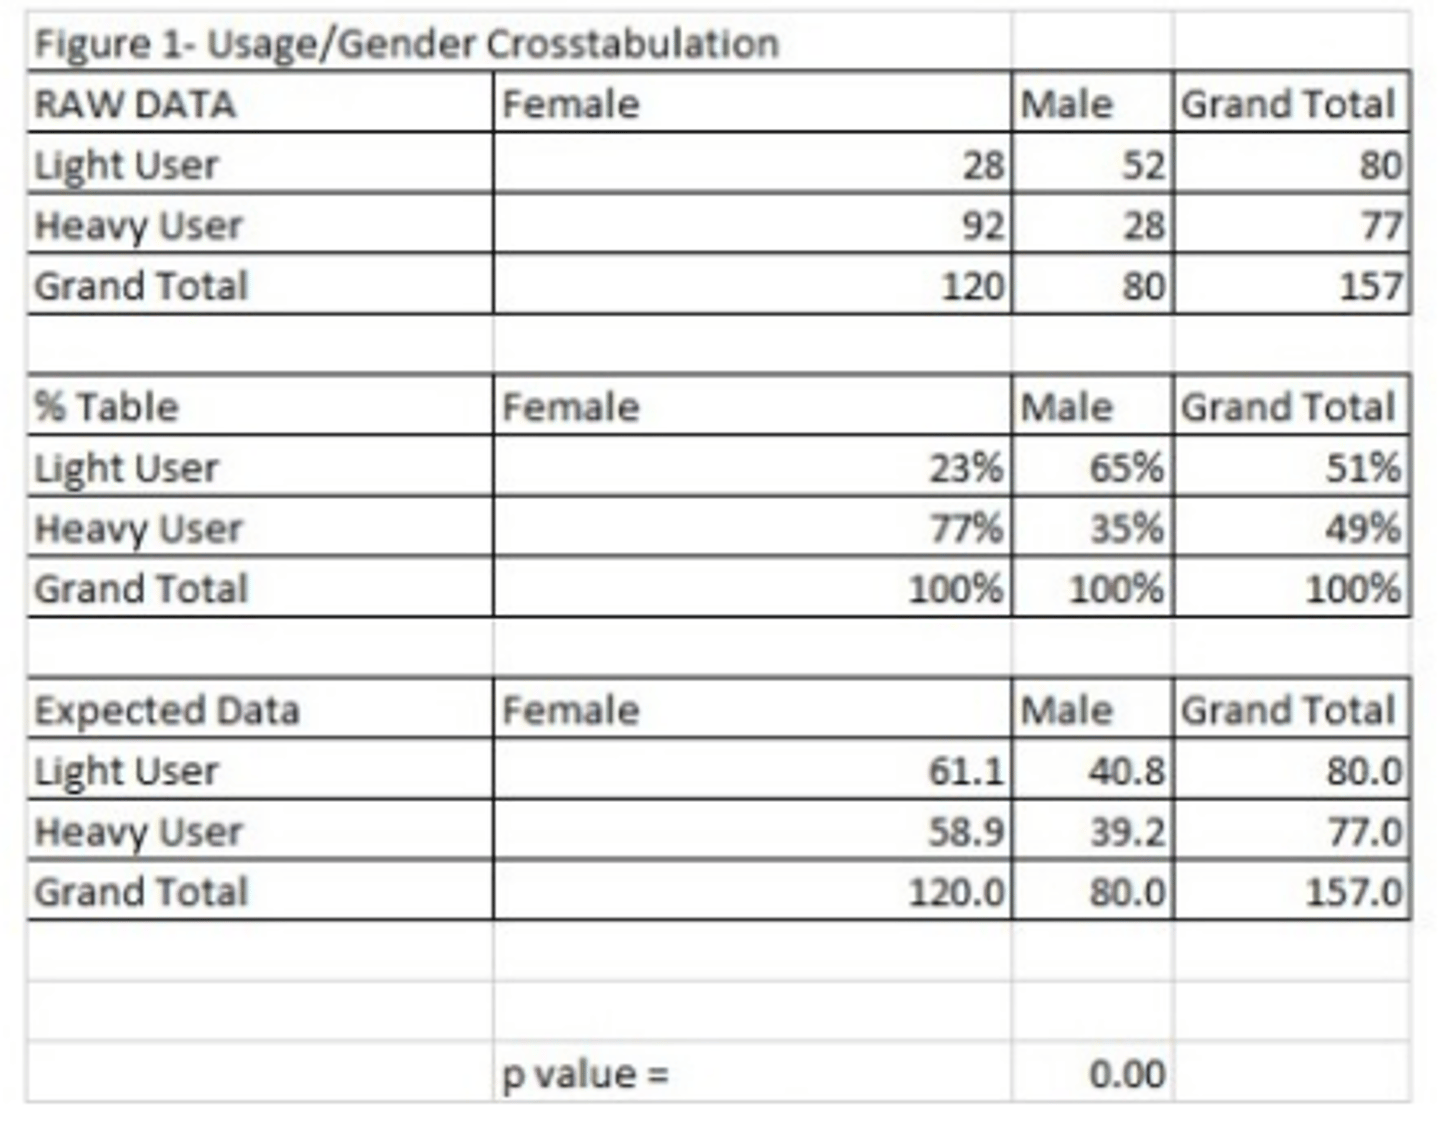
Heavier users represent what % of all users in this data?
Options:
● 51
● 65
● 35
● 49
● 77
49
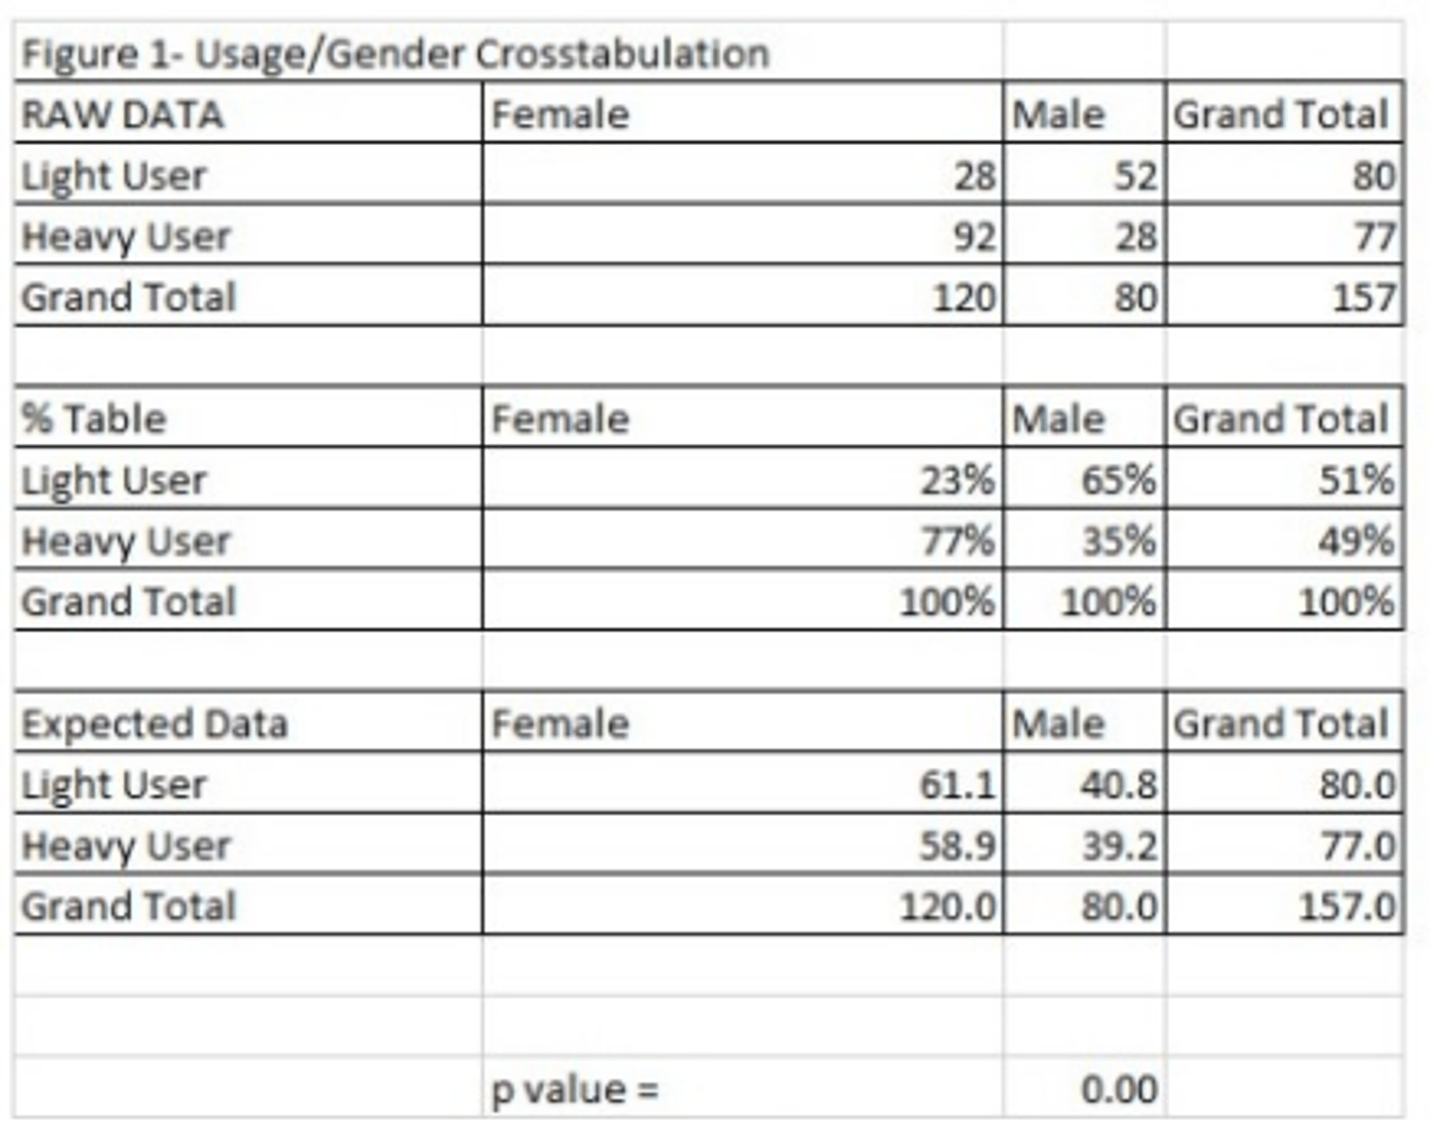
What % of all males are heavy users?
Options:
● 35
● 40
● 14
● 65
● 23.3
35
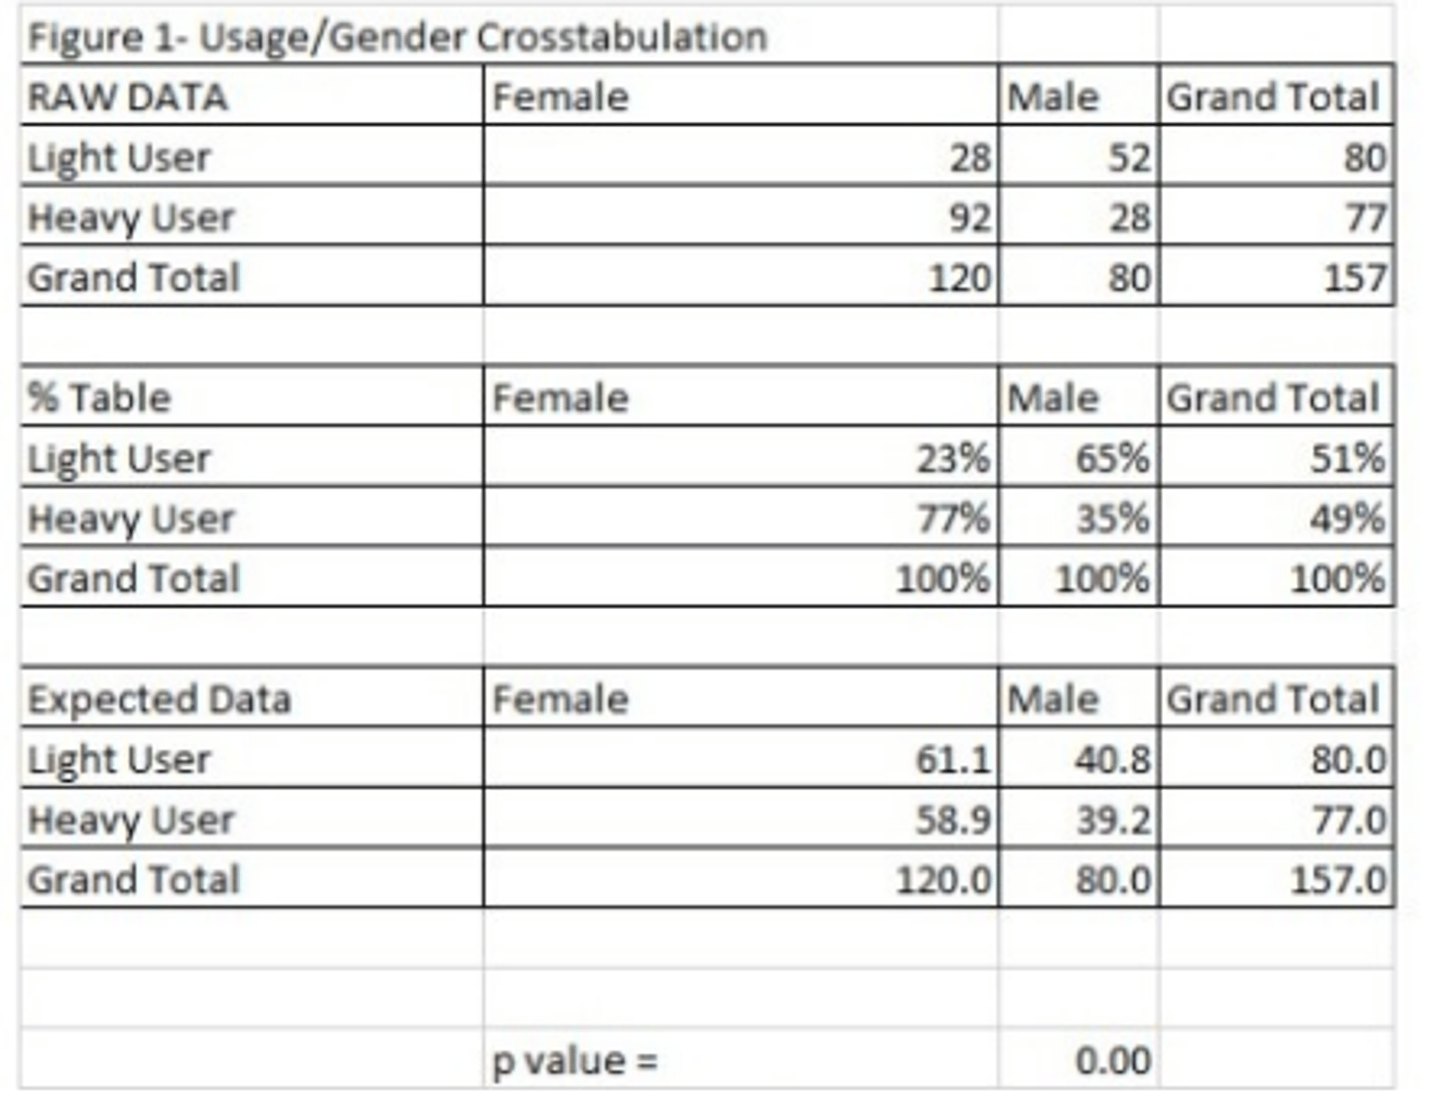
To determine differences between males & females on usage, what test should be used? Is it significant?
Options:
● Chi-square test; Yes significant
● T-tests; Yes significant
● Regression; No not significant
● T-tests; No not significant
● Chi-square test; No not significant
Chi-square test; Yes significant
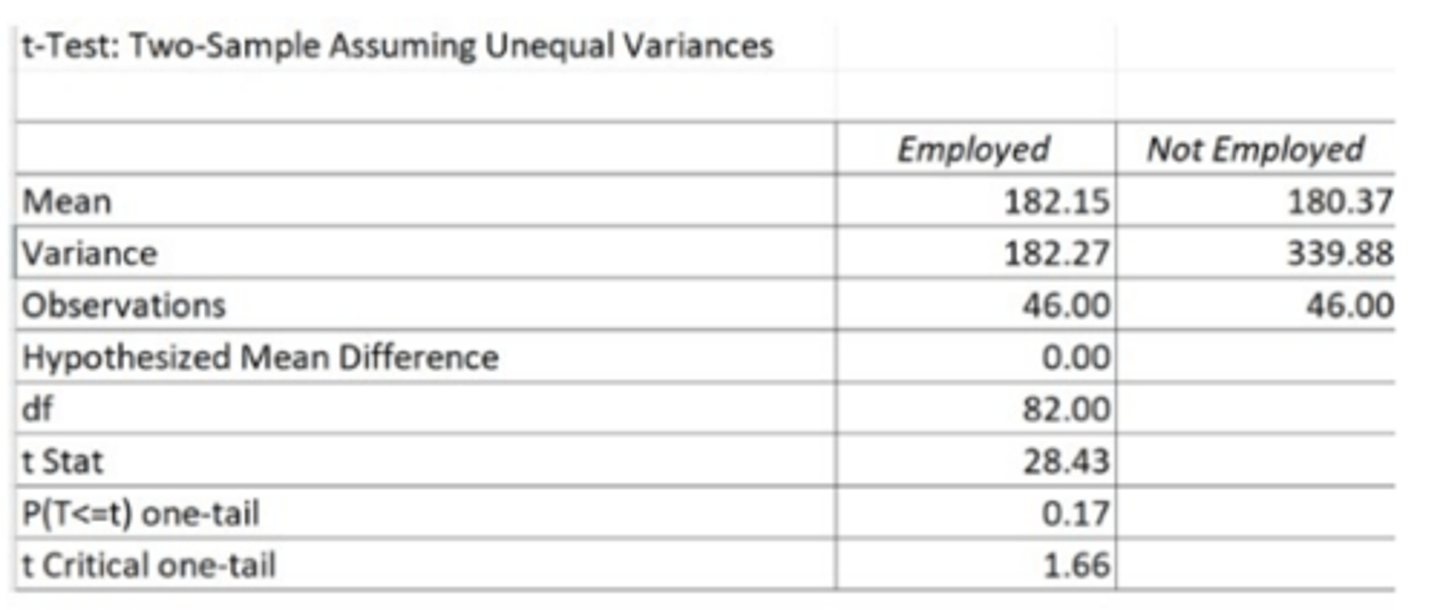
Test variable: Amount spent online
Grouping Variable: Are you employed?
What can we conclude from the output in this figure?
Options:
● Employed spent less time online and the difference is not significant
● Employed spent more time online and the difference is significant
● They spent the same time online because the difference is significant
● They spent the same time online because the difference is not significant
They spent the same time online because the difference is not significant
When conducting compare means analyses, the grouping variable has to be nominal or ordinal.
Options:
● False
● True
True
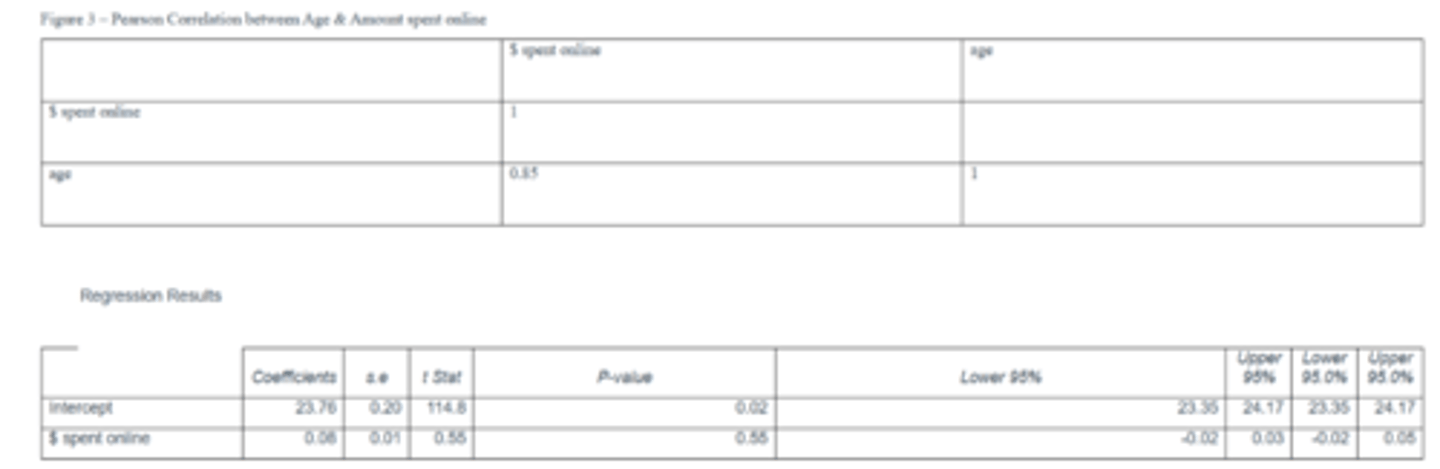
From the above figure, the correlation between age and spending is strong and significant because p = .02.
Options:
● False
● True
False
Median is typically not included in the summary statistics.
Options:
● True
● False
False